Project and Investment Plan Costing
If it isn’t costed it won’t happen! This is the basic rule underlying project costing. Project cost tables are used to summarize the activities that will take place within a project year by year, providing a breakdown of the costs from programme/project level down to activity level. This helps define the critical inputs required to ensure that the goals of a specific programme/project can be achieved within the envisaged timeframe. Whereas investment projects – in particular those financed by an International Financing Institution (IFI) – require detailed project costing, costing of Investment Plans (IP) [See Investment Plans] can be undertaken at a strategic level, providing indicative figures that are less detailed but delineate overall budget needs for the country’s agricultural sector over a multi-year period and reveal “orders of magnitude” that can inform strategic policy choices. Meticulous project cost estimation and presentation is a prerequisite for good project preparation and appraisal, and for satisfactory project implementation. The information provided by costing is used as an input both for planning purposes and for financial monitoring (planned versus actual expenditure) during each stage of the process, by a wide range of audiences. The Ministry of Finance (MoF) may use the project cost estimates to inform the Medium Term Expenditure Framework (MTEF), a budget planning tool utilized by many governments to estimate a three to five-year planning horizon that is used to anticipate future expenditure. As projects financed by loans and/or grants from IFIs contain detailed cost estimates, the information provided to the MoF for purposes of planning should be fairly accurate. The project implementers utilize the cost estimates to make informed management decisions when comparing planned versus actual expenditures and when developing annual work plans and budgets [See Planning & Budgeting]. The cost information may be used to restructure and refine project activities based on existing implementation realities. Policy- and decision-makers require broader, more strategic costing information that is less detailed but provides information for understanding the strategic decisions that may need to be taken within a project. Overall project performance may be negatively affected when costs are not carefully calculated: overestimation of costs can lead to excessive borrowing and inefficient resource use, while underestimation may endanger the satisfactory completion of the project’s activities.
Detailed project costing for investments
Project costing plays a major role throughout the different stages of project development:
- During the identification stage [see Project Identification], costing provides important information to rank options for addressing a set of development problems and opportunities, in terms of general categories and levels of resources required. At the conclusion of this stage, costing can outline the essential scope and design issues for a project, but these are still preliminary and require verification and greater accuracy at the next stage of design.
- In the preliminary design phase, project scope and design issues are formulated and elaborated on the basis of detailed technical, administrative, financial and economic assessments of the proposed interventions. During the financial assessment the financial analyst/economist collects detailed cost estimates from various sources, including: farmers at the farmgate for input and output prices; traders, vendors and marketplaces, both informal and formal; the Ministry of Finance and Economic Planning (to account for price contingencies and to determine the overall state of the economy; ministries of agriculture, trade and industry; microfinance institutions; and other project-specific actors affected by the proposed interventions. For example, for an irrigation project the costs of irrigation equipment for the different stakeholders would need to be collected from traders. At the conclusion of the design stage, the costs should be accurately portrayed and will provide prospective financiers the information they require to consider possible involvement in the project. At this stage the cost estimates are also used to inform the financial and economic analysis (see FEA).
- At the final design/appraisal stage, the costs must be broken down by disbursement and expenditure categories, and by financier. Expenditure categories should try to follow the accounting terminology of the country for which the project is proposed. The disbursement categories are usually broader investment categories that inform the loan/grant agreements defining the broad areas in which expenditure would take place. For example, the broad disbursement category may be “civil works” while the expenditure categories may be further broken down into types of civil works, such as irrigation infrastructure, housing or dam construction. The costs should also be broken down by financier, with a disbursement schedule and procurement plan broken down by disbursement category and financier.
- During project implementation, the detailed cost tables by component/sub-component (if available) provide the basis for constructing annual work programmes, budget requests and project monitoring at different levels (government, implementing agencies, and financing institutions). The cost tables become a management tool that can inform implementers based on the rate and categories of disbursement and allow for decision-making to further refine and respond to beneficiary/participant demands.
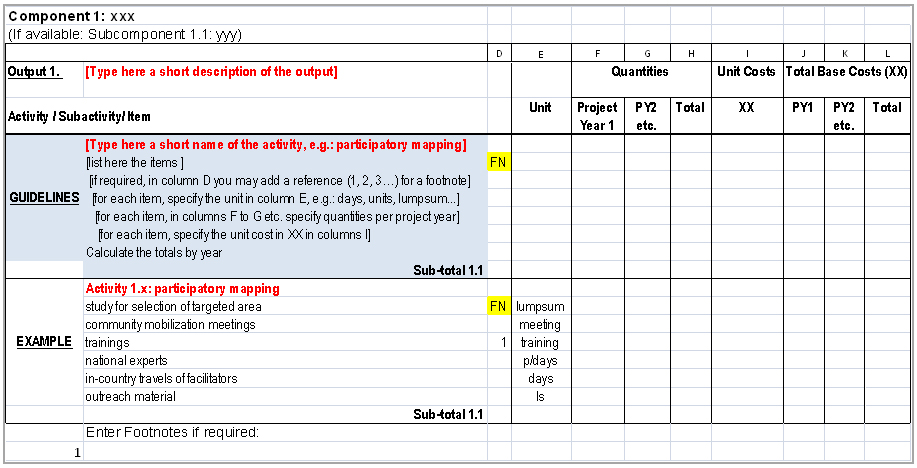
- A typical detailed cost table will have the following elements: component, subcomponent, and a list of activities and items (see example below). Depending on the size of the project each (sub) component can have one or several output statements.
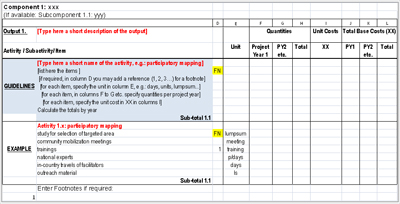
- [Click to view full image]
Costing Investment Plans
Costing of IPs is done at the strategic level, which is differentiated from project level costing by the degree of detail of the costing exercise. The costing of IPs requires identifying and calculating the overall budget needs for the target country’s agricultural sector for the period covered by the IP (usually five years). The practical differentiation between project costing and IP costing is that the costing of the projects is done at the input/activity level while that of the IP is done at the output/component level. This means that the tangible products expected from the IP must be specified as accurately as possible at output / component level to allow for more accurate indicative cost estimates, which can then be developed into detailed activity level cost estimates at a later stage. Thus, for an investment within the IP, a detailed project could be developed at the level of the subprogramme, which would then be expanded into a number of components, subcomponents, activities and items. However, for the IP, costs are estimated at the component level.
How to prepare and present project cost information
Project costs are generally presented in an Excel spreadsheet format, but there is software specifically designed to help project analysts organize and analyse project costs – for example, the COSTAB software. In the box below the necessary steps in project costing are outlined as well as a brief comparison between exclusively Excel-based as well as Excel- plus COSTAB-based costing.
Practical Guidance on Project CostingOverview
Steps
Decision of using excel vs. specialized costing software e.g. COSTAB
For each item costed there is a need to specify:
|
1. Base costs and total costs:
Cost estimate collection is a crucial exercise that must be undertaken in close collaboration and consultation with all stakeholders. Technical experts, financiers (donor, smallholder or civil society) and government officers are key in providing accurate information to cost analysts.
The first steps in the process of making a detailed cost table are to define the unit of measurement, the quantities to be purchased and the unit costs, which will determine the project’s base costs. Units are the measures by which costs are calculated and can be described in terms of quantity or value (lump sum). Quantities are determined by amount per year (e.g. number of training activities to be undertaken within the year) as well as by number of years. So in a four-year project, two training sessions per year might be scheduled in the first year and two more in the third year as refresher training, making a total of four training sessions, held in years 1 and 3. This is referred to as project phasing, or the project timeline of activities.
Base costs include the costs of goods and services (whether domestically acquired or imported), as well as all duties and taxes. There are two methods to estimate base costs: border costing1 (generally used to calculate the costs of imported goods and services) and domestic costing.2
Base costs represent the best judgment of project costs estimated as of a specific date and time within a given year, but they do not reflect changes in quantities and prices that might be expected subsequently in the life of the project. For this reason, physical and price contingencies should be estimated separately and added to the base costs.
- Physical contingencies reflect expected increases in the base cost estimates of a project due to changes in quantities and/or methods of implementation. They are calculated and expressed as percentages of the base costs. The percentage will be set according to the degree of uncertainty that arises from the provision of works, good and/or services. Physical contingencies are usually applied to works, goods and/or services for which reasonably accurate estimates that might be affected by inflation cannot be made. This is often true in cases that involve construction or civil works, because at the costing stage detailed designs involving bills of quantities would not have been made for civil works and thus a physical contingency must be applied.
- Price contingencies reflect expected increases in project costs due to changes in unit prices for the various resources that the project will require beyond the date of the base cost estimates. They include the impact of expected inflation (both domestic and international) and changes in the exchange rate.
2. Structuring cost information:
Cost tables should be built by creating a matrix that shows the relationship between project-level implementation objectives (results / outputs) and resources, including time, required. Project costs are divided into two distinct categories: Investment costs represent the costs of goods and services that will generate benefits over the project life and beyond. A recurrent cost represents the costs of inputs that result in incremental benefits for that accounting period. Recurrent costs include the incremental staff costs and the operation and maintenance costs attributable to the project, and usually represent the level of costs that the borrower (usually the government) will need to maintain after the project is completed.
When preparing project costs with the COSTAB software it is useful to assign an expenditure account to each of the main costing categories such as civil works, vehicles, equipment, training and studies, credit/grants. for investment costs. For recurrent costs one could assign incremental operating as well as staffing costs. Expenditure accounts are organized into investment costs and recurrent costs.
Also when using COSTAB, it is recommended to insert the procurement arrangements for each expenditure account of the project. Financing institutions and countries generally have their own procurement guidelines for the purchase of goods, works, consulting and non-consulting services. Further information is provided in the Resources section of this Note. An overview of possible options is presented in the table below.
Component
expenditure matrix |
|||||
|---|---|---|---|---|---|
| Components | Component 1 | Component 2 | Component 3 | Component 4 | Component 5 |
| Expenditure accounts | |||||
| Investment costs | |||||
| Civil works | |||||
| Vehicles &
Equipment |
|||||
| Training & Studies | |||||
| Credit | |||||
| Recurrent costs | |||||
| Operation & Maintenance |
|||||
| Incremental Staff | |||||
| Other recurrent | |||||
The final step is to develop a matrix that sets out the procurement arrangements for all the elements of the project. It may be presented as an extra column next to each item in a detailed table, or in a summary table organized by expenditure account. Financing institutions and countries generally have their own procurement guidelines for the purchase of goods, works, consulting and non-consulting services. Further information is provided in the Resources section of this Note.
| Procurement accounts |
International
Competitive Bidding |
National
Competitive Bidding |
Local
Competitive Bidding |
Consulting
Services |
Other | Non-Bank Financed |
| A. Civil work | ||||||
| B. Vehicles, Equipments and Materials | ||||||
| C. Training,
Studies, Workshop and Planning |
||||||
| D. Technical
Assistance |
||||||
| E. Financial
Services |
||||||
| F. Recurrent
Costs |
||||||
| G. Beneficiary
Contribution |
Common errors in project costing
- Confusing costing vs. financing: sometimes analysts confuse the exercise of project costing with the issue of how the project will be financed. The purpose of project costing is to determine how much the project will cost—regardless of who finances the project. This confusion usually results in estimates of project costs that underestimate the funds that will actually be required to implement a project. For this reason, all elements – including taxes, incremental recurrent costs and beneficiaries’ contributions in cash – must be included in the cost tables.
- Excessive use of lump sums: lump sums may be used when the quantities required are not available or estimable with any level of accuracy, or when it is desirable to bulk together a large number of various small items. However, they provide little useful information and should be avoided to the extent possible.
- Misunderstanding of recurrent costs: recurrent costs are often interpreted as costs that are the same in every year of the project life, such as project staff and office costs in the project management units. However, recurrent costs are those that the borrower or implementer (in case of governments) will need to maintain after the project is completed, and they typically include annual staff costs as well as the costs of operating the assets created by the project —e.g. health professionals required in rural clinics built under the project, teachers to staff newly constructed schools – as well as incremental operating and maintenance costs – i.e. recurrent costs over and above the normal running costs of concerned parties or institutions.
Project costs are generally presented in an Excel spreadsheet format, but there is software specifically designed to help project analysts organize and analyse project costs – for example, the World Bank’s COSTAB programme.
COSTAB performs the following tasks:
- Calculates physical and price contingencies, taxes and foreign exchange;
- Produces detailed and summary project cost tables;
- Produces financing plans and disbursement profiles;
- Produces procurement tables;
- Produces a suggested loan allocation table;
- Shows project costs by implementing agency and project area;
- Converts financial costs to economic costs for economic analysis; andStores financial and economic data in Excel spreadsheets that can be linked to new spreadsheets for custom calculations.
Footnotes:
1 The border costing method first estimates the purchase cost in the country where the item is manufactured. It then adds in the costs of transporting and readying the item for use at the project site.
2 The domestic costing methods estimates costs directly and then indirectly estimates foreign costs and taxes.
Key Resources
This tutorial shows you how to use Costab, i.e., how you enter data into a computer and produce standard cost table for project reports. |