| Regular Programme | US$ `000 | |
| Appropriation | 862 | |
| Expenditure | 2 988 | |
| Over/(Under) Spending, US$ `000 | 2 126 | |
| Over/(Under) Spending, % | (247%) | |
| Field Programme | US$ `000 | |
| Extra-Budgetary TF and UNDP Delivery | 777 | |
| Extra-Budgetary Emergency Project Delivery | ||
| TCP and SPFS Delivery | ||
| Total Field Programme Delivery | 777 | |
| Ratio of Field to Regular Programme | 0.3 | |
| Technical Support Services, Prof. Staff Cost | 676 | |
| Technical Support Services, % of delivery | 87% |
Achievements
281. The Major Programme oversees all phases of the Organization's technical assistance programme/project cycle, including project implementation, and ensures feedback of field experience to the technical departments. The Field Operations Division (TCO) with the newly decentralized Operations Branches in the Regional Offices have the main responsibility for this Major Programme. The appropriation and expenditure in the above table relates only to the portion of field operations funded from the Regular Programme and the over expenditure indicated mainly resulted from the one-time costs associated with the decentralization of Field Programme operations to the Regional Offices.
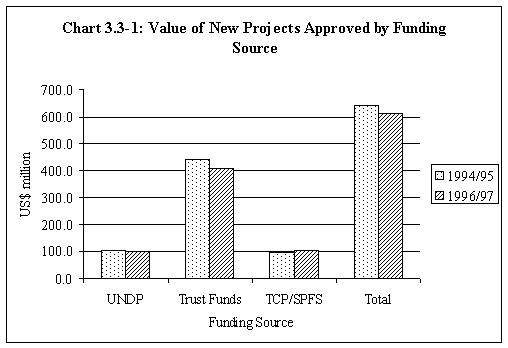
282. The value of new projects approved by funding source is shown in Chart 3.3-1 which indicates that the decline in the Field Programme may be abating. The overall decline between 1994-95 and 1996-97 was less than 5 percent and new approvals of UNDP projects were nearly stable at about US$ 100 million. Since delivery generally closely follow approvals, with some time lag, it appears that a turnaround in the level of field activities may be in the offing.
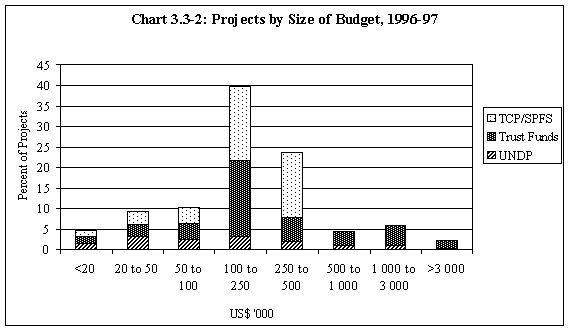
283. In terms of size, over 65 percent of the projects in 1996-97 had budgets of less than US$ 250 000, as indicated in Chart 3.3-2. The majority of these fell in the US$ 100 000 to US$ 250 000 range with fairly equal numbers of Trust Fund and TCP/SPFS projects in this range. Less than 10 percent of projects exceeded US$ 1 million, a dramatic change from the recent past when more than 25 percent of projects exceeded this amount.
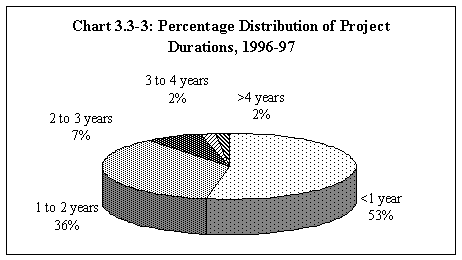
284. In terms of duration, over half of the ongoing projects had a scheduled duration of 1 year or less and 36 percent had a duration of 1 to 2 years, as shown in Chart 3.3-3. In contrast to the recent past when nearly 30 percent of projects had a duration of 4 years or more, in 1996-97 only 2 percent had a scheduled duration of this length and another 2 percent were scheduled to have a duration of 3 to 4 years. The trend towards shorter duration projects has important implications, since short-term and small projects make proportionally greater demands on both technical and administrative support than large-scale projects.
285. Total Field Programme delivery in recent biennia has continued to decline, as shown in Table 3.3-1. UNDP project delivery dropped from about US$ 250 million in 1992-93 to less than US$ 100 million in 1996-97 with two-thirds of this decline occurring in 1994-95. In addition, delivery in 1997 was nearly the same as delivery in 1996, indicating that the year to year decline may be at an end. Trust Fund project delivery also declined, although only by 1.5 percent over the last biennium. Unilateral Trust Funds (UTF) on the other hand showed consistent growth, increasing from US$ 39.3 million in 1992-93 to US$ 45.4 million in 1996-97. Emergency activities, mainly carried out by FAO's Special Relief Operations Service, vary with need and, as work of the Emergency Centre for Locust Operations (ECLO) and the Screwworm Emergency Centre for North Africa (SECNA) was reduced in 1996-97, the overall emergency delivery declined. However, emergency programmes remained an important component of the Trust Fund Programme with biennial resources close to US$ 50 million, about 10 percent of the total Field Programme.
| Source/Type of Activity | 1992-93 | 1994-95 | 1996-97 |
| FAO/UNDP | |||
| FAO Execution | 219.5 | 108.3 | 58.4 |
| FAO Implementation | 24.7 | 31.3 | 26.0 |
| Support for Policy and Programme Development (SPPD)/Support for Technical Services (STS) | 3.6 | 8.8 | 7.8 |
| Total UNDP | 247.8 | 148.4 | 92.2 |
| Trust Funds | |||
| FAO/Government Cooperative Programme | 175.5 | 164.3 | 176.2 |
| Associate Professional Officer Programme (APO) | 36.6 | 29.5 | 30.3 |
| Near East Cooperative Programme | 0.2 | 0.2 | |
| Unilateral Trust Funds (UTF) | 39.3 | 41.0 | 45.4 |
| Prevention of Food Losses (PFL) Special Account | 0.2 | ||
| International Fertilizer Supply Scheme | 0.1 | ||
| Freedom from Hunger Campaign | 2.4 | 1.4 | 1.0 |
| UNFPA | 8.2 | 7.3 | 5.2 |
| UN Environment Programme | 3.2 | 3.1 | 1.0 |
| Other UN Organizations | 15.7 | 13.5 | 8.5 |
| Special Relief Operations | 47.5 | 54.5 | 50.6 |
| Emergency Centre Locust Operations (ECLO) | 7.9 | 5.1 | 0.0 |
| Screwworm Emergency Centre for North Africa (SECNA) | 6.3 | 0.9 | |
| Miscellaneous Trust Funds | 21.7 | 5.0 | 2.1 |
| Total Trust Funds | 364.6 | 325.6 | 320.7 |
| Total External Funding | 612.4 | 474.0 | 412.9 |
| Regular Programme | |||
| TCP | 67.0 | 66.8 | 72.6 |
| SPFS | 3.0 | 8.5 | |
| Total Regular Programme | 67.0 | 69.8 | 81.1 |
| Total Field Programmes | 679.4 | 543.8 | 494.0 |
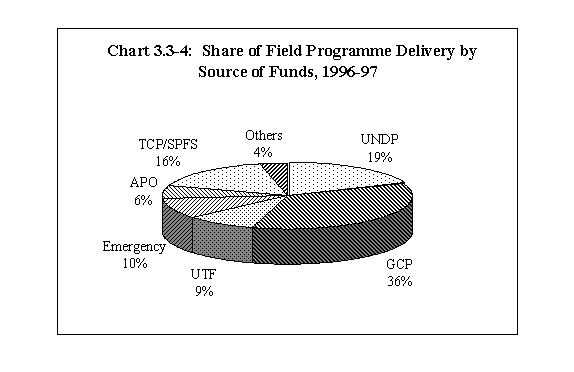
286. The FAO/Government Cooperative Programme was a dominant component of the Field Programme in 1996-97 with 36 percent, followed by UNDP with 19 percent and FAO's TCP and SPFS with 16 percent, as shown in Chart 3.3-4.
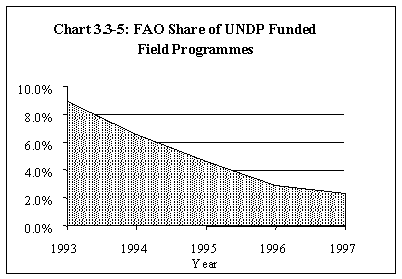
287. FAO's share in the execution and implementation of UNDP-funded programmes continued to decline from about 9 percent in 1993 to less than 3 percent in 1997, as shown in Chart 3.3-5. This drop reflected UNDP's resource constraints, increased reliance on national project execution and the use of alternative agencies in the implementation of projects, especially UNDP's Office for Project Services (OPS). On the positive side, the FAO/UNDP Programme appeared to be stabilizing at about US$ 90 million, the 1996-97 level. Also, expenditures related to UNDP facilities: SPPD and STS, which replaced the previous TSS-1 and TSS-2, appeared to be reaching a stable level of about US$ 8 million per biennium.
288. In terms of substance, field activities were largely concentrated under Programme 2.1.2 Crops at 25 percent of Field Programme delivery, Major Programme 2.4 Forestry at 16 percent and Programme 2.1.1 Natural Resources with about 11 percent. The majority of activities carried out under both TCP/SPFS and Emergency Programmes were concentrated under Major Programme 2.1 Agriculture Production and Support Systems, with 55 percent of TCP/SPFS delivery and over 96 percent of emergency activities relating to this Major Programme. The latter high proportion under "Crops" mainly resulted from FAO's handling of the agricultural component of the Oil for Food Project in Iraq and from agricultural rehabilitation assistance provided to Bosnia and Herzegovina.
| Programme | TF/UNDP | Emergency | TCP/SPFS | Total |
| 2.1.1: Natural Resources | 12.1 | 8.5 | 6.8 | 10.9 |
| 2.1.2: Crops | 16.8 | 88.1 | 26.5 | 25.7 |
| 2.1.3: Livestock | 7.3 | 2.2 | 12.3 | 7.6 |
| 2.1.4: Agricultural Support Systems | 6.2 | 0.1 | 6.9 | 5.7 |
| 2.1.5: Agricultural Applications of Isotopes and Biotechnology | 2.9 | 0.7 | 2.5 | 2.6 |
| 2.1: Agricultural Production and Support Systems | 45.3 | 99.6 | 55.0 | 52.5 |
| 2.2.1: Nutrition | 1.6 | 4.3 | 1.8 | |
| 2.2.2: Food and Agricultural Information | 4.5 | 0.1 | 5.3 | 4.2 |
| 2.2.3: Agriculture and Economic Development Analysis | 0.4 | 2.6 | 0.7 | |
| 2.2.4: Food and Agricultural Policy | 0.9 | 8.6 | 2.1 | |
| 2.2: Food and Agricultural Policy and Development | 7.4 | 0.1 | 20.8 | 8.8 |
| 2.3: Fisheries | 7.9 | 0.3 | 5.5 | 6.7 |
| 2.4: Forestry | 21.0 | 4.2 | 16.1 | |
| 2.5.1: Technology Development and Transfer | 4.5 | 2.9 | 3.8 | |
| 2.5.2: Women in Development and People's Participation | 2.4 | 1.4 | 2.0 | |
| 2.5.3: Rural Development and Agrarian Reform | 2.6 | 2.7 | 2.4 | |
| 2.5.4: Environmental Information Management | 1.8 | 0.3 | 1.4 | |
| 2.5.5: Coordination and Promotion of Sustainable Development | 0.7 | 0.2 | 0.5 | |
| 2.5.6: Food Production in Support of Food Security in LIFDCs | 1.1 | 2.7 | 1.2 | |
| 2.5: Contribution to Sustainable Development and Special Programme Thrusts | 13.1 | 10.2 | 11.3 | |
| 3.1: Policy Assistance | 3.4 | 3.8 | 3.1 | |
| Others | 1.9 | 0.5 | 1.5 | |
| Total | 100.0 | 100.0 | 100.0 | 100.0 |
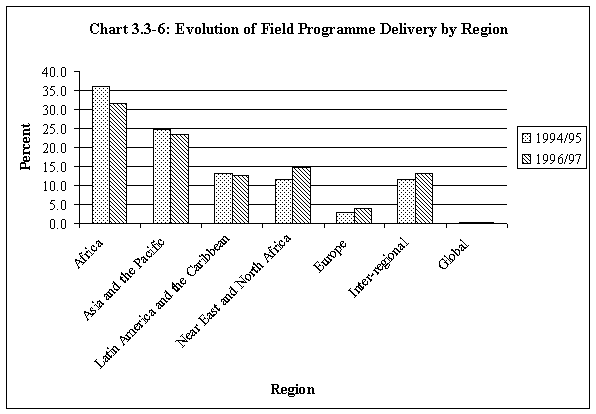
289. The regional distribution of field activities is shown in Chart 3.3-6. Africa's share of the total Field Programme declined from about 36 percent in 1994-95 to 31 percent in 1996-97, although this region continued to attract the highest concentration of activity. In part, this can be attributed to the decline in UNDP resources which has mostly affected Africa. In contrast, the share of Field Programme delivery in the Near East and North Africa increased mainly due to emergency assistance. Inter-regional projects also increased their share.
290. There has been a continued decline in the proportion of project delivery in the LDCs as indicated in Table 3.3-3. The reduction is due to the decline in the proportion of Trust Fund resources benefiting LDCs, which fell from 27 percent in 1992-93 to 19.4 percent in 1996-97. The proportion of both UNDP and TCP/SPFS resources benefiting LDCs showed a steady increase, with UNDP exceeding 60 percent in 1996-97 and TCP/SPFS exceeding 40 percent. However, in 1992-93 UNDP accounted for over 50 percent of field activities in the LDCs, while in 1996-97 this had dropped to about 35 percent, as shown in Table 3.3-4. During this same period, the proportion of project delivery in these countries coming from TCP/SPFS increased from less than 10 percent to over 20 percent.
| Funding Source | 1992-93 | 1994-95 | 1996-97 |
| UNDP | 57.8 | 59.6 | 62.8 |
| Trust Funds | 27.0 | 25.4 | 19.4 |
| TCP/SPFS | 35.6 | 38.0 | 41.4 |
| Total | 38.6 | 35.8 | 30.5 |
| Funding Source | 1992-93 | 1994-95 | 1996-97 |
| UNDP | 51.9 | 42.5 | 35.6 |
| Trust Funds | 38.7 | 43.4 | 42.1 |
| TCP/SPFS | 9.5 | 14.0 | 22.4 |
| Total | 100.0 | 100.0 | 100.0 |
291. The proportion of project expenditures for various types of services and products in 1997 is shown in Chart 3.3-7. Experts and consultants were the largest area of expenditure with 35 percent of the total, while equipment stood at 21 percent.
