


The current distribution of product values between production cost and economic rent is shown in Figure 1-5.
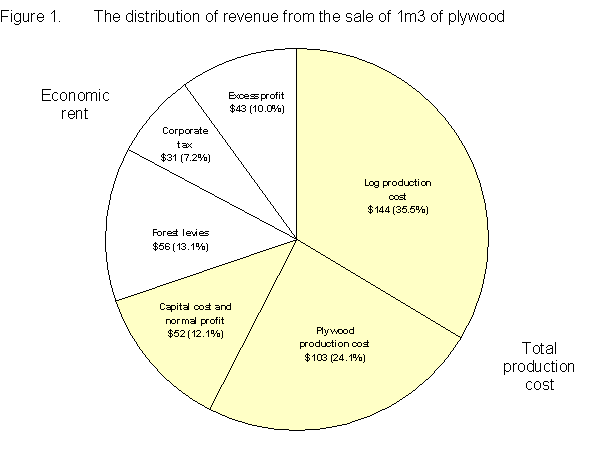
Given the assumptions in Appendix 1, the economic rent from plywood production is US$130/m3 plywood (see Figure 1). About two-thirds of this is taken by the government as levies and corporate tax, and US$43/m3 plywood of the economic rent goes to the plywood industry as excess profit. With a conversion factor of 2:1, this would imply that levies could be raised by about US$21/m3 log. However, this calculation has been made with an assumed log price of US$100/m3. It is possible that at this price there are also excess profits in HPHs supplying the industry which could be obtained by the government (ie. the log production cost includes excess profits in HPHs).
Figure 2 shows the situation for sawnwood/moulding production. Economic rent in this industry is about US$115/m3 sawnwood/moulding, of which about three-quarters is taken by the government, and US$31/m3 goes to the industry as excess profits. More logs are required to make 1m3 of sawnwood/moulding than 1m3 of plywood, so these results would suggest that levies could be raised by about US$10/m3 log. However, again it may also be possible that the HPHs supplying the industry are making excess profits at the log price used in the analysis.
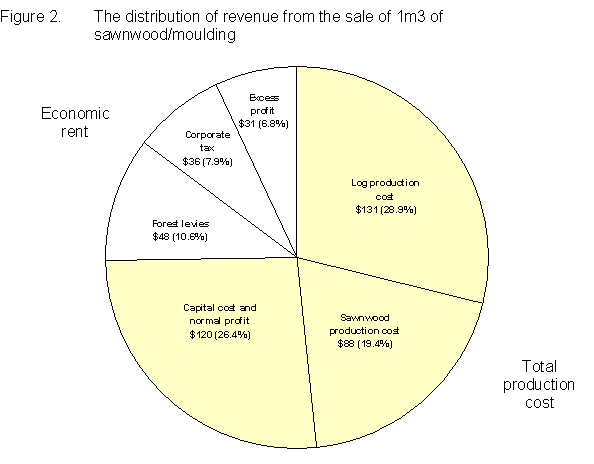
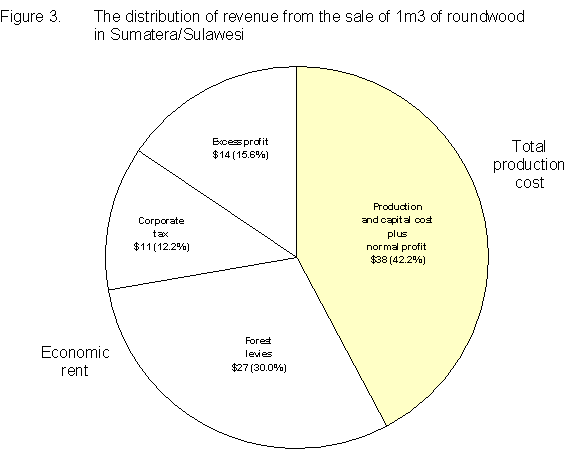
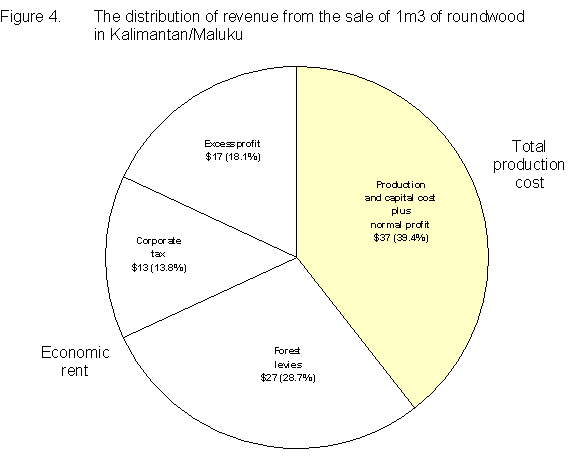
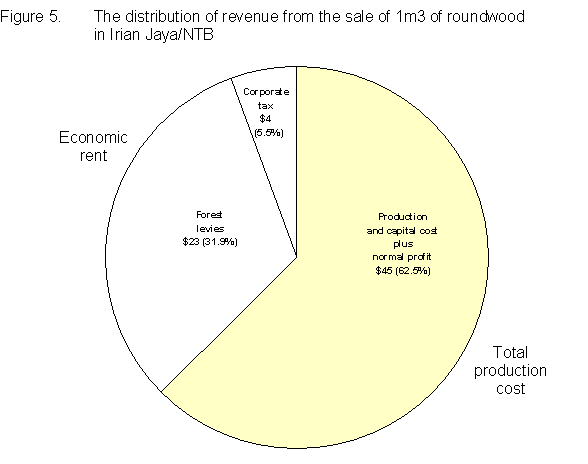
Figure 3-5 show the results of this analysis for HPHs in Sumatera/Sulawesi, Kalimantan/Maluku, and Irian Jaya/NTB. In Sumatera/Sulawesi, with an average log price of US$90/m3, production and capital costs are US$38/m3 leaving an economic rent of US$52/m3. About three-quarters of this is taken by the government, leaving US$14/m3 as excess profits for the industry. Average log prices are slightly higher in Kalimantan/Maluku (due to the higher proportion of meranti species found in the forests there), and production costs are slightly lower. Total economic rent in Kalimantan/Maluku is US$57/m3, and US$17/m3 of this goes to the industry as excess profits. Log prices are much lower in Irian Jaya/NTB, and production costs higher. Current levies capture all the economic rent from log production in Irian Jaya/NTB, at the log price used in this analysis.
A comparison of the distribution of economic rent between industries and provinces is given in Table 4. This shows that about half of the economic rent from log production for plywood, and about two-thirds of the economic rent from log production for sawnwood, goes to the government (slightly more than this in Irian Jaya).
Table 4 The distribution of economic rent between government and industry at current (1996) log prices and levels of forest levies
|
Industry/province |
Government |
Industry |
|||||
|
|
Levies |
Tax |
Total |
Excess profits |
Total |
||
|
|
IHH |
Other |
|
|
HPH |
Industry |
|
|
HPHs selling to plymills |
|
|
|
|
|
|
|
|
Sumatera/Sulawesi |
10 |
17 |
11 |
38 |
14 |
21 |
35 |
|
Kalimantan/Maluku |
10 |
17 |
13 |
40 |
17 |
21 |
38 |
|
Irian Jaya/NTB |
6 |
17 |
4 |
27 |
0 |
21 |
21 |
|
HPHs selling to sawmills |
|
|
|
|
|
|
|
|
Sumatera/Sulawesi |
10 |
17 |
11 |
38 |
14 |
10 |
24 |
|
Kalimantan/Maluku |
10 |
17 |
13 |
40 |
17 |
10 |
27 |
|
Irian Jaya/NTB |
6 |
17 |
4 |
27 |
0 |
10 |
10 |
All figures are in US$/m3 log at 1996 prices
As Table 4 above shows, current forest levies could be increased by US$10-20/m3 log in Irian Jaya/NTB, and US$25-35/m3 log elsewhere. However, these results are quite sensitive to the required rate of return on capital. A 5% increase in the real rate of return on capital (ie. from 15% to 20%) would reduce economic rent (and hence, the amount by which levies could be raised) by US$2/m3 log in the plywood industry, US$3/m3 log in the sawnwood industry, and US$2/m3 log in HPHs, or US$4-5/m3 log overall. Conversely, a 5% reduction in the required rate of return would increase economic rent by US$5/m3 log.
