![]()
![]()
![]()
David Campbell and Associates
PO Box 228 Kippax Act 2615 Australia
<[email protected]>
1. INTRODUCTION
1.1 Resource biology
The Australian southern bluefin tuna fishery is part of a larger international fishery targeting southern bluefin tuna (SBT, Thunnus maccoyii). A single highly migratory ‘straddling’ stock exists in the Indian and Southern Ocean and individuals may live up to 40 years in age and weigh over 200kg. The juvenile phase begins in the spawning grounds south of Java with most of the two - to eight-year-old fish forming large surface schools that migrate anti-clockwise over the southern Australian continental shelf. At eight years of age, mature fish leave these Australian continental waters for the Southern and Indian Oceans (Figure 1).
Figure 1. Distribution of bluefin tuna catch off the Australian coast
1.2 The global fishery
The highest reported annual global landings of SBT (more 81 200t) occurred in 1961. The Japanese fishery landing 7800t or approximately 95% of global landings and the Australian fishery landing 3700t, or approximately 5% of the total. In 1983, the year before individual, transferable catch quotas (ITCQ) were introduced into the Australian fishery, the reported global catch was 42 800t, or about half the record catch taken 22 years earlier. Of this, Australian landings were 17 700t (41%) and Japanese landings were 24 900t (58%). The reported landings by New Zealand and ‘others’ made up the remaining 1% of the reported total global landings. Since the 1989-90 fishing season, Australia’s national quota has been 5262t; Japan, 6065t; and New Zealand, 420t, or 11 747t in total. From 1989-90 to 1998, the total landings of these three fisheries remained at around 11 300t. As a result of increased catch by ‘others’ and 1464t taken by Japan outside of its quota, global landings in 1998 were 1924t (Figure 2).
Figure 2. SBT global landings: 1966 to 1998
Note: ‘Others’ is primarily the catch of: the Republic of Korea, Indonesia and Taiwan (Province of China). There are a number of other fishing nations that catch and retain SBT: for instance, figures from the Japanese Department of Finance show Japanese imports of SBT from 19 national sources for the year 1997, and from 15 national sources in 1998.Prior to the introduction of ITCQ, the Australian fishery relied on pole-and-line and purse-seine methods to catch immature surface-swimming fish within the Australian fishing zone. Much of this catch went into the low - valued Australian canning market, although an increasing proportion was exported to the higher-valued Italian and Japanese markets[89]. The Japanese fishery used long-lines to target deep-swimming mature fish for the Japanese sashimi market, while a large part of the relatively small New Zealand hand-line fishery went to the high-value Japanese sashimi market (Wesney, Scott and Franklin 1985).
1.3 A collapsing stock
Global stocks of SBT began to fall in the 1960s as a result of over-fishing, and continued to do so through the 1970s and the 1980s. In Australia, increasing fishing-effort, cooperative fishing between purse-seine and pole-vessels, increased use of aerial searching and expanded Western Australian fishing effort, culminated in a record Australian SBT catch of 2100t in 1982-83 (Majkowski and Caton 1984). This increase in Australian catch and increasing Japanese fishing-effort led to continuing falls in estimated levels of the parent-stock (Hampton and Majkowski 1986).
In the early 1980s, concern about a declining parent-stock triggered a series of trilateral consultations involving Australia, Japan and New Zealand. It was recognised that while parent-stocks were then depressed to about one-third of their pre-fishing levels, throughout 1975-80, the stock-levels had been reasonably stable. The participants agreed that stocks had been further reduced more recently as a result of high exploitation-rates. In response, they agreed on the need to implement fishing constraints to protect stock-biomass, and set as a conservation objective the return by 2020 of the biomasses of the parent-stocks to their 1975-1980 levels.
Photo: Albert Caton, Bureau of Rural Sciences, AustraliaThis led to Australia and New Zealand implementing separate national quotas in 1984 and Japan implementing a national quota in 1985 (Wesney, Scott and Franklin 1985). These consultative agreements on a global quota were carried through to 1997[90]. The Australian share of the global quota was allocated among those with a recent history in the SBT fishery under an ITCQ fishery management programme.
This paper examines the effect that the introduction of ITCQ has had on the Australian SBT fishery in relation to changes in the distribution of quota and the capacity of the fishing fleet. To understand the changes that have occurred in the Australian fishery, it is important to include the Japanese fishery as well as others targeting the SBT stock. Both the Australian and Japanese fisheries take a large proportion of the global catch and changes in catch by one affect the operations of the other. In addition, the operation of Australia-Japan joint ventures within the Australian fishing zone, and the harvesting of Australian SBT quota by Japanese-operated vessels have affected the Australian fleet-capacity and the distribution of ownership and fleet operations. In addition, Japanese involvment in the development of SBT grow-out farms in South Australia has affected expected adjustments to the fishery following the introduction of ITCQ. Also, the arrangements between the Australian and Japanese fishing fleets appear to have been facilitated by the introduction of ITCQ into the Australian SBT fishery (Campbell, Battaglene and Brown 1996).
2. THE NATURE OF THE HARVESTING RIGHT
Prior to 1976 the SBT fishery was an open-access fishery. Concerns over the long-term economic viability of the fishery in the mid-1970s (Wesney, Scott and Franklin 1985) led in 1976 to a freeze on entry to New South Wales and South Australia fisheries, while the Western Australia fishery remained open. The upgrading of boats, increased effort per boat and an expansion of fishing effort in Western Australia led to an overall increase in fishing effort and decreasing operator-returns. As a result, the freeze was terminated in April 1981 and the fishery returned to an open-access fishery.
Prior to the introduction of ITCQ in 1984, three fishing methods were used in the Australian southern bluefin fishery. The most widely used method was pole-and-line, which was carried out on boats of 10 to 30m in length. Larger boats were used to purse-seine, while a small amount of catch was taken using small (mostly inshore) boats trolling for surface-swimming fish. Some characteristics of the state-based fleets as they were in 1981-82 are presented in Table 1.
Table 1. Characteristics of the Australian southern bluefin tuna fleet 1981-82
|
|
New South Wales - South Australia |
Western Australia |
Australian fleet (total) |
|
Number: Pole boats |
49 |
68 |
117 |
|
Number: Purse-seiners |
5 |
- |
5 |
|
Length (m): Pole boats |
21.8 (4) |
11.5 (3) |
16.4 (2) |
|
Length (m): Purse-seiners |
31.0 |
- |
31.0 |
|
Age: Pole boats |
8 (18) |
16 (12)- |
12 (9) |
|
Age: Purse-seiners |
11 |
- |
|
|
Refrigerated |
49 |
16 |
65 |
Note: Figures in parentheses are relative standard errors.In October 1983 a twelve-month interim management-programme involving a national total allowable catch (TAC) of 1900t, was put in place. Under the interim management-programme, the western sector (Western Australia) received an allocation of 400t (a reduction of 200t on the previous year’s landings) and the eastern sector (New South Wales and South Australia) was allocated 1500t (100t below the sector’s previous record landings). To ensure access to the resource by pole-and-line vessels, a 500t catch-limit was placed on purse-seiner catch with the additional requirement of no transhipment of catch to carrier boats. A minimum size for landed tuna was imposed to reduce the number of small fish caught[91]. Aside from these limitations, there were no constraints on boats’ operations.
Source: Bureau of Agricultural Economics (1986).
Following a review and recommendations by the Industries Assistance Commission (1984), a long-term management programme based on ITCQ, was introduced into the fishery in October 1984. The essential element of the programme was the allocation on a boat-by-boat basis of a fixed proportional entitlement of a national total allowable catch, where the national total allowable catch could be varied. Other than a restriction on the taking of SBT off the Western Australia west coast[92], entitlements could be freely sold, or leased in whole or in part, between existing or new operators and between different regions of the Australian fishery, irrespective of fishing method used.
The joint industry-government SBT Management Advisory Committee used two criteria as a basis to allocate quota. These were: the best annual catch over the three seasons 1980-81 to 1982-83, and the assessed market value of the SBT boat and fishing gear in August to September 1984. In allocating quota-units, a weighting of three-quarters was given to the best catch, and a weighting of one-quarter was given to the assessed market value. The quota-units provided the quota-holder a proportion of the national annual quota thus allowing a smooth transition in the allocation of individual allowable catch with any change in national quota. The total allowable catch for the first year of operation was set at 14 500t, with 14 050t allocated; the difference being held back pending appeals. This was a substantial reduction on the average of 18 900t taken over the period 1981-82 to 1983-84 (ABARE 1989).
Initially, 136 boats were allocated quota-units equivalent to more than 5t of quota. Seventy, or slightly over half of these boats operated in the Western Australia fishery, which received 27 500t (20%) of the allocated quota. South Australia’s 40 boats, which made up 29% of the fleet, accounted for 9300t (64%) of the initial quota allocation and the largest allocation of quota on a per boat basis. The 26 boats from New South Wales made up 19% of the national fleet, while their quota allocation made up 14% of the total allocation (Table 2).
Table 2. ‘Leavers’ and ‘stayers’ in the fishery 1983-84 to 1985-86a
|
|
New South Wales |
South Australia |
Western Australia |
Total |
||||
|
No. |
Average quota (tonnes) |
No. |
Average quota (tonnes) |
No. |
Average quota (tonnes) |
No. |
Average quota (tonnes) |
|
|
Leavers |
||||||||
|
- fished 1983-84 |
7 |
107.0 |
7 |
101.7 |
41 |
39.0 |
55 |
55.7 |
|
- did not fish 1983-84 |
16 |
55.3 |
3 |
145.0 |
8 |
17.7 |
27 |
54.1 |
|
- total |
23 |
71.3 |
10 |
116.1 |
49 |
35.5 |
82 |
55.2 |
|
Stayers |
3 |
128.1 |
30 |
270.4 |
21 |
48.2 |
54 |
176.3 |
|
Stayers & leavers |
26 |
77.7 |
40 |
231.8 |
70 |
39.3 |
136 |
103.2 |
a Boats allocated 5t or less of quota in 1984 are not included. The Department of Primary Industry, of which the Australian Fisheries Service was part, retained 455t to accommodate the need for additional quota allocation. Leavers are defined as those boats for which quota was reduced to 5t or less as at 30 June 1986.3. MEASUREMENT OF FLEET-CAPACITYb Because only three owner-operators left the South Australian fishery, no personal data were collected for that state, for reasons of confidentiality.
Source: Australian Fisheries Service.
3.1 Characterising fleet-capacity and their operational environment
By the early 1980s, the biological and economic status of the fishery was undergoing increasing pressure. The Bureau of Agricultural Economics[93] (1983, 1986) published survey data showing the average per boat return to capital and management had fallen from $A49 000 in 1980-81 to $A8285 in 1981-82 and an average per boat debt level of $A57 733 in 1981-82. In the same paper, the Bureau of Agricultural Economics (1983) presented CSIRO findings that the estimated global sustainable catch of 3300t had been exceeded by approximately 700t in 1982.
In setting a global quota, the objective was to return the parent biomass of SBT to the 1980 level by 2020. The recommendation by the Bureau of Agricultural Economics (1983) and the Industries Assistance Commission (1984)[94], for the use of ITCQ to manage the fishery within the national quota, was to achieve an economic objective.
At the time of the introduction of the ITCQ-based management plan into the Australian SBT fishery, it consisted of three fleets located in southern New South Wales, Port Lincoln in South Australia, and the Western Australian south coast. Not accounted for in this was a small amount of bycatch taken off Tasmania by local fishers with some Tasmanian boats receiving quota of less than 5t. The fleets differed in the nature of their operations and in their access to SBT stocks. Differences also existed in the relative opportunities to participate in other fisheries, in the non-fishing skills of owner-operators, and in opportunities to participate in non-fishing employment. These differences could be expected to have resulted in relative regional differences in the opportunity-cost for owner-operators to remain in or leave the SBT fishery.
In most part, the New South Wales fleet consisted of multi-purpose vessels that combined poling of 3-8 year old tuna from October to January with trawling in the southeast trawl fishery during the SBT off-season. By 1983-84, as a result of increases in catches in South Australia and Western Australia, and a decrease in SBT breeding stocks, the New South Wales catch had fallen to less than 1000t. While alternative employment skills and opportunities were limited, fleet operations were readily redirected on a full-time basis to the southeast trawl fishery, which had a developing catch of orange roughy (Hoplostethus atlanticus).
The South Australia fleet targeting 3 - to 5-year-old fish in January through May, consisted of larger specialist vessels including five purse-seine vessels. In 1968-69 landings were just over 3000t, but had increased 10 600t, or almost 2/3 of the national landings in 1983-84, the season prior the introduction of ITCQ-based management. Unlike New South Wales, there were few, if any, alternative fisheries to which the boats or operators could move, while alternative employment skills and opportunities were limited.
The newly-developed Western Australian fishery was dominated by small multi-purpose boats that used pole-and-line to target 2-to 3-year-old fish during November through May. When not poling for SBT, these vessels were used in a multi-species wet fish fishery. Just over 4000t of SBT was landed in 1983-84. Alternative employment opportunities were no better than those for southern New South Wales or for Port Lincoln. However, many of those who had entered the recently established Western Australia SBT fishery had working skills aside from fishing, and as a result, had more employment options available to them.
Larger SBT, whether for canning or the sashimi market, normally fetch a higher price per kilogram. As a result, SBT in New South Wales could be expected to be more valuable than the same volume of catch taken in South Australia or Western Australia. However, because of the regional differences discussed above, it could be expected that at the time of the introduction of ITCQ there would be region-by-region differences in the opportunity-cost of remaining in the SBT fishery consistent with such that: those in New South Wales > Western Australia > South Australia. These differences in opportunity-cost appear to have been important in the consequent restructuring of the fishery and the concentration of quota-ownership and fishing-effort in South Australia (Campbell, Brown and Battaglene 2000).
3.2 Changes in fleet-capacity: initial adjustment 1983-84 to 1985-86
3.2.1 Fleet-reduction
By introducing ITCQ, it was expected that, because of higher unit-value, profit maximising quota-holders would maximise the value of their rights by targeting larger fish, which receive a higher price on the Sashimi market. As a result, it was expected that the fishery would move towards the use of long-lines and the operational focus would move eastwards as stocks return to the New South Wales coast.
A rapid and substantial restructuring of the tuna industry fleet followed the allocation of quota in 1984: over half of the boats that were allocated quota left[95] the fishery in the first twelve months of the scheme, with quota from two-thirds of the boats being sold by the end of the 1985-86 financial year. This two-thirds-reduction in the number of boats accounted for one-third of the quota, as the boats taken out of the fishery had, on average, less quota and were likely to be older and smaller than those vessels retained in the fishing fleet (compare Tables 1 and 3).
More than half of the boats taken out of the fishery were from the Western Australia fleet, while the largest proportion of within-state adjustment was in New South Wales, where nearly all of the vessels allocated quota had left the fishery by the end of June 1986 (Table 2).
Table 3. Characteristics of ‘leaver’ boats from the southern bluefin tuna fishery
|
Details |
New South Wales |
South Australia |
Western Australia |
Australia |
|
Number of boats a |
23 |
10 |
49 |
82 |
|
Average quota sold b (t) |
71.8 (8.9) |
107.1 (16.91) |
36.9 (6.35) |
55.5 (5.76) |
|
Average value of quota sold b ($) |
114 200 (8.90) |
143 800 (18.13) |
63 200 (7.97) |
87 600 (6.11) |
|
Average price received b ($/t) |
1 590 (4.48) |
1 342 (10.54) |
1 712 (3.50) |
1 579 (2.74) |
|
Average assessed boat value b ($) |
373 926 |
494 160 |
75 615 |
211 993 |
|
Average age, October 1984 a |
11 |
12 |
13 |
12 |
|
Average length b (m) |
21 (1.38) |
19.3 (1.88) |
12.8 (5.22) |
15.92 (1.89) |
Note: Numbers in parentheses are relative standard errors expressed as percentages of the estimates.3.2.2 The nature of boats leaving the fisherySource:
a Australian Fisheries Service.
b Campbell and Wilkes 1988.
The main characteristics of the SBT ‘leaver’ boats are summarized in Table 3. All boats were pole-boats and, on average, were built in 1972 with a hull length of about 16m. Vessels taken out of the New South Wales fishery were constructed more recently and were larger than the Western Australia boats. As most were non-specialist vessels, only minor modifications were required to make them serviceable in other fisheries.
Many of the boats that had not operated in the SBT fishery in 1983-84 had already left the fishery and were unlikely to have returned to the fishery in the near future. Therefore, the following discussion is confined to those 55 boats which had operated in the fishery 1983-84, had received an initial allocation of quota, and for which quota was sold (or at least reduced to below the threshold 5t by the end of June 1986).
Overall, there was little difference between the boats exiting the fishery, in terms of the average amount of quota, according to whether they had or had not operated in the SBT fishery in 1983-84 (Table 2). On a state basis, however, there were substantial differences: in South Australia, the small number of ‘leaver’ boats that had not fished for SBT in 1983-84 had on average been allocated almost half as much again as those that had operated in the fishery in 1983-84. The New South Wales and Western Australia boats exiting the fishery, which had not been used to fish for SBT in 1983-84, had received only half as much quota as those that had fished.
Although boats taken out of the fishery constituted two-thirds of the boats to which quota had been allocated, these boats were only allocated 4500t, or one-third of the total available quota. On average, boats for which quota were sold and taken out of the fishery, were allocated 55t of quota compared with the average of 176t allocated to boats which remained in the fishery. On average, the former Western Australia boats received 36t, which was substantially less quota than the quota allocated for the New South Wales and South Australia boats leaving the fishery, which were respectively 71t and 116t.
3.2.3 Impact on adjoining fisheries
The effect of restructuring on other fisheries in the area differed between states. According to the estimates based on survey results (Campbell and Wilkes 1988), by July 1986 almost half the departing boats operating in the SBT fishery in 1983-84 had been sold (Table 4). Other than two boats from South Australia, all of the boats that had been sold were from Western Australia. The latter were sold for use in other local fisheries such as wet fish, shark, for use outside of fishing, or into fisheries outside of southern Western Australia. Owners of some of the Western Australian boats whichhad been sold replaced them with other boats for use in another local fishery aside from SBT. That is, of the 41 boats in Western Australia which had operated in the SBT fishery in 1983-84, 12 boats, or nearly 1/3, were removed from local fisheries.
All of the boats sold into another fishery either moved into one in which constraints on entry existed (therefore to replace existing boats) or into a fishery that was considered to be under-developed. This, in addition to the decrease in the number of fishing boats, implied that there is likely to have been an overall decrease in fishing effort rather than an increase of fishing effort.
In New South Wales and South Australia most departing boats that had operated in the SBT fishery in 1983-84 moved to a local fishery (Table 4). In many cases these boats had already operated in these same local fisheries on a part-time basis prior to leaving the SBT fishery. This most likely resulted in increased fishing effort in New South Wales and South Australia, although the lack of availability of SBT off New South Wales would have resulted in the movement of New South Wales vessels to full-time operations in the south-east trawl fishery, irrespective of the change in management.
Table 4. Use of ‘leaver’ boats which had fished in 1983-84 a
|
State |
Sold to other local fishery |
Sold to non local fishery or non-fishing
use |
Total sold |
Replaced and used in local fishery |
‘Leaver’ boat or replacement in local
fishery |
Left SBT fishery |
|
New South Wales |
0 |
0 |
0 |
0 |
7 |
7 |
|
South Australia |
1 (81) |
1 (81) |
2 (57) |
0 |
4 (23) |
7 |
|
Western Australia |
9 (16) |
13 (12) |
22 (10) |
10 (8) |
29 (6) |
41 |
|
Total |
10 (16) |
14 (13) |
24 (10) |
10 (8) |
40 (5) |
55 |
a As at the end of June 1986.3.2.4 Economic impact
Numbers in parenthesis are relative standard error. Source: Campbell and Wilkes (1986)
3.2.4.1 Change in fleet capitalisation
Based on the 1984 assessed market value, the value of the boats exiting from the SBT fishery was approximately $A17.4 million. However not all of this amount is attributable to the 1984 management changes as ont-third of the boats for which quota was sold did not operate in the fishery in 1983-84. Most of these boats, especially the 60% of the boats from New South Wales, would probably not have returned to the fishery, as a result of the decline in SBT availability on the east coast. Excluding these 27 boats, the value of the 55 boats exiting the fishery that had operated in the fishery in 1983-84 was $A9.15 million.
There were two other difficulties in estimating how much of the capital-value of the exiting boat’s value should be apportioned to the SBT fishery. Other than in South Australia, the boats used to catch tuna were regularly used to catch other fish species. Therefore, the costs of the vessels were jointly shared between the different fishing operations. To measure the change in capitalisation following the exit of vessels it would be necessary to apportion the total boat-costs between the SBT and the other fisheries in which the boats were operated. However, while the quota for ten of the South Australia ‘leaver’ boats was sold, the capital-value of an additional six boats taken out of the South Australian fleet as a result of owners amalgamating their quota, was not included in the survey.
Of the 55 exiting boats used to fish for SBT in 1983-84, 48 did so on a part-time basis in conjunction with other fishing activities. The remaining seven boats exiting the fishery that had operated full-time in the fishery were from South Australia.
3.2.4.2 Economic impact on leavers
Only two boats were sold in South Australia and none in New South Wales, and for reasons of confidentiality, it is not possible to properly assess any change in market value of exiting boats in South Australia. In Western Australia, the average value of exiting boats apparently dropped by $A32 000 or 40% (Table 5). While a number of elements may have been important in explaining this fall, the sudden increase in the number of boats on the market, and the decline in demand for vessels arising from the cutback in the Western Australian SBT fishery, would have been important.
In Western Australia most exiting vessels had fished for SBT in the year prior to the introduction of the quota-based management-plan. By comparison, most of the New South Wales boats had stopped fishing prior to the 1983-84 season, as a result of the reduced availability of SBT off the east coast.
Table 5. Change in average asset-value of Western Australia exiting boats - 1984-85 to 1985-86
|
Assessed value of boat $A |
Sale value of boat $A |
Sale value of quota $A |
Sale value of boat plus quota $A |
Increase in asset value $A |
|
82 223 |
50 049 |
65 022 |
115 071 |
32 848 |
Source: Campbell, Brown and Battaglene (2000). Note: values in brackets are standard errors.There appears to have been some variation in the price received for quota between the various state fisheries. In Western Australia, the estimated average price received was approximately $A1770/t, while in New South Wales and South Australia the respective average prices were around $A1600 and $A1300/t. For the fleet as a whole, the estimated average payment received per departing boat was approximately $A87 600. Anecdotal evidence indicates that the price received for quota early in the first weeks of the new management plan was much lower than the average price[96]. The fall in boat-value was more than offset by the sale of the associated SBT quota. Thus, the estimated average change in asset-value per boat was an increase of $A33 000, or 40%. Because most of the boats were sold within twelve months of their assessed valuation, no allowance is made for depreciation; otherwise the estimated improvement in asset-value would have been greater.
The impact on the income of those owner-operators, who had left the SBT fishery after the introduction of individual transferable quota, but had not retired, was estimated by comparing the 1983-84 combined taxable income of the leavers and their spouses with their 1985-86 income (Table 6).
The average taxable family-income for the New South Wales and Western Australia owner-operators was estimated to have increased in real terms, on a per boat basis, by 13%. The average family-income per boat in New South Wales was estimated to have increased by 23%, and that in Western Australia by 8%. In this latter state, not only is the average increase in taxable-income less, but the standard error is also greater. These two statistics indicate that, when compared with New South Wales, a higher proportion of Western Australian owner-operators were likely to have been worse off following the introduction of ITCQ.
3.3 Further reductions in global and national quota
Research by Hampton and Majkowski (1986) indicated that in spite of the restrictions on allowable catch in 1984-85 and 1985-86 the parent-stocks continued to fall. Further national quota-reductions were introduced in the 1986-87 season for both Australia and Japan. The Japanese quota was reduced from 23 150t to 19 500t (Table 7). While the nominal Australian quota was retained at 14 500t, the Japanese industry provided funds to enable the Tuna Boat Owners Association of Australia to lease and withhold from capture 3000t of Australian quota. This placed an effective catch limit of 11 500t on Australian operators for the three-year period to 30 September 1989.
Table 6. Change in family income of owner-operators who left the fishery a
|
State |
Income per boat |
||
|
1983-84 |
1985-86 |
Difference b |
|
|
New South Wales |
51318(48) |
62897 (41) |
11579 (34) |
|
Western Australia |
13870 (20) |
14937 (14) |
1067 (171) |
|
Total |
19331 (22) |
21931 (19) |
2600 (64) |
a Survey estimates for exiting boats that operated in the SBT fishery in 1983-84; 1983-84 values inflated, using the consumer price index, to 1986 equivalent values.Despite the further reduction of 6 650t in the global quota, concern that the parent stocks would continue to fall below an acceptable level remained (Caton and Majkowski 1987). This led to a further reduction of 17 500t reduction to 15 500t in October 1988. The Australian quota was reduced to 6 250t and the termination of the leasing agreement with Japan (although funds were retained) the Japanese quota was reduced to 8 800t and the New Zealand quota to 450t. In the following year the global quota was reduced by another one-third to 11 750t with national quota of: Australia 5 265t, Japan 6 065t and New Zealand 420t. Australia, Japan and New Zealand, through the Commission for the Conservation of SBT (CCSBT), retained these quota-levels up until 1996, when the members of the Commission were unable to reach agreement on an acceptable global quota[97].b For New South Wales, there is a less than 5% probability that the change in income is less than zero. For Western Australia there is a less than 30% probability that the change in income is less than zero. For both states together there is a less than 10% probability that the change in income is less than zero.
Note: Numbers in parentheses are relative standard errors, expressed as a percentage of the estimates.
Source: Campbell, Brown and Battaglene (2000). Note: values in brackets are standard errors.
Table 7. Catch limits and landings
|
Season |
Australia |
Australia |
New Zealand |
|||
|
Catch limit |
Catcha |
Catch limit |
Catcha |
Catch limit |
Catcha |
|
|
1983-84 |
21 000 |
15 483 |
no limit |
23 328 |
10 000 fish b |
132 |
|
1984-85 |
14 500 |
13 486 |
no limit |
20 396 |
10 000 fish b |
93 |
|
1985-86 |
14 500 |
13 237 |
23 150 |
15 182 |
1 000 |
94 |
|
1986-87 |
11 500 d |
11 308 |
19 500 |
13 964 |
1 000 |
60 |
|
1987-88 |
11 500 d |
10 976 |
19 500 |
11 422 |
1 000 |
94 |
|
1988-89 |
6 250 |
5 984 |
8 800 |
9 222 |
450 |
437 |
|
1989-90 |
5 265 |
4 849 |
6 065 |
7 056 |
420 |
529 |
|
1990-91 |
5 265 |
4 316 |
6 065 |
6 474 |
420 |
165 |
|
1991-92 |
5.265 |
4 894 |
6.065 |
6 137 |
420 |
60 |
|
1992-93 |
5 265 |
5 212 |
6 065 |
6 320 |
420 |
216 |
|
1993-94 |
5 265 |
4 937 |
6 065 |
6 064 |
420 |
277 |
|
1994-95 |
5 265 |
5.080 |
6 065 |
5 866 |
420 |
435 |
|
1995-96 |
5 265 |
5 188 |
6 065 |
|
420 |
140 |
|
1996-97 |
5 265 |
4 978 |
6 065 |
5 588 |
420 |
333 |
|
1997-98 |
5 265 |
5 087 |
6 065 |
6 038 |
420 |
331 |
|
1998-99 |
5 265 |
5 232 |
6 065 |
na |
420 |
457 |
a Australian catches include Australia-Japan joint venture and real-time monitoring programme longline catches.3.4 Longer-term adjustmentsb Number of fish.
c The Japanese and New Zealand seasons do not correspond with the Australian season. For purpose of this table calendar year data for the first year of the calendar year is given; e.g. Japanese catch for 1993-94 of 6 320 is the calendar year catch for 1993.
d The nominal national quota remained at 14 500t, however, the leasing of 3000t meant the amount available was 11 500t. na: Not available.
Sources: Bureau of Resource Sciences; Australian Fisheries Management Authority.
3.4.1 Economic impact on vessels remaining in the Fishery
Geen and Nayar (1989) examined the likely economic performance of the fishery in order to estimate the effect that the management changes may have had on it. They assumed that the fishery management-system in force in 1983-84 was maintained, i.e. with the total Australian quota of 14 500t managed under a competitive total allowable catch (TAC) management-system, rather than under an individual transferable quota (ITQ) management-system. They concluded that by 1986-87, fishing in New South Wales would have ceased, operations off South Australia would have fallen substantially, and that SBT operations would have been concentrated on the smaller age-classes off Western Australia. This would have resulted in an annual economic profit to the Western Australia fleet of $A1.6 million, which Geen and Nayar believed would be unsustainable because of decreasing stock numbers.
By contrast, it was estimated that by operating under ITCQ, the SBT operators would have earned an annual sustainable economic profit of $A6.5 million. In addition to the increased profitability, between 1983 and 1986 the average size of fish taken had increased by 11%, thus promoting conservation objectives through a reduction in the number of fish per tonne of catch (Geen and Nayar 1989).
This increase in the size of landed SBT is likely the result of the incentive provided by the higher price per kilogram received for larger fish in the canning and Japanese sashimi markets. This incentive to take larger fish, the shortage of SBT off New South Wales, and the limited alternatives for operators in South Australia appear to have been important factors in the concentration of quota in South Australia (Table 8).
Further apparent increases in resource-rent returns have occurred in the Australian SBT fishery through increasing long-line catches, careful handling of the pole-and-line and purse-seine catches, returns from an Australian/Japanese industry joint-venture and an increasing proportion of Australian catch being directed to the ranching operation off Port Lincoln. These operational changes have been accompanied by marketing changes with nearly all of the Australian production being directed to the Japanese sashimi market.
In 1982-83, the landings of 21 300t of SBT were estimated to be worth $A14.3 million (Table 10). In 1983-84 the catch fell to 15 800t, worth $A12.6 million, yet, by 1994-95, the 5200t of landed quota was valued at $A86.3 million. Much of this increase in the value of landings was the result of Australia-Japan industry-to-industry cooperation, including the joint venture operation in which a proportion of the Australian quota is leased to the Japanese joint-venture partners to take tuna within the Australian fishing zone. The importance of the joint-venture operations to provide returns to Australian SBT quota-holders was highlighted when joint-venture catch fell from 1684t in 1994-95 to 431t in 1995-96. As a result, from 1994-95 to 1995-96, the value of the SBT fishery fell by nearly 50% (Table 9). This was caused by the failure of Australia, Japan and New Zealand, as members of the CCSBT, to arrive at an agreement on a global quota. As a result, since 1996, Japanese fishers have been excluded from fishing in Australian waters.
Table 8. Changes in the distribution of individual transferable quota
|
Jurisdiction |
Season |
|||||||
|
1984 |
1986 |
1994 |
1998 |
|||||
|
t |
% |
t |
% |
t |
% |
t |
% |
|
|
New South Wales |
2 022 |
14 |
520 |
3 |
185 |
4 |
123 |
2 |
|
South Australia |
9 271 |
64 |
12 563 |
88 |
4 596 |
88 |
4 762 |
92 |
|
Western Australia |
2 752 |
19 |
1 249 |
9 |
424 |
8 |
267 |
5 |
|
Queensland |
- |
- |
- |
- |
|
|
48 |
1 |
|
Commwealth Govt. |
454 |
3 |
- |
- |
- |
- |
- |
- |
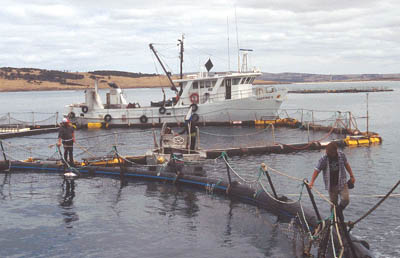
Note: this is for boats having quota in excess of 5t.The longer-term effect appears to be the increasing proportion of the Australian quota which is being used to capture fish for the production of farmed-tuna. While such operations are feasible without ITCQ, the existence of ITCQ appears to have facilitated this operation. Boats that would otherwise have been engaged in the ‘race-for-catch’ are now directed to catching 4 - to 5-year-old SBT by purse-seine in the Great Australian Bight as well as the time-consuming operation of towing them to grow-out cages in the waters off Port Lincoln. This operation normally occurs in the last quarter of the calendar year, with farmed-fish being sold into the Japanese sashimi market six months or more after capture. Most is sold by October of the following year. During this time individual fish can increase in body weight by one-third, and there is improved flesh-quality.Source: AFS and AFMA.
The total gross value of production from the farm-sector was estimated at $A38 million in 1994-95 (Table 10) with a gross value of SBT for the year of $A124 million. In April 1996 the production of farmed tuna suffered as a result of a storm that killed up to 75% of the caged fish. Most of this kill was replaced with additional quota caught in the 1995-96 financial year and sold in the 1996-97 financial year. The value of farmed tuna was maintained through 1995-96 to 1996-97, but it more than doubled in 1997-98, and doubled again in 1998-99, to $A167 million.
Table 9. Changes in gross value of the Australian southern bluefin tuna fisherya
|
Year |
Wild caught |
Farmed |
Gross totala |
|||
|
Value |
Quantity |
Value |
Quantity |
Value |
Quantity |
|
|
1982-83 |
14.3 |
21 300 |
|
|
14.3 |
21 300 |
|
1983-84 |
12.6 |
15 800 |
|
|
12.6 |
15 800 |
|
1984-85 |
16.2 |
13 500 |
|
|
16.2 |
13 500 |
|
1986-87 |
23.0 b |
11 800 |
|
|
23.0 b |
11 800 |
|
1987-88 |
18.1 b |
10 100 |
|
|
18.1 b |
10 100 |
|
1988-89 |
20.3 |
6 000 |
|
|
20.3 |
6 000 |
|
1989-90 |
60.4 c |
5 000 |
|
|
60.4 c |
5 000 |
|
1990-91 |
55.5 |
4 300 |
|
|
55.5 |
4 300 |
|
1991-92 |
63.4 |
5 100 |
1.8 |
100 |
65.2 |
5 200 |
|
1992-93 |
98.0 |
4 900 |
10.2 |
500 |
108.2 |
15 100 |
|
1993-94 |
80.3 |
4 700 |
24.2 |
1 300 |
104.5 |
6 000 |
|
1994-95 |
86.3 |
5 200 |
38.0 |
1 900 |
124.0 |
7 100 |
|
1995-96 |
45.9 |
5 100 |
39.9 |
2 000 |
85.8 |
7 100 |
|
1996-97 |
40.9 |
5 900d |
40.2 |
2 100 |
81.1 |
8 000 |
|
1997-98 |
40.9 |
4 800 |
87.2 |
5 100 |
128.1 |
9 900 |
|
1998-99 |
56.8 |
5 600d |
166.7 |
6 400 |
223.5 |
12 000 |
a No allowance is made in these figures for wild caught catch that goes into the cage-raising operation at Port Lincoln.3.5 International co-operative fishing arrangements under ITCQb Includes $A7.57 million paid by Japanese industry to the Australian industry to reduce the annual catch of SBT by 3000t for three years. As the Australian quota, along with the global quota was substantially reduced in 1988-89, and there was no additional annual 3000t decrease of Australian catch in that year, the payment is distributed over two rather than three years.
c The Australia-Japan joint venture commenced this year. The value of Australian quota taken by the joint venture is based on the price received in Japan less transport and marketing cost.
d The apparent discrepancy between catch and quota limits is because the fishing season is not synchronous with the financial year.
Source: ABARE (2000) and earlier editions.
In 1986 an agreement was made between Japanese industry and South Australia quota-holders for the South Australian industry to forgo catching 3000t of its quota in the 1986-87, 1987-88 and 1988-89 seasons. In return, those forgoing catching quota received a total compensation of $A7.57 million from the Japanese industry. The pay-off to the Japanese tuna long-liners was: that tuna not taken by Australian operators would later become accessible to Japanese long-line operators.
In 1988-89, continuing concern over parent stock levels led to a reduction in global and in national quota levels. As a result the Australian quota was reduced to 6250t and the industry-to-industry agreement was suspended. Australian operators did not forgo catching any of their quota in 1988-89, the third year of the agreement, although the initial payment was retained.
The 1988-89 season saw the introduction of a new element into the fishery, namely the use of Australian quota by Japanese owned and crewed long-line boats to take SBT in the Australian fishing zone in a joint-venture with Australian industry. This operation peaked in 1992-93, when more than 50% of quota was taken by the joint-venture operators. A further change was the use of Australian quota by the Japanese fleet operating on the high-seas beyond the Australian fishing zone. This was part of a programme using Japanese as well as Australian quota to take catch as part of a real-time monitoring-programme[98]. As a result of these two programmes, Japanese vessels took 65% of the Australian quota in 1992-93.
These changes resulted in a substantial increase in the net-returns enjoyed by the Australian quota-holders involved in these operations[99]. The conditions of this agreement also included $A500 000 over three years for SBT research, an annual levy of $A1.4 million for monitoring and enforcement, training of Australian crew in long-lining, and funds for research on SBT farming. In addition to the Australian quota used in the joint-venture, some additional Australian quota was used by Japanese vessels to catch SBT outside the Australian fishing zone for purposes of real time monitoring of fish stocks. The value of the catch taken under the Joint Agreement and the Real-Time Monitoring-Programme is presented in Table 10.
The last year of real-time monitoring and joint-venture operations was 1994-95, when Japanese boats took 37% of the Australian quota. The reason for the cessation of these co-operative operations was the failure of Japan and Australia to come to an agreement on the global quota. In the meantime, Australia has continued to operate according to the Australian national quota arrived at within the CCSBT.
Table 10. Catch under Joint-venture and the Real-Time Monitoring programmes
|
Operations |
1988-89 |
1989-90 |
1990-91 |
1991-92 |
1992-93 |
1993-94 |
1994-95 |
|
|
Joint venture |
t a |
684 |
400 |
881 |
2057 |
2735 |
2299 |
1295 |
|
$A b |
37 620 |
22 000 |
28 190 |
37 643 |
74 726 |
17 128 |
35 379 |
|
|
RTMP c |
t a |
|
|
300 |
800 |
650 |
270 |
650 |
|
$A b |
|
|
9893 |
14 640 |
17 759 |
7377 |
17 759 |
|
|
Total
|
t a |
684 |
400 |
1181 |
2857 |
3385 |
2569 |
1945 |
|
$A b |
|
|
|
|
|
|
|
|
a Landings are provided by Agriculture, Forests and Fisheries Australia.While not directly related to the SBT fishery ITCQ management programme, Japanese fishers have been able to take SBT within the Australian fishing zone (Table 11). This access has been particularly important as it has enabled Japanese operators to target large fish off south-east Tasmania.b Unit values used to estimate total values are from ABARE (1996) and previous years. Note that as ABARE volume values are for financial year not fishing season, they have not been used in the table.
c Real Time Monitoring programme.
Table 11. Catch and value of Japanese quota taken by Japanese operators in the Australian fishing zone
|
|
1986-87 |
1987-88 |
1988-89 |
1989-90 |
1990-91 |
1991-92 |
1992-93 |
1993-94 |
1994-95 |
1995-96 |
|
Catch (t) |
1134.4 |
1026.6 |
2308.2 |
1693.1 |
660.6 |
386.8 |
804.4 |
436.3 |
410.7 |
358.8 |
|
Value ($m) |
62.5 |
61.7 |
126.3 |
72.9 |
25.3 |
12.2 |
31.6 |
17.9 |
15.7 |
13.1 |
Source: Hogan, Van Landegham and Topp (1997).Japanese fishers were excluded from fishing within the Australian fishing zone in 1984-85 as well as since 1995-96 as a result of the failure to agree on the amount of global quota. Acting outside of the Commission for the Conservation of Southern Bluefin Tuna, the Japanese fishery took an additional 2000t of SBT in 1999 and as a result, Australia and New Zealand took Japan to the International Tribunal for the Law of the Sea. In 1999, the tribunal placed an interim injunction on Japan taking additional SBT, even if the catch were to be part of an experimental fishing programme. The Tribunal ruled that the members of the CCSBT ensure they maintain their annual catch at the quantities last agreed to within the Commission. The Tribunal ruling requires Japan to treat the ‘experimental’ catch as part of its national quota of 6065 t. The 714t from the ‘experimental fishing programme’ was counted against the 1999 allocation of 6065t, with the remaining 1484t counted against the 2000 allocation of 6065t.
On 7 August 2000, a five-member international arbitral tribunal invoked the interim provisional measures imposed on Japan by the International Tribunal for the Law of the Sea. The Tribunal noted that the successful settlement of the dispute would be promoted by the parties abstaining from any unilateral act that may aggravate it (International Centre for Settlement of Investment Disputers 2000). Since the interim decision, the members of the CCSBT have moved closer to resolving the issues on which the original dispute was based.
4. CONCENTRATION OF OWNERSHIP
4.1 Status prior to the programme
In 1981-82, the Australian SBT fishery consisted of 117 operators, although, on the 1 October 1984, 136 boats were allocated SBT quota allocation in excess of 5t. Of these 136 quota-holding boats, 26 (19%) were in New South Wales, 40 (29%) in South Australia, and 70 (52%) in Western Australia. In the three years prior to the programme the average seasonal catch by the Australian fleet was 18 700t, with an average global catch of 43 600t.
Without action being taken in Australia, the focus of operation for the Australian SBT fleet is likely to have moved to targeting of the 2 - to 3-year-old (juvenile) fish off Western Australia This would have likely lead to declining catch, reduced gross returns and the eventual collapse of the fishery. At the global level, it was recognised that the global catch would have to be reduced, and researchers proposed that the parent stocks be allowed to recover to their 1980 levels by the year 2020.
4.2 Restrictions on transfer of ownership
While there are no restrictions on the lease or sale of Australian SBT quota within Australia, quota can only be used by a boat operator who either holds, or is operating on behalf of the holder of, a Commonwealth fishing permit. However, the Australian Fisheries Management Authority (AFMA) has placed a requirement on the long-liners (operating in waters off southeastern Australia during those periods of the year when southern bluefin tuna are likely to be taken) to hold a minimum SBT-quota of 500kg (AFMA 2000).
4.3 Effects of the programme
A number of changes occurred following the introduction of ITCQ into the SBT fishery. These included structural changes to the national fishery, to fishing technology, and changes in market provision and product. While many of these changes may not have been the direct result of the introduction of ITCQ, it is likely that the management-changes facilitated these outcomes. In addition, without changes in the management of the fishery, the fishery would have collapsed. Without an ITCQ programme, the benefits received by leavers on exiting the fishery would not have been possible.
The major structural changes observed in the fishery were the immediate concentration of quota-ownership and fishing operations to South Australia, the cooperation between Australian and Japanese fishing operations, and the later return of SBT to waters off the coast of New South Wales. The cooperation between Australia and Japan included the leasing and withdrawal from the global fishery of Australian quota by the Japanese fishing industry in the 1986-87 and 1987-88 Australian fishing seasons, the use of Australian quota by the Japanese high-seas fleet for the purpose of real-time monitoring of catch and the Australia-Japan joint-venture long-line fishery. The closure of the real-time monitoring and the Australia-Japan joint-venture programmes has seen most of Australia’s quota shift to the SBT grow-out ranching operations off Port Lincoln in South Australia. These farm operations were assisted by Japanese finance and technology.
Changes in the use of fishing technology included the use of long-line fishing methods off the New South Wales coast, with the quantity of landings taken by long-line increasing from 15t in 1990-91, to 648t in 1997-98 (Table 12), or 12% of SBT quota. The use of purse-seine to capture and transport live fish to the fish-farms off Port Lincoln, and the use of sea cages to grow out and improve the quality (intra-muscle marbling) of juvenile fish. These changes in fishing technology included changes in product and in marketing. Wild-caught landings are no longer being directed to canning in Australian, or shipment to Italy, rather now to the Japanese sashimi market either directly, or following grow-out activities.
In addition to a gross increase in the value of SBT product (Table 9), there has been an increase in realised rent-returns to the fishery to the benefit of fishers, tuna farmers and society as a whole. The expected rent-returns at the introduction of the management plan were important in affecting the price paid to those owner-operators leaving the fishery, and assisted the structural adjustments that occurred in the fishery. While there has been a recovery of SBT stocks off eastern Australia, the rate of recovery in fishing operations is not as great as was expected. The degree to which landings increase off eastern Australia under the current management plan will depend on the relative profitability of east coast operations compared to elsewhere. To-date, SBT quota-holdings and operations continue to be concentrated off South Australia. A possible factor in that this is the high growth-rates obtained from 4 - to 5-year-old SBT in the grow-out cages more than compensates for any improvement in the return on quota-holdings from taking larger fish.
5. DISCUSSION
5.1 Reduction in fleet-capacity
5.1.1 Objectives
The purpose of the 1984 ITCQ-based management plan was to (a) conserve fish stocks while (b) meeting an economic efficiency objective and to move closer to optimal resource. The introduction of the 1984 management plan appears to have moved the Australian SBT fishery towards meeting both objectives. There has been a reduction in the fleet-capacity and the amount of catch, while the overall value of Australian SBT production has increased several fold, particularly with the inclusion of farmed production.
Table 12. Distribution of landings and catch methodology used to take Australian quota 1988-89 to 1997-98
|
Quota year |
Domestic operators a |
Joint - venture long-line |
Real-Time Monit. Prog b |
Total landings with Austr. quota |
National quota |
||||||
|
Jurisdiction |
Method |
Total |
|||||||||
|
Western Austr. |
South Austr. |
New South Wales |
Tas-mania |
Long- line |
Surf-ace |
||||||
|
1988-89 |
425 |
4872 |
1 |
2 |
1 |
5299 |
5300 |
684 |
0 |
5984 |
6250 |
|
1989-90 |
230 |
4199 |
6 |
14 |
6 |
4443 |
4449 |
400 |
0 |
4849 |
5265 |
|
1990-91 |
220 |
2588 |
15 |
57 |
15 |
2865 |
2880 |
881 |
300 |
4061c |
5265 |
|
1991-92 |
17 |
1781 (138)d |
124 |
56 |
124 |
1854 |
1978 |
2057 |
800 |
4835 |
5265 |
|
1992-93 |
0 |
1506 (722) |
254 |
67 |
350 |
1477 |
1827 |
2735 |
650 |
5212 |
5265 |
|
1993-94 |
0 |
1970 (1294) |
286 |
112 |
446 |
1922 |
2368 |
2299 |
270 |
4937 |
5265 |
|
1994-95 |
0 |
2864 (1954) |
157 |
113 |
268 |
2866 |
3134 |
1295 |
650 |
5079 |
5265 |
|
1995-96 |
0 |
4809 (3362) |
117 |
262 |
351 |
4837 |
5188 |
0 |
0 |
5188 |
5265 |
|
1996-97 |
0 |
4498 (2498) |
236 |
244 |
471 |
4507 |
4978 |
0 |
0 |
4978 |
5265 |
|
1997-98 |
0 |
4403 (3487) |
388 |
694 |
648 |
4403 |
5087 |
0 |
0 |
5097 |
5265 |
|
1998 - 99 |
|
(4991) |
|
|
216 |
5016 |
5207 |
216 |
0 |
5232 |
5265 |
a Involving domestic operators.While the reductions in Australian, Japanese and New Zealand catch has resulted in conservation benefits, the long-term conservation benefits are less certain. However, over this time, the amount of catch by others, outside of the CCSBT, has increased. This has impacted on the conservation objective of the CCSBT and on the incentive for Commission members to cooperate.
b Real time monitoring programme
c 700t of quota was not allocated in 1990-91.
d The values in brackets show the amount of catch taken to be grown out in farm cages.Source: AFMA.
5.1.2 Initial impact of programme
In the first two years following the introduction of the new management plan, fleet numbers as well as the number and capital value of boats active in the fishery were reduced, as too were landings. At the same time fleet profitability increased (Table 13). The expected increase in returns under ITCQ helped to finance the restructuring of the fishery, while the realised economic returns have benefited operators in the industry and the Australian public as a whole.
Table 13. Summary of immediate impact following the introduction of ITCQ
|
|
Landings 1000t |
Gross value |
No. of Boats |
Quota allocation tonnes |
Gross reduction in capitalisation |
Changes from 1983-84 through 1985-86 financial years
($A) |
||||
|
83-84 |
86-87 |
83-84 |
86-87 |
Rent |
Family Income |
WA capital value |
||||
|
Fleet |
21.0 |
- |
12.6 |
- |
136 |
14 046 |
- |
- |
- |
- |
|
Stayers |
- |
11.5 |
- |
23.0 |
54 |
9 520 |
- |
+6.5 m |
- |
- |
|
Leavers |
- |
- |
82 |
4 526 |
-17.4 |
- |
+2 600 |
+32 848 |
||
Source: from previous tables.Another element in the use of individual, transferable catch-quota in restructuring the fleet was the average annual earnings of those who left the fishery increased, and (for Western Australia at least) the capital value of their fishing assets also increased (Table 13). The results indicate that on a state fishery basis, the state-by-state differences in the rates at which quota-holders left the fishery, is consistent to the relative differences in the opportunity-cost of remaining in the fishery. It could be expected that if the same economic incentive would have existed for operators within each state fishery and, as a result, the same relative behavioural responses would have been observable within each state. The increase in the average family-income observed for Western Australian ‘leavers’ is consistent with this.
In spite of these benefits, the management changes introduced in 1984 did cause stress and disruption to individuals and their families involved with the SBT fishery. However, compared to the possible impact of other alternatives, such as input-controls or use of a total-quota (see Section 3.4.1), the disruption and economic loss to operators and their families is likely to have been less. In Western Australia, the Commonwealth government also provided financial assistance for restructuring.
5.1.3 Ongoing effects
There have been a number of changes in the Australian SBT fishery following the introduction of ITCQ on 1 October 1984, in particular the restructuring and the reduction of annual landings to around 5000t and the substantial increase in returns to individual operators and to the fishery as a whole. This has come about due to: a bilateral agreement between Australian and Japanese operators in the use of Australian quota both within the Australian fishing zone and on the high seas; the development and growth of tuna-farming; and changes in marketing. The institutional structure provided by ITCQ is likely to have been important in facilitating these outcomes. The fall of the Australian dollar over this time against the Japanese yen has also been important in the improvement of the value of SBT product.
In addition, under their bilateral agreement, Japan provided expert input to the Australian long-lining operations and to the growing-out, or farming, of juvenile SBT. The withdrawal of the Japanese SBT fishing industry from the joint Australia-Japan SBT operations in 1996, saw the value of the SBT production fall from $A128 million in 1995-95, to $A85.8 and $A81.1 million in 1995-96 and 1996-97. However, by 1997-98 and 1998-99, the value of Australian SBT production had increased to $A128.1 and $A223.5 million respectively. The reason for this recovery has been the transfer of over 90% of the quota-catch to the grow-out ponds in South Australia. As a result, the assumed value of SBT landings were, respectively, $A40.9 million and $A56.8 million[100].
At the global level, there were further reductions in the global quota in 1986-87 from 38 650t to 19 500t, and finally to 11 750t (the current level) in 1989-90. Questions remain in regard to whether the CCSBT’s conservation objective, that parent stocks be allowed to recover to the 1980 level by 2020, will be achieved. While the substantial catch reductions by CCSBT members would have had a positive long-term effect on SBT stocks, it is questionable whether the stock will achieve the agreed performance objectives. While there is a general agreement among the members of the CCSBT on the current status of stocks, the members disagree on future stock-projections, with projections ranging from significant stock-rebuilding to further declines in stocks under current harvest-levels. Australian estimates indicate that a 15% reduction in catch would provide a 50% probability of recovery, and a 35% reduction would give a 75% probability of recovery (Hayes 1997, pp. 16-17).
Globally, there was a two-thirds reduction in reported southern bluefin tuna landings to 17 700t between 1983 and 1987. However, the build-up in stock numbers and the limitation of the make-up of the membership of the CCSBT has provided an incentive for others to enter and to increase their effort in the SBT fishery. As a result, the estimated global catch of SBT in 1998 was 19 240t, with an additional 1460t catch by the Japanese fleet beyond their national quota. This is a one-third increase in the global quota set by the CCSBT.
Kennedy (1999) found there is little incentive for Australian, Japan and New Zealand to co-operate as members of the CCSBT in setting global TAC-levels as long as SBT fishers outside of the CCSBT are taking catch in addition to the CCSBT global quota. Bioeconomic modelling by Kennedy, Davies and Cox (1999) indicates that reductions in present catch can lead to an increase in future catch and an increase in the future value of the fishery.
5.2 Concentration of ownership
The introduction of ITCQ into the Australian SBT fishery in October 1984 has been followed by a number of structural and operational changes. In October 1984, 64% of the quota allocation went to operators in South Australia, with 19% to those in Western Australia, and 14% to those in New South Wales. In 1998, South Australia operators had increased their proportion of quota by almost 50% to 92% of the national quota. In spite of the increasing availability of catch off the New South Wales coast and the expected shift in quota to the Australian east coast, only 2% of the quota was held in that State. The retention of quota appears to be the result of the quantum jump in the value of sales of farmed-tuna over what would have been received for quota-catch.
In operational terms, there has been a reduction in landings to one-third of what they were in the season prior to the introduction of quota, there has been a reduction in the capitalisation of the fleet and there have been substantive change in the technology used to catch and produce sashimi-quality SBT products (Table 14). These changes on the production-side were also accompanied by a shift on the demand-side with the diversion of product from canning to the high value Japanese sashimi market.
Table 14. The distribution of Australian SBT quota at October 1988, November 1999
|
|
New South Wales |
South Australia |
Western Australia |
Queensland |
|
Quota distribution October ‘84 |
2 022t (14%) |
9 271t (64%) |
2 752t (19%) |
- |
|
Quota distribution November ‘99 |
123t (2.4%) |
4762 (91.6%) |
267 (5.1%) |
48 (0.9%) |
Note, this is for quota-holders holding in excess of 5t, seven boats having received 5t or less. While the statistics presented in this paper have been on the basis of those holding in excess of 5 tonne of quota, at November 1999, 44 owners held 5t or less of quota, which accounted for 65t.6. LITERATURE CITEDSource: AFMA
ABARE - Australian Bureau of Agricultural and Resource Economics 1994. Commodity Statistical Bulletin, ABARE, AGPS, Canberra.
ABARE - Australian Bureau of Agricultural and Resource Economics 1996. Fishery Statistics 1996, ABARE, AGPS, Canberra.
ABARE - Australian Bureau of Agricultural and Resource Economics 1999. Commodity Statistical Bulletin, ABARE, AGPS, Canberra.
AFMA - Australian Fisheries Management Authority 2000. New management arrangements for east coast tuna to minimise the incidental catch of SBT, AFMA News, 4, issue 3, pp 1 and 8.
BAE - Bureau of Agricultural Economics 1983. BAE warning on ‘commercial extinction’ of tuna, Australian Fisheries, 8, pp. 12-13, AGPS, Canberra.
BAE - Bureau of Agricultural Economics 1986. Southern Bluefin Tuna Survey 1980-81 and 1981-82, Project no. 62300, Bureau of Agricultural Economics, Canberra.
Campbell, D. 1984. Individual Transferable Catch Quotas, their Role use and Application, Fishery Report no. 11, Northern Territory Department of Primary Production, Darwin.
Campbell, D. and L. Wilkes 1988. Report to the Australian fisheries Service on those leaving the southern bluefin tuna fishery. ABARE, Canberra.
Campbell, D., T. Battaglene and D. Brown 1996. Use of individual transferable quotas in Australian fisheries. Paper presented at the International Institute of Fisheries Economics and Trade International Workshop on Assessment and distribution of Harvest Quotas in Fisheries, Aalesund, Norway, 8-11 July, 1966.
Campbell, D., D. Brown and T. Battaglene 2000. Individual transferable catch quotas: Australian experience in the southern bluefin tuna fishery, Marine Policy 24(2):109-117.
Caton, A. 1987. Australia fills SBT quota in 1986-s87 season, Australian Fisheries 46(12):12-14.
Caton, A. and J..Majkowski 1987. Warning issued on global catch limits, Australian Fisheries 42(3):278-91.
Geen, G. and M. Nayar 1989. Individual Transferable Quotas and the Southern Bluefin Tuna Fishery, ABARE Occasional Paper no. 105, AGPS, Canberra.
Grainger, G. 1988. Australian Fisheries and Administrative Appeals Tribunal, Department of Primary Industries and Energy, AGPS, Canberra.
Hayes, E.A. 1997. A Review of the Southern Bluefin Tuna Fishery: Implications for Ecologically Sustainable Management, Traffic Oceania, Sydney.
Hampton, J. and J. Majkowski 1986. Scientists fear SBT problems worsening, Australian Fisheries, 45(12):6-9.
Hogan, L., K. Van Landegham and V. Topp 1997. Access Fee Arrangements for Japanese Fishing Vessels in the Australian Fishing Zone, ABARE report to the Fisheries Resources Research Fund, Canberra.
Industries Assistance Commission 1984. Southern Bluefin Tuna, Industries Assistance Commission Report, AGPS, Canberra.
International Tribunal for the Law of the Sea 1999. Southern Bluefin Case (New Zealand v. Japan; Australia v. Japan), Requests for provisional measures (nos. 3 and 4). Rendered under Annex VII of the United Nations Convention on the Law of the Sea.
International Centre for the Settlement of Investment Disputes 2000. Southern Bluefin Tuna Case (Australia and New Zealand v. Japan), Awarded on jurisdiction and admissibility. Rendered under Annex VII of the United Nations Convention on the Law of the Sea; www.worldbank.org/icsid.
Kennedy, J. 1999. A dynamic model of co-operative and non-co-operative harvesting of southern bluefin tuna with an open access fringe, 1999 World Conference on Natural Resource Modelling, Saint Mary’s University, Halifax, Canada, 23-25 June.
Kennedy, J.O.S. and J.W. Watkins 1984. Optimal Quotas for the Southern Bluefin Tuna Fishery, Economic Discussion Papers no. 4/84, Latrobe University.
Kennedy, J.O.S. and J.W. Watkins 1985. Modelling the economic returns of SBT, Australian Fisheries, 44. no. 7, pp. 37-40.
Kennedy, J.O.S., L. Davies, and A. Cox 1999. Joint rent maximisation and open access competition in the southern bluefin tuna fishery. ABARE paper presented at the Combined 43rd Annual Australian and 6th Annual New Zealand Agricultural and Resource Economics Society Conference Christchurch, New Zealand, 20-22 January.
Majkowski, J. and A. Caton 1984. Scientist’s concerns behind tuna management, Australian Fisheries, 43(3) 371-82.
Smith, P. 1986. Tuna. In: Haynes, J. and P. Smith. Market Trends for Australian Fisheries Products, BAE (now ABARE) report no.86.3, AGPS Canberra, pp. 54-64.
Wesney, D., B. Scott and P. Franklin 1985. Recent developments in the management of major Australian fisheries: Theory and practice. In Proceedings of the Second Conference of the Institute of Fisheries Economics and Trade. Vol.1: Christchurch, New Zealand, August 20-23, 1984. pp. 289-303.
![]()
![]()
![]()