![]()
![]()
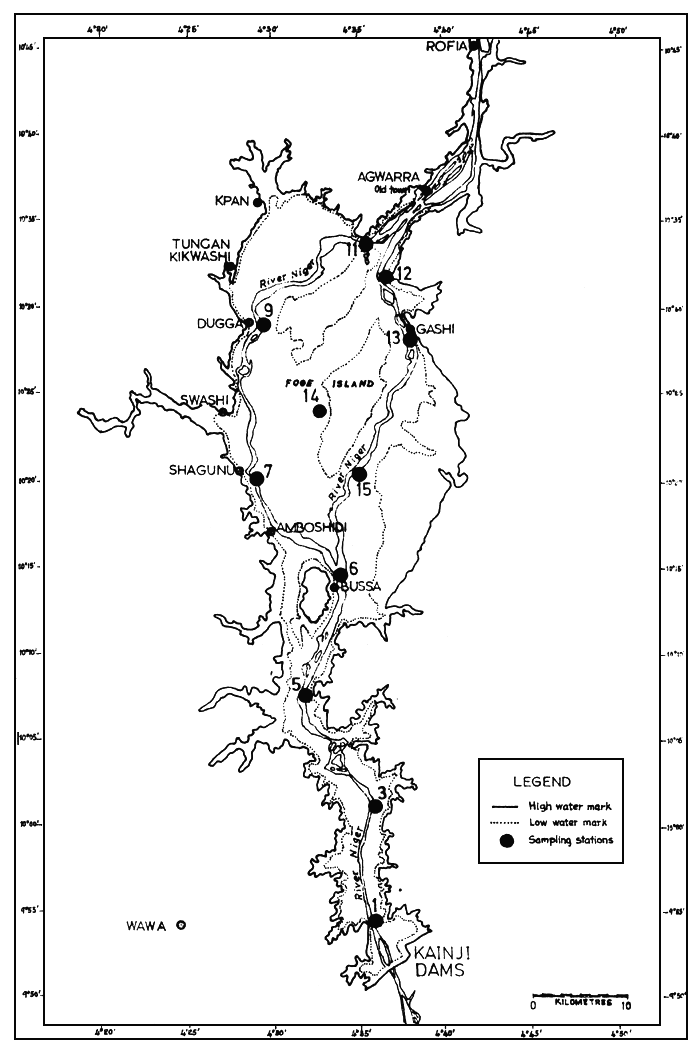
Fig. 1-Map of Kainji Lake, redrawn from White (1965), with limnological sampling stations indicated.
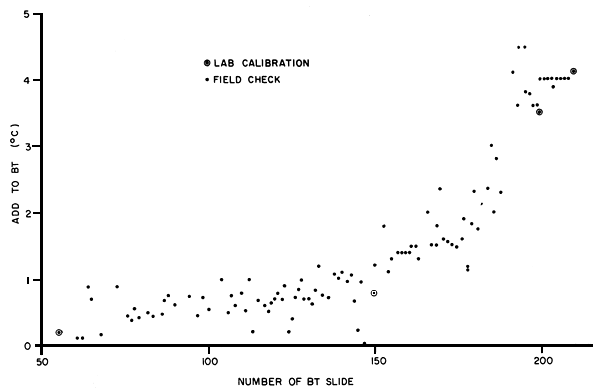
Fig. 2 - Control chart for bathythermograph calibration. The ordinate is the difference between the temperature measured with a mercury thermometer in a water sample taken from 1 metre and the temperature indicated by the bathythermograph for the same depth. Circled points are differences measured by mercury thermometer and bathythermograph in a water tank at the laboratory.
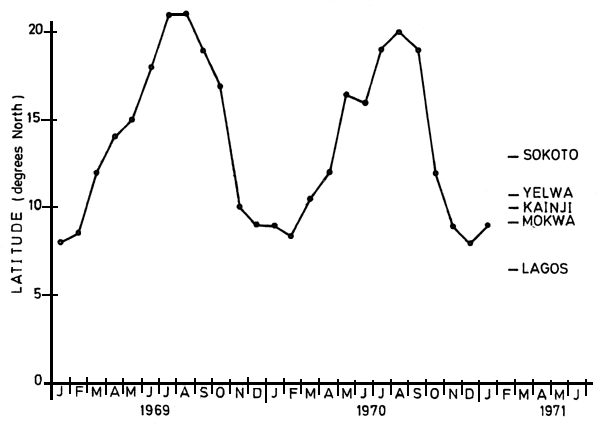
Fig. 3 - Approximate latitudinal position of the Intertropical Front (ITF) as taken from the Agrometeorological Bulletin of the Nigerian Meteorological Service. The latitudes of reference towns are shown at the right.
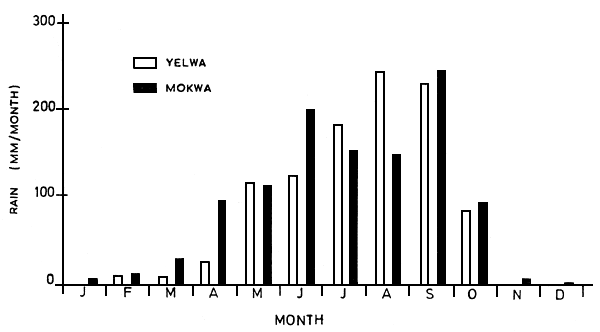
Fig. 4 - Average rain per month at two stations near Kainji Lake from the Agrometeorological Bulletin of the Nigerian Meteorological Service.
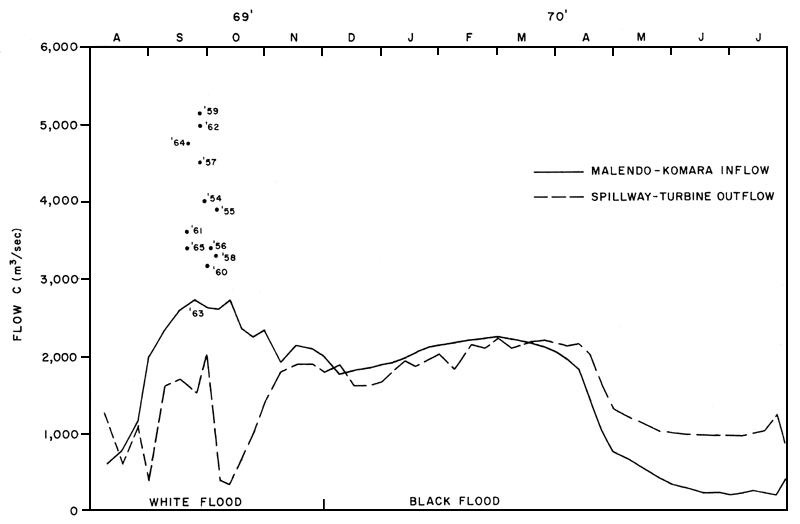
Fig. 5 - Inflow and outflow at Kainji during a year of low flood (1967–70). Dated points are the peaks of the white flood for the stated years.
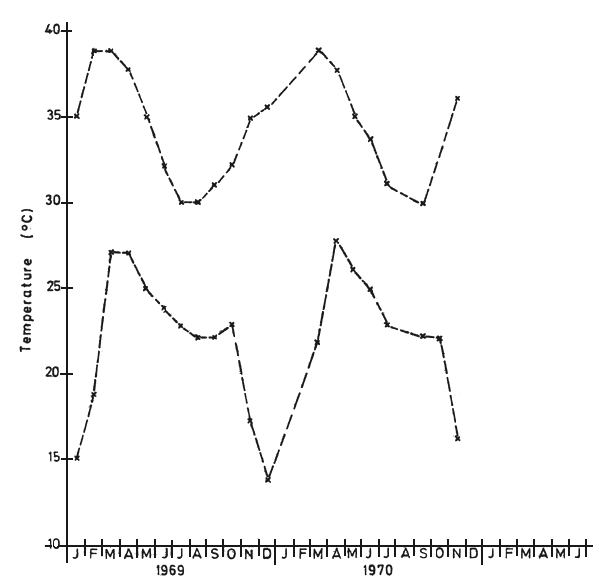
Fig. 6 - Maximum and minimum air temperature by month. Data shown are averages of Yelwa and Mokwa taken from the records of the Nigerian Meteorological Service (Agrometeorological Bulletin).
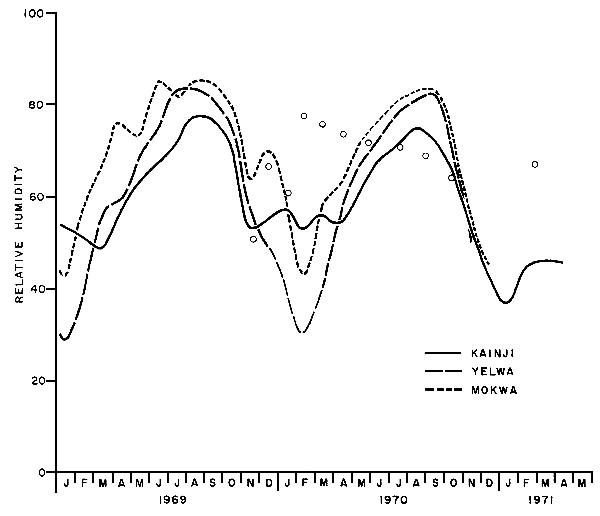
Fig. 7 - Relative humidity by month (mean of daily measurements at 10.00 h). Yelwa and Mokwa data from Agrometeorological Bulletin and Kainji data from NDA meteorological records near the dam site.
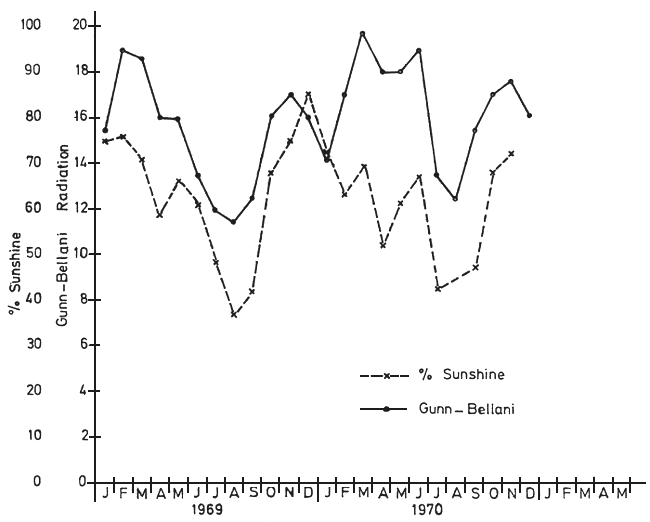
Fig. 8 - Radiation climate at Kainji. Data were obtained from Agrometeorological Bulletin and averaged for the Yelwa and Mokwa stations.
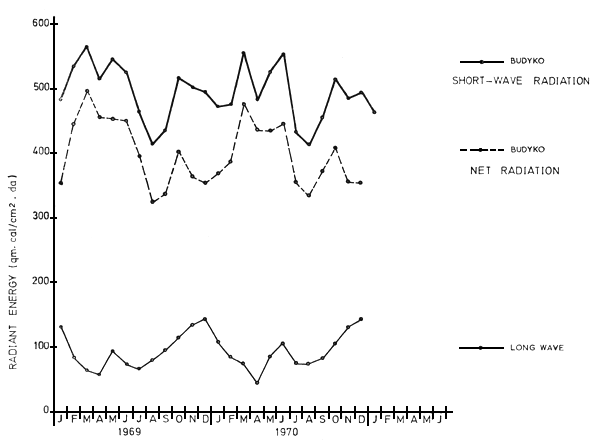
Fig. 9 - Radiation balance calculated for Kainji region using the formulae of Budyko (see text).
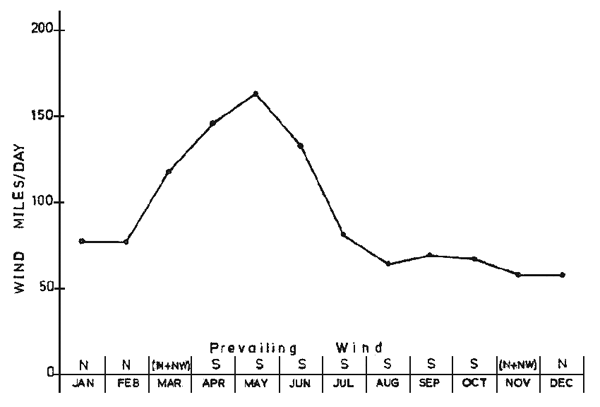
Fig. 10 - Wind run (monthly average) for the Yelwa station (Agrometeorological Bulletin 1969), and prevailing winds for Yelwa from data assembled by J. R. Charter, unpublished.
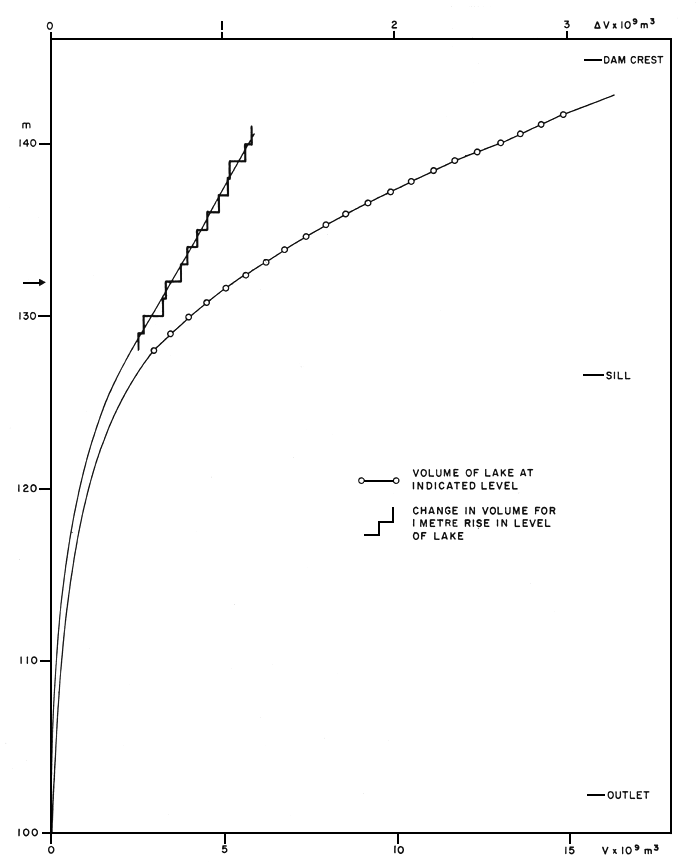
Fig. 11 - Hypsometric chart for Kainji from volume data provided by the Niger Dam authority.
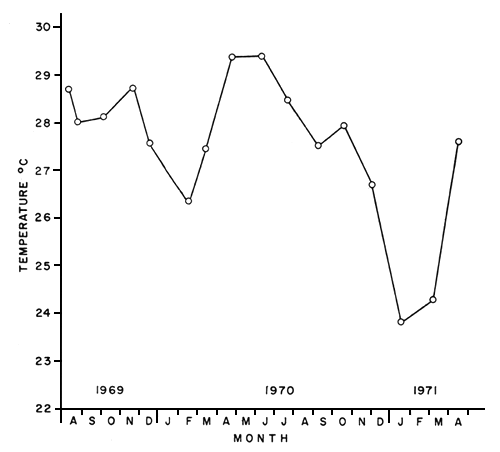
Fig. 12 - Mean temperature of the water column at Station 1 calculated from hypsometric data and bathythermograph observations (1969–71).
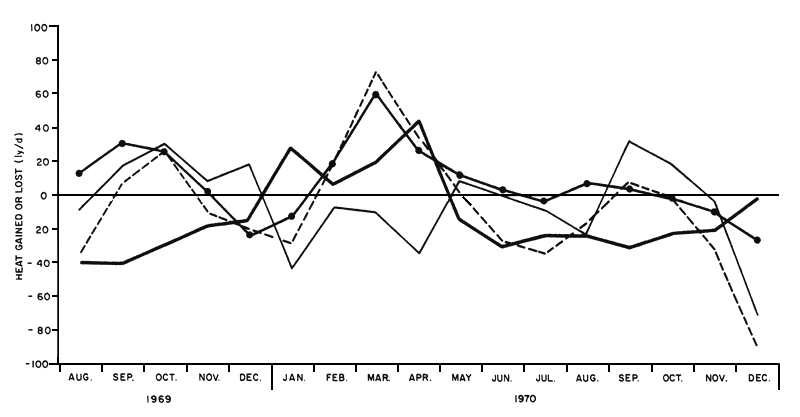
Fig. 13 - Components of the heat budget;
- Net radiation minus evaporation
--- Storage (change in water temperature)
•-• Advection (inflow heat minus outflow heat)
— Convection
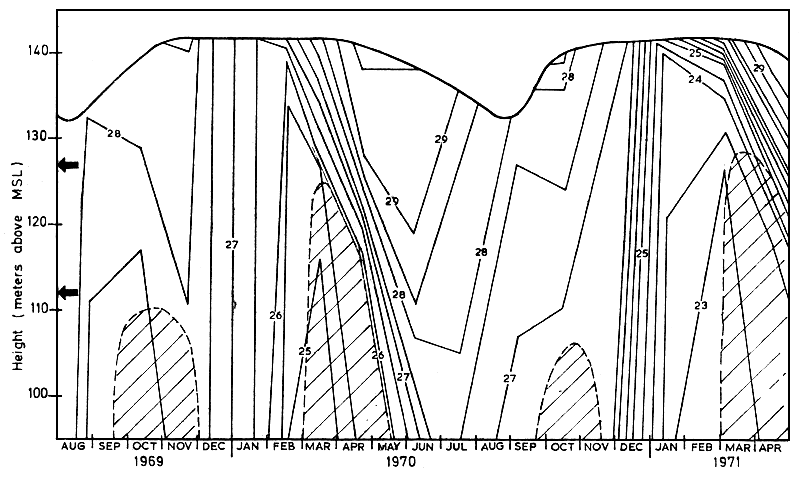
Fig. 14 - Thermal structure of the lake through the period of study. Upper boundary shows the changes in lake level. The numbered lines are isotherms drawn for internal of 0.5°c. Closely spaced lines indicate rapid change in time or depth. Shaded zones indicate depths and times of oxygen depletion ( < 1 ppm of O2).Heavy arrows indicate depth of spillway (upper) and discharge through the turbines (lower).
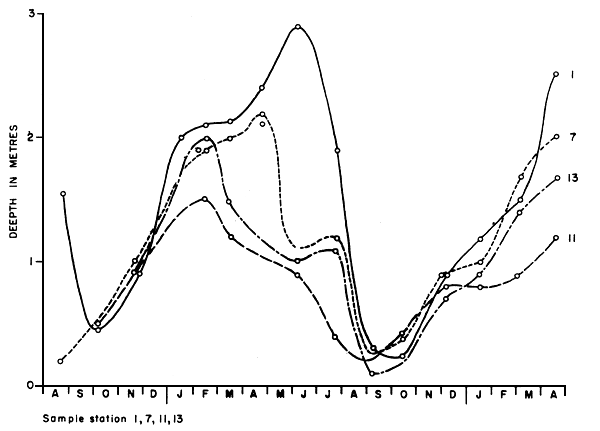
Fig. 15 - Seasonal change in water transparency (Secchi depth - depth of disappearance of standard white discs) at three stations: Station 1, near the dam, Station 7, western part of the mid-late region, Station 11, west side of Foge Island, Station 13, eastern part of mid-lake region.
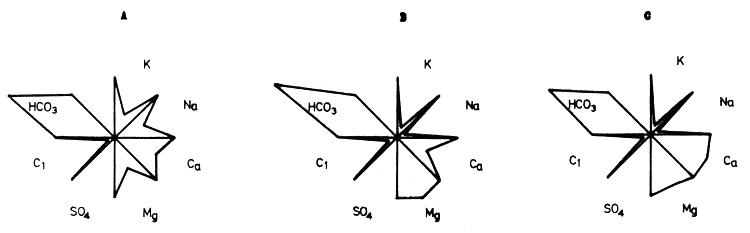
Fig. 16 - Chemical composition of Kainjl water by major ions: A - Rinen (White report, 1965); B-Open lake, 1969; C-Shagunu Bay, 1969
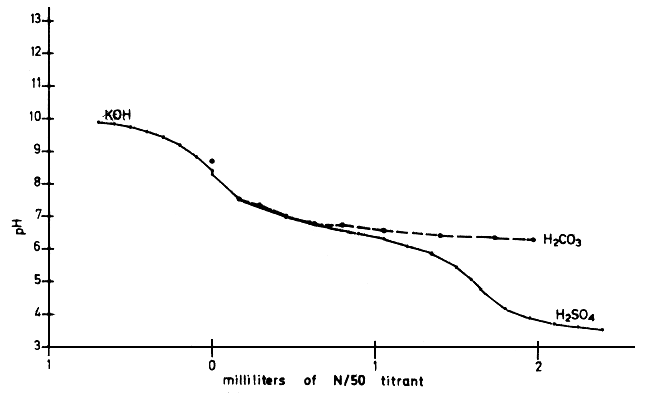
Fig. 17 - Titration curve for Kainji Lake water (South arm, October 1969). Strength of the carbonic acid calculated from assumed strength of CO2 saturated water. Sample volume - 62 ml, temp. 28°C.
![]()
![]()