![]()
![]()
![]()
Quantitative phenotypes are the important production traits, such as length, weight, feed conversion, and eggs/kg female. When working with these traits, a farmer does not separate fish into descriptive non-overlapping categories as he does with qualitative phenotypes (for example, red vs normally pigmented). Instead, each trait is a single phenotype (for example, length), and the differences among individuals are determined by measuring the fish. The numerical value that is assigned to a fish when it is measured is an individual's phenotypic value.
Because an individual's phenotypic value is determined by measurement (for example, length in millimeters) rather than by descriptive category (for example, colour), selection is based on numerical values rather than appearance. For example, when selecting for a qualitative phenotype such as colour, farmers select fish which have a specific colour, and cull fish which have another; the decision to select or cull fish is based solely on descriptive category. When selecting for a quantitative phenotype, farmers select fish that meet or exceed a specific numerical value, and cull those that do not; the decision to select or cull fish is based solely on numerical values.
Selective breeding programmes that work with qualitative phenotypes are designed to create true-breeding populations. They are simple programmes that are designed to eliminate an undesired allele and fix a desired allele so the population breeds true and produces only the desired phenotype. This can usually be accomplished in a single generation (often by a single day of selection), and once this is accomplished, the farmer's goal has been achieved and the breeding programme is over.
In contrast, selective breeding programmes that are used to improve quantitative phenotypes are more sophisticated than those that are used to fix qualitative phenotypes. They require a higher level of technology and record keeping. Furthermore, they are open-ended in that they continue year after year, because it is not possible to produce true-breeding populations for these phenotypes. Instead, these programmes are designed to gradually improve the population's mean each generation. It is important to realize the fact that selective breeding programmes that work with quantitative phenotypes are never finished, and it is also important to strive for small but gradual improvements over many generations. It is possible to achieve huge improvements over the first one or two generations, but this can be accomplished only by severely reducing the size of the breeding population, which can result in inbreeding depression, and this could counteract much of the gains that were made by selection.
Another reason selective breeding programmes that are used to improve quantitative traits are open-ended is because if they are abandoned, much of the gain that was realized will be lost. It is difficult to predict how much gain will be lost if a programme is abandoned; that depends on the trait, the heritability, and the population. If the phenotype is controlled solely by additive genetic variance (h2 = 1.0), the mean will stay the same if the breeding programme is abandoned. However, no important production phenotype is controlled solely by additive genetic variance (Table 6). If a selective breeding programme is abandoned, much of the gain will be lost, because most of the gain due to dominance genetic variance, all of the gain due to epistatic genetic variance, and some of the gain due to genetic-environmental interactions will also be lost. Some of the gain due to additive genetic variance will remain, but the exact amount is difficult to predict.
If selective breeding greatly improved the population before the programme was abandoned, the mean might stabilize at a level recognizably greater than the original mean. However, if the gain was small, which is probably the case, the final mean might be only marginally greater than the original mean, and the difference might be obscured by yearly environmental effects.
Before initiating a selective breeding programme, a farmer must ask the following question: Is a selective breeding programme appropriate or necessary? The answer to this question depends on individual circumstances. The answer can even be different for neighbouring farmers.
The decision to conduct or not to conduct a selective breeding programme must be made at the individual level; it should never be made on a region-wide basis. There is a tendency by extension agents to try and get all farmers in their region to adopt new technologies. On an intellectual level, this makes sense because the extension agent knows that if every farmer adopts the new technologies, production will increase; farmers will get richer; and there will be more food.
The adoption of a selective breeding programme, like any aspect of technology, should be made only on a case-by-case basis. For the most part, the adoption of a selective breeding programme should be restricted to farmers who are capable of keeping and maintaining records, who are good managers, who adopt and maintain new technologies, and who are willing to incorporate some long-term planning into their management programmes. Finally, these farmers must be willing to spend the extra time that it takes to conduct a selective breeding programme and must also be willing to spend the money that it takes to conduct a programme.
Some farmers will never use nor should they be encouraged to use selection. These farmers are those that have small farms or that produce fish for only one or several families or perhaps for a small village. Farmers who do not have the expertise to keep good records or who do not have a sufficient number of ponds to devote to a breeding programme or who are unable or unwilling to spend money on a breeding programme should not attempt one or even be encouraged to attempt one.
A selective breeding programme is designed to improve productivity over generations (a generation is the replacement of brood fish by their offspring). It is designed to increase growth rates and yields gradually over many years. If a farmer cannot incorporate long-term (1–10 years) planning into his fish farming programme, he will abandon his selective breeding programme within months and will then discourage other farmers from initiating a selective breeding programme by telling them that selective breeding programmes do not work.
Farmers who cannot keep good records because they cannot read or write or who do not know how to measure fish are not good candidates to become breeders and conduct a selective breeding programme. In general, these types of farmers will not be able to conduct a successful breeding programme. On the other hand, if they are reliable farmers who work hard and who accept and adopt new technologies, they can initiate a selective breeding programme if an extension agent is willing to work closely with them and assume the responsibility for keeping records and for conducting much of the labour involved in the breeding programme.
Finally, farmers who are poor managers should never conduct a selective breeding programme. Farmers who seldom check their ponds, who feed the fish or manure the ponds only when they are reminded by the extension agent, or who make little effort to increase yields should not conduct a selective breeding programme. Farmers who cannot or who are unable to properly manage a fish pond are not going to be able to properly manage a selective breeding programme.
The major goal of most selective breeding programmes that are going to be used to improve quantitative phenotypes is to improve growth rate. This will also increase yield.
There are two basic approaches to improving yields: One is to use a breeding programme to improve the fish that are being cultured. The other is to improve the way the fish are being raised. Breeding programmes are expensive, while improvements in management are often inexpensive.
Consequently, if increases in growth rate and yield can be easily gained by alterations in management techniques or by the adoption of new management techniques, farmers should use this approach first. This approach can include the proper use of fertilizers or lime, stocking fish at the most appropriate density, stocking larger fingerlings in grow-out ponds, or feeding fish a prepared ration.
The major reason why the first approach to increasing yields and growth rates is to use better management is that it is usually cheaper and the results are immediate. Yields can often double or triple if ponds are fertilized properly or if fish are fed. The increase in yield that occurs because of fertilization or feeding can be realized during the first growing season and during the first harvest. Yields will increase as a result of a selective breeding programme, but the increase will be gradual and it will be over many years. For this reason alone, the first approach to improving productivity should be to improve management skills and to improve the way the fish are grown.
Additionally, you do not want to initiate a selective breeding programme and then change the way the fish are cultured after the programme has begun. When you select for quantitative phenotypes, you select for them as they are expressed under a specific set of culture conditions. The fish that perform best under high stocking rates in manured ponds may not be the ones that perform best under lower stocking rates when the fish are fed a prepared ration. When you select for the fastest growing fish under one set of culture conditions you are selecting for fish that contain genes that enable the fish to perform best under those conditions. Consequently, if you change the way the fish are raised, you may have already culled the genes that perform well under the new management programme.
Thus, it is important to determine if the management programme that is being used to produce fish at a given farm is that which will be used in the future. Small changes, such as changing the stocking rate in grow-out ponds from 2,000/ha to 2,500/ha or increasing the mean size of fingerlings that are stocked from 10 g to 15 g, are probably not that important; but large changes, such as changing from manure as the sole source of nutrients to a high-quality pelleted ration, are major alterations in management. If major changes are planned or are likely, then selective breeding programmes should be postponed.
Culture techniques in a region do not have to be standardized before selective breeding programmes are initiated. Some farmers may want to culture fish using fertilizers rather than pelleted feed because they have abundant and cheap sources of manures; others may want to use pelleted rations to maximize yields. Selective breeding programmes can be designed for both types of farmers, if they are willing to devote the time and money to conduct the programme and if they can devote sufficient pond space for the programme.
When should a selective breeding programme be initiated? A programme should be initiated only when the farmer decides he is willing to devote the time and effort that will be needed to ensure its success. Farmers who do not want to devote the effort either in terms of manpower or money or who are likely to abandon the project after the initial excitement wears off should not start a selective breeding programme.
Some farmers may be interested in a selective breeding programme but say that they will start one only after they solve all other problems. This means that they will never conduct a selective breeding programme, because all other problems will never be solved. Every time one problem is solved, another roadblock to increased production appears.
A selective breeding programme should begin when a farmer is willing to spend the time and money needed to conduct one, because he is convinced that such an undertaking is a way of increasing both food production and profits, and because he also realizes that these increased yields and profits are long-term goals. Finally, a farmer must also recognize that selective breeding programmes are open-ended, in that further improvements are always possible.
Before a farmer embarks on a selective breeding programme he must conduct an assessment to determine its usefulness; he needs to quantify his goals; he needs to know how the phenotype(s) will be measured; he needs to determine the type of selective breeding programme he will use; he needs to know how the results will be evaluated; and he must plan an annual evaluation and reassessment of the programme. A farmer can do this by himself or in consultation with extension agents.
The first step is to determine whether the programme is needed. Promoters often convince farmers that they need to make changes when none was needed. A salesman may have been impressed with the body shape of a fish that he saw in another province and feels that it would be a great idea if farmers would select for that body shape. If consumers truly desire that body shape and market surveys bear this out, then a farmer should consider a selective breeding programme to alter body shape. But if local consumers do not care and if there is no demand for the altered body shape, then the programme should not be initiated. Frivolous breeding programmes are a waste of money and manpower and may be counterproductive. The farmer must always consider what the consumer wants and what the consumer is willing to pay for when he initiates a selective breeding programme.
Another part of the assessment is to determine what traits should undergo selection. A farmer should prepare a wish list of all traits that he would like to improve. Once created, the list should then be pared to a handful of traits that make sense, in terms of the culture of the fish and its marketing. Some traits, like body weight, will be included in almost every selective breeding programme. Other traits that can make the initial cut are those that a farmer would like to improve, simply because they would make fish farming less risky or easier, such as increased disease resistance or increased catchability.
Some traits are totally unnecessary and should be eliminated immediately. A fish processing plant may want farmers to improve dressing percentage or to decrease visceral fat content because it will improve profits for the plant owners. But unless the plant owners are willing to pay more for fish with a better dressing percentage or with less fat, these traits should not be incorporated into a selective breeding programme.
Farmers should also eliminate some traits that are more easily improved by management. For example, it make little sense to use selective breeding to increase fecundity, because it is much easier and far less expensive to increase egg production by altering hatchery management. It also makes little sense because most fish are already highly fecund. Improving egg production from 4,000 eggs/kg female to 4,500 eggs/kg female is really not that important, and it is not necessary. If a farmer wants to produce more eggs, all he has to do is spawn more females or spawn larger females. Improving egg production via selective breeding is expensive, and an increase in egg production will not occur for at least one generation. On the other hand, improving egg production by altering hatchery management is inexpensive, and the increase is immediate.
Farmers should try to improve only the major phenotypes that improve profits-either because the fish grow faster, grow more efficiently, or survive better or because consumers are willing to pay more for them.
Hatchery managers who work at fingerling production centers might consider selecting for traits which could improve an industry or open new area to fish farming. For example: increasing salinity tolerance might enable fish farmers to grow fish in thousands of hectares of brackish water ponds; selection for earlier spawning date might enable farmers either to produce marketable sized fish in one growing season rather than two or to produce larger fish which command a premium price.
A second aspect of the assessment should be to decide whether the farmer is going to produce genetically improved fingerlings solely for his own use or whether he will become a fingerling farmer and produce genetically improved fish for a local fish farming industry. This decision determines how much money must be spent on the programme and the scope of the programme. If a farmer is going to produce genetically improved fish only for his own use, he needs to use only a portion of his farm for the project. On the other hand, a farmer who wants to produce genetically improved fingerlings for the local fish farming industry may need to use most, if not all, of his farm for this project.
One of the major purposes of reducing the wish list down to a few phenotypes is that the efficiency by which a trait can be improved is inversely related to the number of phenotypes that are incorporated into the selective breeding programme. Consequently, if one or two phenotypes are far more important than the others, the list should include only the one or two most important ones. The inclusion of traits that are not crucial will slow down the rate of improvement for the important ones. For this reason, most selective breeding programmes should try to improve only one or two phenotypes. Some programmes may include a third trait; few should incorporate more than that, and the only ones that should are those conducted by geneticists at research stations.
Once a farmer has pared his wish list to the one or two phenotypes that he would like to improve, he needs to determine how they will be defined and measured. Goals that cannot be precisely defined and phenotypes which are difficult to measure should be dropped. For example, every farmer wants to improve disease resistance, but what is disease resistance? Some may define it as “fish that do not get sick,” while others may define it as “fish that do not die.” There is a great difference in these definitions. If you define the trait as “does not get sick,” what does that mean? Does this mean that the fish were infected but exhibited no clinical signs of the disease, or does it mean that they never were infected? If the fish are grown in a pond, how will you be able to tell which fish were infected and which were not? Even “does not die” is not that precise, because so many variables enter into health management. Fish can die from non-infectious sources during a disease outbreak or over the course of a growing season. Because this trait is difficult to measure, it is a trait that should probably be avoided by most farmers. Furthermore, if resistance to a particular disease is heritable, it will be improved over time by what is called “domestication selection.” Domestication is the process by which the farm and the farmer's management selects for or against genes as a natural consequence of farming. Consequently, disease resistance is a trait that should be removed from most farmer's lists. Some advances are being made in selection for disease resistance; however, these breeding programmes are complicated and should be conducted by scientists at research stations.
Other traits that must be pared are those that a farmer wants to improve but that are difficult to measure because of the way the fish are raised. Farmers that feed fish with a pelleted ration want to improve feed conversion because, if this trait can be improved, the fish will convert feed more efficiently, which means that yields and profits will soar. But how does one determine feed conversions for individual fish? This can be accomplished only by raising fish in individual tanks or hapas, which would be prohibitively expensive. A farmer could use family selection to improve this trait, if he were able to raise dozens of families in hapas. Such a programme would be expensive, and improving feed conversion is not as important as improving growth rate. If they are needed, the development of selective breeding programmes to improve feed conversion should be left to geneticists who work at research stations.
Even traits that every farmer wants to improve and that will be incorporated into a selective breeding programme need to be accurately defined and measured. Every farmer wants to improve growth, but how should it be defined and how will it be measured? This is important, because it will determine the rate of progress that can be made via selection. Growth rate is usually defined as weight or as length at a given age, so the first question that must be answered is: Should growth be defined as weight or as length?
It is easy to accurately measure hundreds of fish to the nearest millimeter, and the fish are minimally stressed during the process. However, length includes head length and tail length. Fish with an overly long tail could be selected over heavier fish, and consumers buy their fish by the kilogram, not by the centimeter. Weight more accurately reflects how fish are bought and sold, but it is difficult to accurately weigh hundreds of fish to the nearest 0.1 g. Unless the farmer has access to an electronic scale, the process can be very tedious, and it often stresses the fish. Furthermore, the weight recorded for each fish includes water in the fish's mouth, faeces and food in its digestive tract, and head and viscera weight, so it too is subject to error.
Although it would be best to measure growth as weight, a large correlation exists between length and weight (the two are highly related-an increase in one means there is an increase in the other), so assessing growth by measuring length is a good approximation of assessing growth by measuring body weight. If a farmer wants to remove some of the error that can occur when growth is assessed by measuring length, he could take standard lengths instead of total length, which would negate the effect of tail length on selection.
If more than one person is going to measure fish, a standard method for measuring them must be determined and worked out in advance so that everyone will provide uniform measurements. Otherwise, the phenotypic values assigned to the fish (lengths) will be subject to human error. If only one person will measure the fish, the only requirement is that he measure all fish using the same technique.
If weight is improved by selection for length, weight is said to have been improved by “indirect selection.” This occurs because the two phenotypes are positively correlated (related genetically), so improving one will automatically improve the other. Because of this, selection to improve growth rate can often improve other traits, such as survival, disease resistance, and feed conversion. Breeders often exploit genetic correlations and use indirect selection to improve phenotypes that are difficult or expensive to measure by selecting for more easily measured phenotypes. For example, harvest weight in rainbow trout has been improved via indirect selection by selecting for fingerling weight; selective breeding programmes are being conducted to improve disease resistance via indirect selection by selecting for stress response or for cell membrane strength.
Another question that must be answered before growth rate can be improved is: At what age will growth be assessed? Fish growth is not constant. If it were, the age at which the measurement was taken would be relatively unimportant. It makes sense to measure fish when they are normally moved or harvested. For example, fish can be measured when they are transferred from fingerling ponds to grow-out ponds and when they are harvested for market. This is usually defined as measurement at a specific age. After a number of generations of selection, it might be defined as the time needed to reach market size. If fish are measured and selected at two ages instead of one, growth rate will be improved more rapidly.
The ability to precisely define the goal and to accurately measure the phenotype is crucial. If a farmer cannot perform these tasks, he should not conduct a selective breeding programme. If he conducts a selective breeding programme using imprecisely defined goals and measures the phenotype inaccurately, his breeding programme can decrease growth rate and may also prevent future improvements by culling the truly valuable alleles.
For example, selection for growth rate in some populations of Indian carps produced slower-growing fish because growth rate was imprecisely defined and measured inaccurately. These carps were cultured using a production system called “multiple batch” production. When this form of management is used, a pond is seined many times over a several-year period to continually remove market-sized fish. Fingerlings are often stocked in the pond to replace fish that are removed to ensure that fish can be continually harvested. After several years of continual production, the pond is drained because large fish that have escaped the repeated seinings adversely affect production.
When these carp ponds were drained, farmers and hatchery personnel saved the largest fish, because they defined growth rate as body size at draining, and measured it only when a multiple batch production pond was drained. Additionally, they saved these fish because they would produce more eggs than smaller brood fish.
Unfortunately, their definition of growth rate and the way the trait was measured (size when the ponds were drained) produced a selective breeding programme that reduced growth rate, because the select fish were actually the oldest fish and were are also slow-growing fish. They were the largest fish when the ponds were drained simply because they were experts at escaping a seine. Not only did this selective breeding programme produce shower-growing fish, it also selected for fish that were escape artists.
Once a farmer has quantified his goals and has determined how the phenotypes will be measured, he needs to determine what type of selective breeding programme he will use to achieve his goal. There are two basic types of selective breeding programmes: individual selection (also called “mass selection”) and family selection. In individual selection, family relationships are ignored, and comparisons are made among individuals. Individual fish are ranked in order, and the best become the select brood fish. In family selection, family relationships are of paramount important, and either family means are compared and ranked and whole families are either saved or culled, or individual rankings are made within each family and selection occurs independently within each family. The most efficient breeding programme is determined by the phenotype and how it will be measured, the biology of the fish, and by the trait's heritability. Individual and family selection will be discussed in greater detail later in this chapter.
A farmer needs to outline the plan he will use to achieve his goal. This includes the number of fish that will be spawned, the number of fish in each family that will be raised, the number of ponds that will be stocked, the stocking density, and the management programme that will be used to culture the fish.
Selective breeding programmes are expensive, so it is important to be able to accurately assess the effects of selection. The best way to determine this is to compare the phenotype's mean over time. To do this properly, the mean of the select population must be compared to that from an unselected control population. The reason the select population must be compared to a control population is that the mean is determined by both the population's genome (which you are trying to improve via selection) and by the environment. Techniques that are needed to create a control population and the way it is used to assess the results of selection will be discussed in a later section of this chapter.
Finally, a farmer must review his selective breeding programme at least once a year. He must evaluate how it is progressing and determine if there are ways to improve the programme. Conversely, he may decide to end the programme if the results indicate that the programme is not working or if the results are not worth the effort. Farmers often want to end one selective breeding programme and start another when they get frustrated, but this type of decision should be discouraged. If a farmer changes programmes every year or two, all he will do is spend money and accomplish nothing. On the other hand, if the programme is not working, it would be foolish to persist and spend money needlessly.
Once a farmer has decided to improve a quantitative phenotype by selection, he must choose the type of selective breeding programme that will be most efficient. There are two major types of selective breeding programmes: individual selection and family selection. Individual selection is simpler, requires less record keeping, and is less expensive.
In individual selection, all individuals are measured, and the decision to select or to cull a fish is based solely on that fish's phenotypic value. Each fish is compared to a value called the “cut-off value,” and fish whose phenotypic value is equal to or larger than the cut-off value are saved, while fish whose phenotypic value is smaller than the cut-off value are culled. The cut-off value is a pre-determined phenotypic value that is often expressed as the “top 10%” or “top 5%” or whatever value is desired. Fish that are saved become the first generation (F1) of select brood fish. The cut-off value and how it is determined is discussed in a later section of this chapter.
When the first generation of select brood fish are spawned, they produce the first generation of select fish, which is called the “F1 generation”; their offspring, in turn, are called the “F2 generation,” etc. When a farmer spawns the select brood fish he should allow them to mate among themselves at random or should pair them in a random manner, unless he wants to select for post-market growth rate or for maturity-related phenotypes. This process is then repeated in succeeding generations (Figure 19).
Environmental variables have a significant influence on the production of quantitative phenotypes. Even when a phenotype has a large heritability, the environmental component of phenotypic variance can be larger than the heritable component. If the environmental influence on phenotypic variance were the same for all fish, it would be of minimal concern during selection, as long as there is sufficient heritable variance to enable selection to work. Unfortunately, many sources of environmental variance have a differential effect on individuals or families and, when selection is used, a farmer must control these environmental variables or they will give some individuals or families an advantage. If this occurs, the select brood fish may be better because of an environmental advantage, not because they are genetically superior. If this happens, selection will not work.
For example, older fish are usually the largest fish in a population because they have had more growing days. It has been shown that an age difference as small as 24 hours can give the older fish a size advantage that they never relinquish, which means that selection will choose the older fish, not the genetically superior fish; consequently, if age-related size differences are not controlled, a selective breeding programme that is trying to improve growth rate would actually be trying to improve it by exploiting environmental variance (age) rather than additive genetic variance, and the programme would be a failure. Thus, if it is possible, all fish should be spawned on the same day. If this is not possible, then the population should be split into cohorts of equal-aged fish, and selection can occur independently in each cohort. After selection, the select brood fish from each cohort can be mixed.
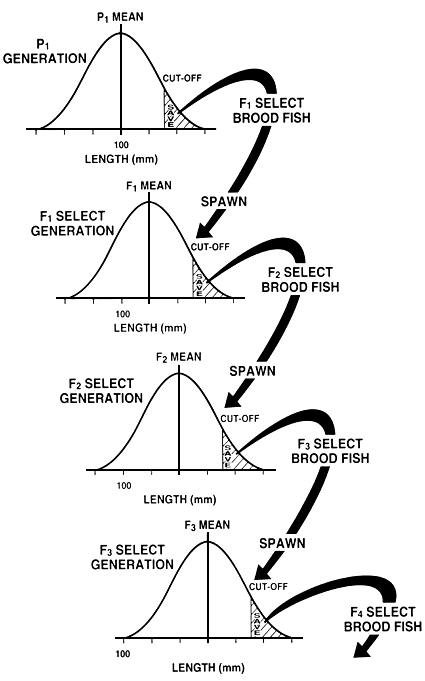
Figure 19. Schematic diagram of individual selection to improve growth rate by selecting for increased length. The figure shows four generations of selection and shows how length can be improved over time.
Other factors that need to be controlled are female age and female size and management differences among the fingerling or the grow-out ponds. For example, if each family is stocked in a single pond, individual selection will be unable to differentiate the fish that are largest because they are genetically superior from those that are largest because they were grown at the lowest density or had the most food. If a farmer does not control these variables, the largest fish may all come from one family, and they may be largest because of environmental variance. If this is the case, no progress can be made by selection.
Even seemingly insignificant environmental variables such as feed particle size can be a major sources of phenotypic variance. Studies with common carp have shown that if feed particles are improperly sized, some individuals will grow significantly faster than the rest of the population; the size advantage that these fish have is not exploitable in a breeding programme, because it is an environmental advantage, not a heritable one.
When conducting a selective breeding programme, a farmer must control all environmental factors that can give individuals or families an advantage. If these variables are not controlled, selection will either be less effective than it is for others who are conducting similar programmes or it will not work. Since selective breeding programmes require considerable effort and time, the inability to control these variables will be costly.
In order to create a population of select brood fish, a farmer needs to decide where to place the cut-off value. This is usually expressed as a percentage, such as the top 10%. It can be expressed as a minimum size, such as 500.0 g, but this can be risky if no fish reaches the cut-off value during a bad year.
A cut-off value is usually determined just before selection will occur, and it is usually based on saving a pre-determined percentage of the population. The easiest way to determine the cut-off value and the least stressful for the fish is to measure a random sample of 100–200 fish. Once these measurements are determined, they are ranked, and the value that corresponds to the desired percentile is the cut-off value. For example, if the top 10% will be saved, the cut-off value is the 90th percentile. If 200 fish are measured, you simply count down 20 measurements from the largest phenotypic value after they have been ranked and that value is the cut-off value (Figure 20).
Sexual dimorphism: One final refinement of the selection process is necessary. A farmer must determine if selection will be conducted in the population as a whole or separately in both sexes. This is an important decision, because many species exhibit sexual dimorphism in that one sex grows to a larger size or grows faster. If the species does not exhibit sexual dimorphism or if selection will occur before sexual dimorphism begins, then a single cut-off value can be created for the entire population. If the species exhibits sexual dimorphism, separate cut-off values must be created for each sex, or the select population may be composed of only the larger sex (Figure 21).
Many species exhibit sexual dimorphism for body size. All important cultured species of tilapia exhibit pronounced sexual dimorphism. After tilapia are a few months old, males grow much faster than females, and can be twice as large after 1 year. This is why tilapia farmers want to grow all-male populations rather than all-female populations in their effort to control reproduction. Common carp and Chinese carps also exhibit sexual dimorphism for body size, in that the females grow to a larger size; however, the size difference in carps does not appear until after maturity, which means that selection for pre-maturity growth rate in carps requires only a single cut-off value.
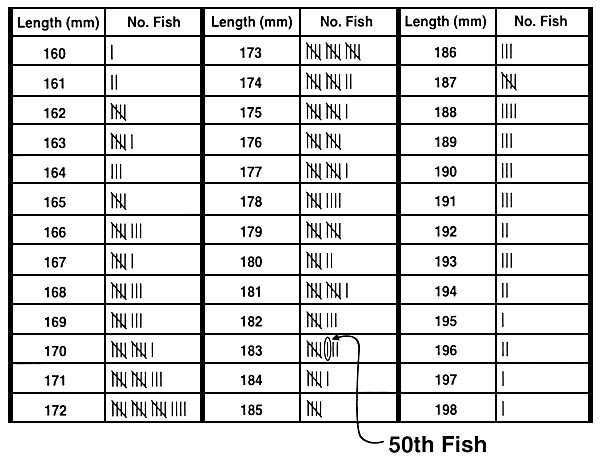
Figure 20. A quick and simple way to determine a cut-off value. The goal of this selective breeding programme is to increase 10-month length by selecting the top 20% of the population. To determine the length that corresponds to the 80th percentile, a sample of 250 ten-month-old fish was obtained from a pond that was stocked with 5,000 fish that were produced on the same day. Each fish in the sample was measured to the nearest millimeter, and the phenotypic values were entered onto this data sheet. The cut-off value was determined by counting down from the largest fish (198 mm) to find the fish that corresponds to the 80th percentile. Because the goal is to select the top 20%, the length of the 50th fish will give the cut-off value (50 fish is 20% of 250 fish). The 50th fish has a value of 183 mm, so the cut-off is 183 mm. Fish >183 mm will be saved and will become the select brood fish, while fish < 183 mm will be culled.
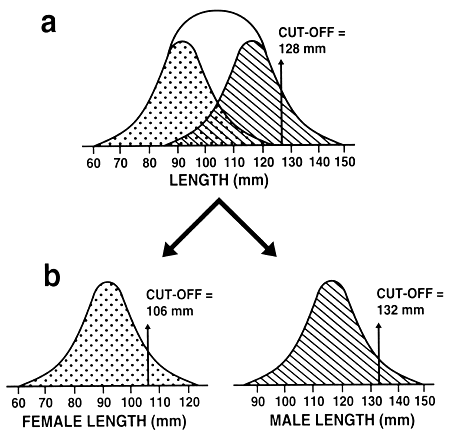
Figure 21. The effect of sexual dimorphism on selection for size. Graph a shows length distribution in a population of fish where males grow to a larger size than females: the length distribution of males in the population is shown by the striped graph, and that exhibited by the females is shown by the dotted graph. In graph a, a single cut-off value (128 mm) was used in a selective breeding programme to improve length. Because of sexual dimorphism, all select brood fish were males. This means the farmer either will be unable to produce any offspring or will have to obtain and spawn unselected females. Graph b shows how selection should occur in species that exhibit sexual dimorphism. Separate cut-off values must be determined for each sex, and selection must occur independently for males and for females. Graph b shows that the farmer selected the best males by establishing a male cut-off value of 132 mm and selected the best females by establishing a female cut-off value of 106 mm.
If selection will be conducted independently in the two sexes because of sexual dimorphism, the procedure that was outlined to determine a cut-off value (Figure 20) must be conducted separately for males and for females. If selection will be conducted for each of several cohorts the process needs to be conducted within each cohort.
In general, the easiest and usually the most efficient programme is one that selects for a single phenotype. As was mentioned previously, the efficiency with which each phenotype' can be improved is inversely related to the number of phenotypes that are incorporated into a selective breeding programme.
If a farmer wants to improve more than one phenotype, he can use either tandem selection, independent culling, or a selection index. Tandem selection is inefficient, and it is not recommended. A selection index is too sophisticated for most farmers, but aquaculturists who work at research stations and hatchery managers who work at fingerling production centers might wish to use it. Farmers who wish to select for two, or at most three, phenotypes should use independent culling.
Tandem selection: In tandem selection, you first spend several generations selecting for one phenotype; you then stop selecting for that trait, and start a new breeding programme and select for the second phenotype. Basically, this is a two-step selective breeding programme designed to first improve one phenotype, and after a while you quit and suddenly change directions and begin a second selective breeding programme to improve another phenotype. If improving the first phenotype is important and if the selective breeding programme is working, it would be foolish to abandon it. For this reason and also because it takes so long to try and improve two phenotypes using this back-to-back procedure, tandem selection should not be used if a farmer wants to improve two or more traits. It is very inefficient.
Independent culling: Independent culling is probably the easiest selective breeding programme that a farmer can use to improve two or three phenotypes. Independent culling is a breeding programme where a farmer selects simultaneously for two or more phenotypes by establishing cut-off values for each phenotype independent of the other(s), and each fish must reach or exceed all cut-off values in order to be saved. A fish which fails one cut-off value is culled. This type of breeding programme is illustrated in Figure 22.
For example, say a farmer wants to improve both growth rate, by selecting for length, and body conformation, by selecting for body depth at the first dorsal fin spine. The procedure that is used to establish the cut-off values is the same as that outlined earlier. The farmer will either establish pre-determined phenotypic values or will select the top 10% or top 20%, etc. If he establishes pre-determined percentiles, he determines the cut-off values that correspond to these percentiles by measuring a random sample of 100–200 fish and by discovering what those values are, as was illustrated in Figure 20. In this example, the farmer has established cut-off values of 243 mm for length and 130 mm for body depth at the first dorsal fin spine. Once both cut-off values are established, the farmer measures each fish, and only those that meet or exceed both cut-off values will be saved. In this breeding programme, the decision to save or to cull these six fish will be:
| Fish | Length (mm) | Depth (mm) | Save/Cull |
| 1 | 254 | 129 | cull |
| 2 | 243 | 130 | save |
| 3 | 241 | 138 | cull |
| 4 | 240 | 120 | cull |
| 5 | 280 | 129 | cull |
| 6 | 250 | 131 | save |
Although independent culling is more efficient than tandem selection and it is easy to conduct, this type of breeding programme has two liabilities. The first is that when you select simultaneously and independently for two phenotypes, you could end up with very few select fish. For example, if you select for two phenotypes and the cut-off value is the top 10% for both traits, only 1% of the population will be saved (0.1 × 0.1 = 0.01). If you add a third phenotype and the cut-off value for it is also at that level, only one fish out of every thousand will be saved. The severity of this type of selection can be seen in Figure 22.
The severe restriction in the number of fish that are able to meet or exceed all cut-off values can lead to two problems: If this occurs, you may not be able to produce enough select fingerlings for grow-out the following season. Even worse, high levels of inbreeding could be produced after 1–2 generations, which could negate much of the gains made by selection.
The problem created by independent cut-off values can be solved by deciding in advance how severe selection will be; that is, what percentage of fish will be selected. Once this is determined, you back-calculate the cut-off percentages that are needed to produce this value. For example, if you want to retain 15% of the population and will select for two equally important phenotypes, simply take the square root of 0.15, and that tells you to select the top 39% for both phenotypes (0.39 × 0.39 = 0.15). If you want to put more emphasis on one phenotype, simply establish a higher cut-off value (in terms of percentiles) for that trait and then adjust the cut-off value for the second downwards. For example, if you want to save 10% of the population, you can have the cut-off values at the 25th and 40th percentiles for two phenotypes (0.4 × 0.25 = 0.1).
A second draw-back that occurs as a result of independent culling is the fact that you must cull fish that are outstanding in one phenotype. For example, fish number 5 in the example given above was culled despite the fact that it far exceeded the length cut-off value. This problem can be circumvented by using modified independent culling. In modified independent culling, fish that meet or exceed both cut-off values are saved, and fish that exceed one cut-off value but that are just under the cut-off value for the second phenotype are also saved (Figure 23).
Because of the ease with which they can be conducted and because the record keeping is not that cumbersome, independent culling or modified independent culling are the selective breeding programmes that most farmers should use if they want to simultaneously improve two or perhaps three phenotypes.
Selection index: A selection index is the most efficient selective breeding programme that can be used to improve two or more phenotypes. Unfortunately, it is also more sophisticated and more expensive than independent culling. This type of selective breeding programme should only be used by aquaculturists who work at research stations or by hatchery managers who work at fingerling production centers. Farmers and most aquaculturists should use independent culling if they want to improve two phenotypes. A selection index is really only needed if three or more phenotypes will be improved simultaneously.
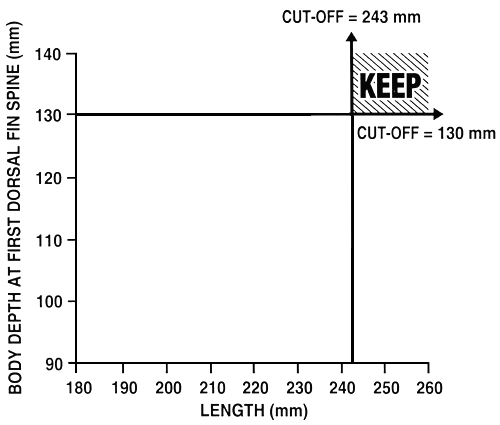
Figure 22. Schematic diagram of independent culling. In this selective breeding programme, a farmer is selecting for increased growth rate (by selecting for length) and is also trying to improve body conformation (by selecting for body depth at the first dorsal fin spine). He has established independent cut-off values of 243 mm for length and 130 mm for body depth at the first dorsal fin spine. Fish which meet or exceed both cut-off values are saved and become the select brood fish; all other fish are culled. The graph illustrates the relative percentages of fish that will be saved (shaded portion) and culled (unshaded portion) with this type of selective breeding programme.
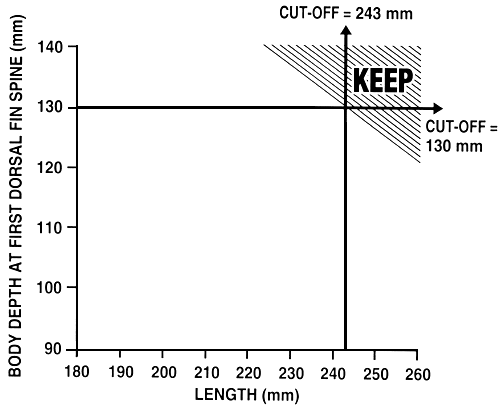
Figure 23. Schematic diagram of modified independent culling. In this selective breeding programme, a farmer is selecting for increased growth rate (by selecting for length) and is also trying to improve body conformation (by selecting for body depth at the first dorsal fin spine). As was the case for the breeding programme illustrated in Figure 22, the farmer has established independent cut-off values of 243 mm for length and 130 mm for body depth at the first dorsal fin spine. In this case, not only will the farmer select fish that meet or exceed both cut-off values, he will also select fish that exceed one cut-off value and that are just under the cut-off value for the other phenotype (the shaded portion of the graph). All other fish are culled. Modified independent culling allows you to select a greater number of fish, and individuals which have a truly outstanding phenotypic value for one trait do not have to be culled.
A selection index is a selective breeding programme where two or more phenotypes are simultaneously evaluated and an overall numerical value is assigned to each fish. The fish are then ranked by these numerical values. The rankings are established so that a fish that is at the 50th percentile for every phenotype receives an I value of 100.0. Consequently, fish that have I values > 100 are considered to be above average, while those with I values <100 are considered to be below average. The ultimate goal of every large-scale sophisticated selective breeding programme is to develop a selection index.
A selection index requires heritabilities, genetic correlations among the phenotypes, and the economic importance of the phenotypes; unfortunately, this information is not known for most cultured populations of food fish. The need for this information can be circumvented by modifying the selection index and by creating what are called “importance factors” for each phenotype.
The techniques that are used to create a selection index using importance factors are outlined in Table 11. The index in Table 11 is designed to improve three phenotypes: length at 12 months, body depth at the first dorsal fin spine, and dressing percentage (as approximated by the ratio: trunk length [length from the back of the head to the end of the caudal peduncle]/total length). Once an I value is computed for each fish, the fish are ranked by I values and the top 10% or top 15% or top 20% are selected, while the remainder are culled. A selective breeding programme that uses the selection index derived in Table 11 is outlined in Figure 24.
This type of selective breeding programme requires far more labour than independent culling. In independent culling, a farmer assigns a cut-off value for each phenotype (usually based on a sample of 100–200 fish) which will enable him to quickly save or cull each fish. In a selection index, all phenotypes must be measured for each fish, and the fish must be given an individual tag or mark and placed in a tank or hapa until all fish are measured. After all fish are measured, the fish are once again identified and either saved or culled, based on their I values. Not only is this process labour intensive, but the extra handling stresses the fish. For all these reasons, if a farmer wants to improve two or perhaps three phenotypes, he should use either independent culling or modified independent culling.
Family selection differs from individual selection in that the decision to save or to cull fish is conducted at the family level, and individual phenotypic values are important only as they relate to their family's mean. Family selection is most often used when individual selection is inefficient because the heritability of the phenotype is small (generally <0.15). When heritability is small, the heritable component of phenotypic variance is small, which means that most of the measurable differences among individuals are due to non-heritable sources of variance. By selecting at the family level, a significant portion of environmental variance can be negated, which makes it easier to identify genetic differences and to select the fish that are best because of heritable variance.
Family selection is also used when environmental sources of variance are uncontrollable, which can make improvement by individual selection difficult or impossible. For example, if fish cannot be spawned synchronously and if they usually spawn over a several-week to several-month period, family selection is the type of selection that is often used. This approach to selection can control age-related size differences.
Table 11. Techniques that can be used to create a selection index, using importance factors.
| Step 1 | Determine the phenotypes that will be entered into the selection index. In this example, a selection index will be created to improve three phenotypes: | ||
| 1) | length at 12 months (mm); | ||
| 2) | body depth at the first dorsal fin spine (mm); | ||
| 3) | dressing percentage (as approximated by the ratio: trunk length [length from the back of the head to the end of the caudal peduncle]/total length). | ||
| Step 2 | Determine the importance factors for the phenotypes. Importance factors are determined by using the following formula: | ||
| Importance factor (I) = relative importance of the phenotype/population mean | |||
| Step 2a | Determine the relative importance of the phenotypes. This is determined by assigning an arbitrary value to each phenotype. These values range from 1 to 99% (and total 100%) and represent the portion of selection pressure that will be assigned to a phenotype (if you assign a value of 0% to a phenotype, it means that you will not try to improve it, so it is dropped from the programme; conversely, if you assign a value of 100% to a phenotype, it means that you want to improve only that phenotype, so all other phenotypes will be automatically dropped from the breeding programme). | ||
| The following relative importance values are assigned: | |||
| Phenotype | Relative importance | ||
| Length | 60% | ||
| Body depth | 30% | ||
| Dressing percentage | 10% | ||
| Step 2b | Determine the mean for each phenotype. | ||
| The farmer measures a random sample of 200 fish and determines the following means: | |||
| Phenotype | Mean | ||
| Length | 195 mm | ||
| Body depth | 100 mm | ||
| Dressing percentage | 55% | ||
| Step 2c | Calculate the importance factor for each phenotype using the formula presented at the beginning of Step 2. The importance factor for each phenotype is: | ||
| Ilength (IL) = 60%/195 mm - 0.3076923 Ibody depth (IB) = 30%/100 mm = 0.3 Idressing percentage (ID) = 10%/55% = 0.1818182 | |||
| Step 3. | Create the selection index that will be used to determine the breeding (I) value for each fish. The value for each fish is determined by entering its phenotypic values and the importance factors into the following formula: | ||
| Ifish = (IL)(length) + (IB)(body depth) + (ID)(dressing percentage) | |||
| Step 4. | Determine the breeding value for a fish that has the following phenotypic values: length = 201 mm; depth = 119 mm; dressing percentage = 54%: | ||
| I = (0.3076923)(201 mm) + (0.3)( 119mm) + (0.1818182)(54%) I = 107.364 | |||
Family selection is the only type of breeding programme that can be used when an animal must be killed in order to determine its phenotype. For example, if you want to improve dressing percentage or to reduce visceral fat content, you must kill the fish to obtain an accurate measurement. Once you kill a fish, you cannot spawn it (unless you are able to cryopreserve gametes). Consequently, you must use family selection to improve such phenotypes.
There are two major types of family selection: between-family selection and within-family selection. In between-family selection, the mean values for each family are determined, and the mean values are then ranked. Whole families are then either saved or culled (Figure 25). When using this type of selection, a pre-determined minimal cut-off value is usually not determined. Instead, the farmer decides to save the best 10 or 15 or 20 families.
The whole family does not have to be saved. If family size is large, a random and equal sample from each select family can be saved. The sample chosen from each family must be random, or the breeding programme will not be between-family selection. The farmer cannot purposely choose the best fish from each of the select families. Even if entire families will be kept, family size of the select families should be equalized, or one family will make a greater contribution to the select breeding population.
As was the case with individual selection, sexual dimorphism can complicate selection to improve growth rate. If a species exhibits sexual dimorphism, the males and females within each family must be weighed or measured separately. Selection can then occur in one of two ways: Once the average values are known for each sex, the two average values can then be averaged (half the contribution by each family to the next generation will come from the males, and half will come from the females), and this overall average value is used to save or to cull the families. Alternatively, selection can be done separately for each sex. If this is done, it is likely that the males in some families will be culled while its females are saved, and vice versa.
In order to conduct family selection, a farmer must be able to assign fish to individual families. This can be accomplished in two ways: First, each family can be cultured in separate tanks, hapas, or ponds until they reach a size where they can receive family marks, brands, or tags. Once marked, the fish can be grown communally (mixed and grown together); at harvest, the fish must be separated by family in order to conduct selection. The second method is to culture the fish in separate tanks, hapas, or ponds from the moment eggs are fertilized until selection occurs. Even after selection has occurred, if fish cannot be marked, they often must be maintained in separate units. If fish can be marked, the select brood fish can be stocked communally until it is time to spawn them.
Between-family selection is more expensive than individual selection, because it requires more facilities and more labour. It also requires more record keeping. If the fish can be marked and grown communally, the programme costs will be far less than if each family has to be cultured separately.
Step 1. Determine the phenotypic values for every fish in the population. In this example, we will only determine them for 10 fish:
| Fish | Length (mm) | Body depth(mm | Dressing percentage |
| T-l | 198 | 103 | 54 |
| T-2 | 210 | 110 | 55 |
| T-3 | 180 | 108 | 57 |
| T-4 | 195 | 100 | 55 |
| T-5 | 197 | 101 | 56 |
| T-6 | 190 | 98 | 54 |
| T-7 | 188 | 97 | 53 |
| T-8 | 195 | 102 | 57 |
| T-9 | 185 | 95 | 52 |
| T-10 | 199 | 102 | 55 |
Step 2. Determine the I value for each fish using the importance factors derived in Table 11:
| IT-1 | = | (0.3076923)(198) | + | (0.3)(103) | + | (0.1818182)(54) | = | 101.641 |
| IT-2 | = | (0.3076923)(210) | + | (0.3)(110) | + | (0.1818l82)(55) | = | 105.777 |
| IT-3 | = | (0.3076923)(180) | + | (0.3)(108) | + | (0.1818182)(57) | = | 98.148 |
| IT-4 | = | (0.3076923)(195) | + | (0.3)(100) | + | (0.1818182)(55) | = | 100.000 |
| IT-5 | = | (0.3076923)(197) | + | (0.3)(101) | + | (0.1818182)(56) | = | 101.097 |
| IT-6 | = | (0.3076923)(190) | + | (0.3X98) | + | (0.1818I82)(54) | = | 97.680 |
| IT-7 | = | (0.3076923)(188) | + | (0.3)(97) | + | (0.1818182)(53) | = | 96.583 |
| IT-8 | = | (0.3076923)(195) | + | (0.3X10²) | + | (0.1818182)(57) | = | 100.964 |
| IT-9 | = | (0.3076923)(185) | + | (0.3)(95) | + | (0.1818182)(52) | = | 94.878 |
| IT-10 | = | (0.3076923)(199) | + | (0.3)(102) | + | (0.1818182)(55) | = | 101.831 |
Step 3. Rank the fish by I values. Select or cull the fish, based on these values. In this example, the top 20% of the population will be saved:
| T-2 | = | 105.777 | → | SAVE | ||
| T-10 | = | 101.831 | ||||
| CULL | ← | T-l | = | 101.641 | ||
| T-5 | = | 101.097 | ||||
| T-8 | = | 100.964 | ||||
| T-4 | = | 100.000 | ||||
| T-3 | = | 98.148 | ||||
| T-6 | = | 97.680 | ||||
| T-7 | = | 96.583 | ||||
| T-9 | = | 94.878 | ||||
Figure 24. Schematic protocol needed to conduct a selection index. A preliminary step is to determine the importance factors, which are determined from phenotypic means and the relative importance of each phenotype. The methods used to calculate the importance factors for the three phenotypes are described in Table 11. The first step in determining a fish's I value is to determine the phenotypic values for every fish in the population. In this example, only 10 fish are presented. Step 2 is to calculate the I value for every fish. Step 3 is to rank the fish by their I values and to select or to cull fish, based on the I values. In this example, the top 20% of the population was saved, so fish T-2 and T-10 were saved because they were the top two fish; the rest were culled. Note that fish T-4, which had phenotypic values that were the same as the population means, had an I value of 100.0; by definition, such a fish must have an I value of 100.0.
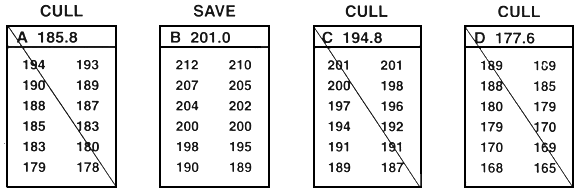
Figure 25. Schematic diagram of between-family selection. Family means are compared, and selection occurs at the family level. Either whole families (or random and equal samples) are saved or whole families are culled. In this example, the goal was to improve growth rate by selecting for length. This was accomplished by selecting the top 33% of the families (only 12 families are included in this example). To do this, family means were ranked, and the families with the four largest mean lengths were saved (families B, F, G, and L). Every fish in the other eight families were culled. In this example, 12 fish from each family were measured to the nearest millimeter (the values are listed below the letter that identifies the family. In reality, 30–100 fish should be measured. The value next to the letter that identifies the family is the family mean. This example assumes that sexual dimorphism does not exist. If sexual dimorphism exists, the means for both sexes within each family must be determined. Selection can then proceed, based either on the average values of the two sexes, or it can occur independently for males and for females.
Interestingly, between-family selection can reduce some of the labour needed to improve growth rate and can also enable a farmer to easily improve growth rate by selecting for weight. Because between-family selection is based on family means, it is not necessary to determine individual values if a farmer selects for weight. The fish from each family can be batch weighed, and the family mean can be obtained by dividing that value by the number of fish were weighed.
If each family is raised in a separate grow-out pond or tank, you must replicate each unit at least three times and then determine the overall average of the three units before selecting or culling families. If each family is raised in only one pond or tank, it is not possible to determine if the family's mean phenotypic value represents that family's breeding value or if it represents the quality of the pond or tank. Every one who has ever raised fish knows all too well that ponds and tanks have individual personalities. Some ponds are “good” ponds while others are “bad” ponds. Some ponds always have good water quality, have good algal blooms, and produce large yields; others are cursed with dissolved oxygen problems, poor algal blooms, and low yields. If each family is grown in a single pond, differences among family means may be due to algal populations in the ponds or to other environmental factors, rather than to the families' heritable variance. If most of the differences among family means are due to pond-to-pond differences, selection will be ineffective.
Farmers must strive to grow each family under uniform conditions. One environmental factor that a farmer can and must control when conducting between-family selection is stocking density. Each family must be cultured using the same stocking density, or differences among family means will be partly due to density differences rather than to heritable differences.
Because selection is based on family means and whole families are either saved or culled, selection can cull some of the fish with the best phenotypes. For example, in Figure 25, family K was culled because it had the smallest family mean. Because the entire family was culled, the largest fish in the population was culled along with its sibs. Conversely, this type of selection also incorporates runts into the population of select brood fish. For example, in Figure 25, family G was saved because it had the second largest mean. Because the entire family was saved, the smallest fish in the population became a select brood fish.
Even though it may seem foolish to exclude some fish that would have been saved and to include some that would have been culled if individual selection were used, this type of selection can be very effective. By basing selection on family means, you neutralize some of the environmental sources of phenotypic variance. It may be argued that the large fish in family K was large simply because of some environmental advantage that enabled it to receive more than its fair share of food. It is tempting to bend the rules of between-family selection and to save some of the culls and to cull some of the select brood fish, but this should not be done. No single approach to selection is perfect and frustration-free, but if you base a selective breeding programme partially on personal prejudice and whimsy rather than genetics, you will decrease its effectiveness.
Within-family selection is a second type of family selection. In within-family selection, each family is considered to be a temporary sub-population, and selection occurs independently within each family (Figure 26). When fish are measured to determine which will be saved and which will be culled, the fish in each family are ranked, and the best fish are saved from each family. When conducting this type of selection, a farmer usually saves the best 10 or 15 or 20 fish from each of 15 or 20 or 30 families. If sexual dimorphism exists, selection must be conducted independently for each sex, and a farmer saves the best 10 or 15 or 20 males and the best 10 or 15 or 20 females from each family.
In Figure 26, the top four fish were saved from each family. In theory, you save or cull the fish in each family based on the family mean, but you do not need to determine the family mean in order to conduct within-family selection. If you measure and rank every fish in each family (or every fish in a random sample of 30–100 fish from each family), you simply save the pre-determined number.
Because selection occurs independently in each family, fish that are saved from one family might be smaller than many of the fish that were culled from another family. For example, in Figure 26, three of the fish that were saved from family K are smaller than many of the fish that were culled from other families. Conversely, Figure 26 demonstrates that outstanding fish from a family can be culled if they fall below that family's cut-off value (number saved).
As was the case with between-family selection, the culling of large fish and the inclusion of smaller fish into the population of select brood fish can be frustrating, but a farmer should resist the temptation to save or to cull some fish because of personal prejudice. When using within-family selection, it is inevitable that select fish from some families will be smaller than many of the culls from others. In fact, it is expected. This is because within-family selection is usually used when there is a major uncontrollable source of environmental variance that is felt at the family level but not at the individual level, such as spawning date or age of female. By subdividing the population into a large number of families and by then selecting within each family, these environmental factors are neutralized (they are the same for all fish within a family), and they do not influence phenotypic expression and selection.
Research with tilapia has shown that, for the most part, individual selection to improve growth rate has been ineffective for a number of reasons, one of which is the inability to synchronously spawn tilapia. Research has suggested that because tilapia spawn over a several-month period, within-family selection is the selective breeding programme that is needed to improve growth rate because it can neutralize the influence of spawning date on size.
As was the case with between-family selection, a farmer must be able either to mark the families or grow them in individual grow-out units. However, unlike between-family selection, the families do not have to raised in replicate grow-out units because the fish will be compared only within a family (only with fish grown in the same grow-out unit). Because no between-family comparison will be made, environmental differences among ponds will not influence the selection process. Consequently, each family can be raised in a single pond or tank, which means the grow-out aspects of within-family selection are far cheaper than those associated with between-family selection.
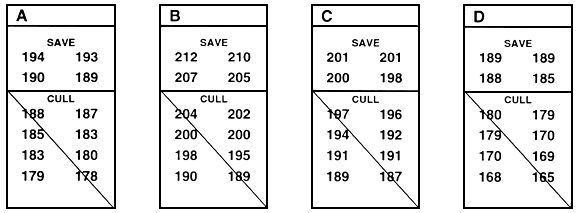
Figure 26. Schematic diagram of within-family selection. This type of selection assumes that each family is a temporary sub-population, and selection occurs independently within each family. In this example, the goal was to improve growth rate by selecting for length. This was accomplished by selecting the top four fish from each family. The rest of the fish were culled. In this example, 12 fish from each family were measured. In reality, 30–100 fish should be measured, and the best fish should be chosen from that sample. Individual lengths (in millimeters) are given below the letter that identifies the family. This example assumes that there is no sexual dimorphism. If sexual dimorphism exists, selection would occur independently in males and females and, in this example, the top two males and the top two females from each family would be saved.
It is possible to conduct within-family selection in a single pond. If fish can be marked, fish can be stocked communally after receiving family marks. At harvest, fish from each family must be separated and selection can proceed as described. Alternately, if a large number of hapas can be placed in a pond, each family can be raised in a single hapa. The only requirement for this is that growth rate in hapas must be similar to that which occurs in ponds.
One technique that can be used to resolve some of the frustration that occurs when you use either between-family or within-family selection is to combine them into an integrated two-step breeding programme (Figure 27). In this breeding programme, between-family selection is first used to select the best families. Within-family selection is then used to choose the best fish from each of the select families. If this combination is used, the fish must be grown as described for between-family selection, because selection is first done between families. When between-family and within-family selection are combined, all small fish should be culled, so the population of select brood fish will contain no runts. Some large fish will be culled during the between-family portion of the breeding programme but, as was described earlier, their large size may be non-heritable.
Once family selection has been used to create the population of select brood fish, offspring can be produced using either of two mating protocols. The first and simplest is to randomly spawn the select fish. The second, and one that is often used, is to mate the males from family 1 to the females from family 2, mate the males from family 2 to the females from family 3, mate the males from family 3 to the females from family 4… , and mate the males from the last family to the females from family 1. This type of mating scheme (called “rotational mating”) is done to prevent or minimize inbreeding. In the second generation, the matings are staggered (males from family 1 × family 2 are mated to females from family 3 × family 4, etc.), and so on in succeeding generations.
As can be imagined, this requires that the select brood fish be marked, requires the use of many spawning ponds or tanks, and also requires considerable record keeping. Although this type of mating is desirable for a large-scale commercial breeding programme, it is not necessary for medium-scale aquaculture. Random mating of the select brood fish will suffice.
Selective breeding programmes are expensive, so it is important to be able to accurately assess the results of selection. The best way to determine this is to compare the phenotype's mean over time to an unselected control population. There are other techniques that can be used to assess the results of selection, but they either require the breeding and maintenance of another select population (selected in the opposite direction) or require the use of sophisticated statistics.
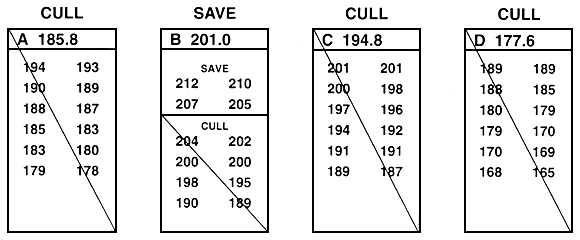
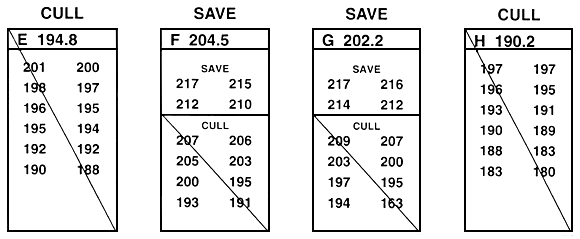
Figure 27. Schematic diagram of a selective breeding programme that combines between-family and within-family selection. This breeding programme is a two-step process. In this example, the goal was to improve growth rate by selecting for length. The value next to the letter that identifies each family is the mean (in millimeters); individual lengths are given below the letter. The first step is to conduct between-family selection; the second is to conduct within-family selection on the select families. In this example, in the initial step, the top four families (B, F, G, and L) were saved by between-family selection. Then the top four fish in families B, F, G, and L were saved by within-family selection. All other fish were culled. As was the case with Figures 25 and 26, this example assumes that there is no sexual dimorphism. If sexual dimorphism exists, it is handled as was described in Figures 25 and 26. This two-step selection programme creates a population of select brood fish that are the best fish from the best families.
The reason why the select population must be compared to a control population is that a population's phenotypic mean is determined by both its genome (which you are trying to improve via selection) and by the environment. If the weather during a growing season is unusually cool or cloudy; if a feed mill unknowingly uses poor-quality fish meal in their feed; or if a farmer increases stocking rate from, say, 4,000/ha to 8,000/ha, the mean weight of the select population can either go down or stay the same because of the adverse environmental factors. If all you have is the mean weight of the select population, you would compare it to the mean weight of the previous generation and would conclude that selection was not working. This decision might be incorrect. Conversely, no genetic improvement may occur as a result of selection, but the mean weight may increase because the weather is exceptionally good, because the feed mill produces a better quality ration, or because a farmer acquires better management skills. If all you have is the mean weight of the select population, you would compare it to the mean weight of the previous generation and would erroneously conclude that selection was improving growth rate.
Unless there is a control population, there is no way to determine if your conclusion is correct. Mean weight should increase with time as a farmer acquires better handling skills and through domestication, but unless there is a control population there is no way to determine what percentage of the increase was due to selective breeding and what percentage was due to improved management skills, etc.
At a major fish hatchery, the F1 control brood fish can be a random sample that was obtained from the P1 generation (the original population) before selection occurred (Figure 28). Obtaining a sample of fish from around the P1 generation's mean is another way of obtaining F1 control brood fish. F1 control brood fish are maintained at the hatchery and cultured using the same management programme that is used to culture the F1 select brood fish. The brood fish in the two populations must be treated, managed, and spawned identically. Their offspring must be cultured identically, or with as few differences as possible; differences in culture techniques can influence the phenotype, which will make it difficult to accurately assess the results of selection. The only exception is that in subsequent generations (F2, etc.) brood fish in the control population are chosen in a random manner each generation from the control population, while the select brood fish are chosen from the select population.
Another way to produce a control population is to maintain the P1 brood fish and respawn them for several generations and use their offspring as the control population. The only liability of this approach would be if the age and size of the females had a significant effect on growth of the offspring. This is often the case with fish, but when it occurs, the effects are usually gone 20–180 days after hatching. If selection occurs before such effects are gone, then this approach should not be used to produce the control population.
The creation and maintenance of a control population is the same for both individual and family selection. Different processes are not needed.
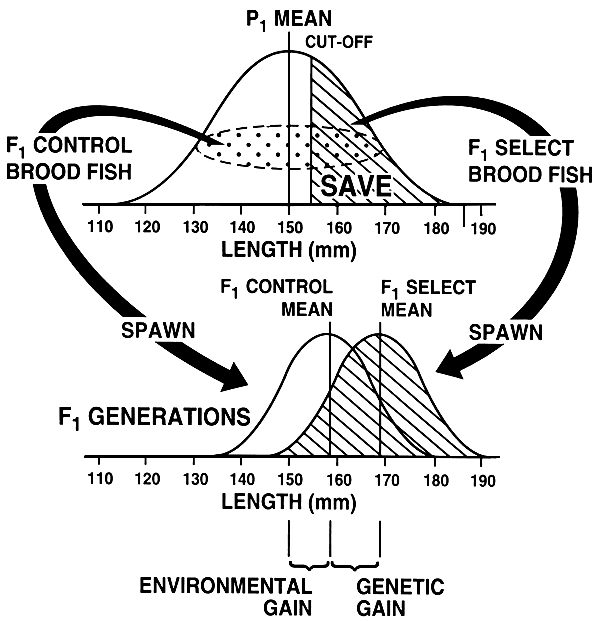
Figure 28. A control population is needed in order to assess gains that have been made via selection. In this example, the P1 generation had a mean length of 150 mm. Prior to selection a random sample of the population was obtained to create the F1 control brood fish (the dotted portion of the curve). After the F1 control brood fish were obtained, the top 30% of the population was selected (cut-off = 155 mm). Both the F1 select and F1 control brood fish were managed identically and were spawned when mature; this produced the F1 generations. Both the F1 select and F1 control generations were grown using identical management programmes. When the F1generations were harvested, the F1 select fish averaged 169 mm, and the F1 control fish averaged 159 mm. Had there been no control, the results would have suggested that selection increased mean length from 150 to 169 mm, a gain of 19 mm. However, the F1 control generation reveals that a significant portion of that 19-mm improvement was environmental. The mean of the F1control fish was 159 mm, which means that the environmental gain was 9 mm (159 mm - 150 mm); consequently, the genetic gain was 10 mm (169 mm - 159 mm).
The creation and maintenance of a control population is the best way to evaluate the results of selection, but it is expensive in terms of time, space, and money. Most farmers do not want to or are unable to maintain a control population, so what should they do? They can compare the mean yield or mean size of their select fish to those grown on a neighbour's farm or to those grown at a government hatchery. If this plan is used, a farmer should carefully evaluate the management plans used at various farms and at government hatcheries and try to choose one that approximates what he uses. He should also choose a farmer or hatchery manager who will cooperate and who is likely to be in business for the next 10 years.
Table 12. How to use a control population to assess the results of selection.
| Given: | mean length of the P1 generation = 150 mm | |||
| mean length of the F1 select generation = 165 mm | ||||
| mean length of the F1 control generation = 159 mm | ||||
| Total improvement is calculated as follows: | ||||
| Total improvement | = (mean length of F1 select generation - mean length of P1 generation) | |||
| = 165 mm - 150 mm = 15 mm | ||||
| Environmental gain is calculated as follows: | ||||
| Environmental gain | = (mean length of F1 control generation - mean length of P1 generation) | |||
| = 159 mm - 150 mm = 9 mm | ||||
| Genetic gain is calculated as follows: | ||||
| Genetic gain | = (mean length of F1 select generation - mean length of F1 control generation) | |||
| = 165 mm - 159 mm = 6 mm | ||||
| or | ||||
| Genetic gain | = (total improvement - environmental improvement) | |||
| = 15 mm - 9 mm = 6 mm | ||||
Table 12 shows how a control population can be used to assess the results of selection. In the example used in Table 12, the mean of the P1 generation was 150 mm, and the mean of the F1 generation select fish was 165 mm. If no control population had been grown, you would know that the mean increased by 15 mm, but there would be no way to determine what percent of the 15-mm increase was due to the selective breeding programme and what percent was due to better management skills, etc. Since a control population was produced, you can determine that 9 of the 15 mm was environmental gain. This means that had there been no selective breeding programme, the mean length would have increased from 150 mm to 159 mm. The difference between the F1 select and the F1 control generations (or the difference between total improvement and environmental improvement) is 6 mm, and that is the genetic gain.
The control population also enables you to determine the percent improvement gained as a result of selection. One generation of selective breeding improved mean length by 3.8% (6 mm/159 mm). Note that percent improvement is assessed using the value of the contemporary control group (in this case, the F1 control generation) as the standard.
There are two ways of expressing genetic improvement when it is expressed as a percentage. The first is to express it as percent per generation, as was done above. The second is to express it as percent per year. If the generation interval is one year, the values are identical, but if the generation interval is longer or shorter, the values are smaller or larger, respectively. For example, if the species does not mature and spawn until it is 4 years old, then the percent improvement per generation is divided by four to determine percent improvement per year.
When a farmer compares his select fish to the control population, he must compare the overall mean values that are determined from fish that are grown in at least three ponds. It does not matter if a farmer maintains his own control or if he uses a neighbour's fish. If each population is grown in a single pond, he will be unable to separate pond effects from genetic effects. One population may have a larger mean because the pond had a better algal bloom.
One way to circumvent the need to grow both populations in replicated ponds is to mark the control group and to stock it communally with the select population in a single pond. If the two groups are stocked communally, only 30–50 control fish need to be stocked in a pond.
A truly accurate assessment of the results of a selective breeding programme cannot be done simply by comparing the means of the select and control populations. The means must be compared statistically. Unfortunately, statistical analyses of the data from a selective breeding programme requires a sophisticated knowledge of experimental design and a basic understanding of statistics. Consequently, virtually all farmers will require expert assistance with data analysis. However, if such assistance is not available, a farmer should not be discouraged from conducting a selective breeding programme simply because the results will not be subjected to statistical analysis. The raw means will provide a good indication of what occurred.
The selective breeding programmes that are needed to improve quantitative phenotypes are more difficult, more sophisticated, and take longer than those needed to fix qualitative phenotypes. In fact, these breeding programmes are open-ended; if selection stops, the population usually loses much of the gain that has been made. Additionally, they require more sophisticated record keeping and also require some mathematical/statistical analyses of the data that are gathered. Examples of simple and inexpensive selective breeding programmes that can be conducted to improve growth rate and other quantitative phenotypes, as well as examples of the types of records that must be maintained, are presented in Chapter 5.
Selective breeding programmes are tried-and-true methods of improving growth rate and yield. But selective breeding programmes are not free, nor are they low-technology methods of increasing yields. If yield can be increased by proper use of lime, fertilizers, and/or feeds or if yield can be increased by stocking fish at a more appropriate density or by better water quality management, this should be the first approach used, because improvements will be immediate and will be relatively inexpensive.
Relatively few farmers should be encouraged to conduct selective breeding programmes. Selective breeding programmes require ponds, labour, money, and record keeping. They also require long-term planning and patience. Farmers who are unable to or who are unwilling to devote part of their farm to a breeding programme; those who cannot or who are unable to provide the labour needed to conduct the breeding programme; or those who cannot take, record, and maintain data should not conduct selective breeding programmes. Farmers who are incapable of long-term planning (1–10 years) should also be discouraged from initiating a selective breeding programme.
Farmers do not have to become geneticists in order to conduct selective breeding programmes to improve growth rate in fish. They do not need to know the heritability for length or weight; they do not even need to know what a heritability is. But they do have to be good managers.
Before initiating a selective breeding programme a farmer should conduct a survey to determine if a breeding programme is needed and should then determine what phenotypes need improving. The most logical decision for most farmers will be to improve growth rate. As a general rule, selective breeding programmes that are conducted on medium-sized fish farms should try to improve only growth rate. The major reason for this is the fact that the improvement that can be made for a phenotype is inversely related to the number of traits that are incorporated into the breeding programme. Secondly, improvements in growth rate will improve other important production phenotypes via indirect selection.
Once a farmer has decided what phenotype he wants to improve, he then needs to determine how the phenotype will be measured, when it will be measured, and the type of selective breeding programme that will be used to create his population of select brood fish-individual selection, within-family selection, or between-family selection. The differences among these types of breeding programmes are outlined in Table 13. If possible, individual selection should be used, because it is easier, less expensive, and requires less record keeping.
If a farmer wants to improve two phenotypes he should use independent culling or modified independent culling. Tandem selection should never be used. Improving two phenotypes by using a selection index is the most efficient type of selective breeding programme, but it is not recommended for farmers who run medium-sized fish farms.
A farmer who conducts a selective breeding programme must have a way of assessing the results of his labour. If he has the space and resources, he can maintain a control population. Otherwise, he can compare the mean of his select population over time to that from a neighbour's farm or that at a government hatchery.
When a farmer determines the gains that he has made as a result of his selective breeding programme, he should conduct a reassessment of the programme. He needs to examine all facets of the programme and to determine if there are easier and more efficient ways of conducting the programme. He also needs to determine if his investment is providing the desired dividends. Although a farmer should abandon a selective breeding programme that is not working, he should not be too hasty in judging the results of selection. If conducted properly, a selective breeding programme will produce small but steady gains.
Table 13. Comparison of the basic strategy and some of the advantages and disadvantages of individual selection, within-family selection, and between-family selection.
| Type of selection | Strategy | Advantages | Disadvantages |
| Individual | Choose best individuals; family relationships not important. | Best when h2≥0.25; inexpensive; can be done in few ponds; relatively easy to use for 2 or 3 phenotypes; all select fish are the largest; easy to retain large breeding population; least amount of data needed; least amount of record keeping. | Ineffective when h2≤0.15 as VE makes it difficult to choose best fish; asynchronous spawning can cause problems. |
| Within-family | Choose best individuals with in each family. | Best when h2≤:0.15 and VE affects family more than individuals; can be used with asynchronous spawning; moderately easy to maintain large breeding population; less expensive than between-family. | Moderately expensive;requires many ponds; hard to incorporate 2 or 3phenotypes; small fish can become select brood fish. Requires lots of data and lots of record keeping. |
| Between-family | Choose best families based on family means; individual values not considered. | Best when h2≤0.15 and VE affects individuals more than families; can because when fish must be killed. | Very expensive; requires many ponds; hard to incorporate 2 or 3phenotypes; small fish can become select brood fish; can lead to high levels of inbreeding. Requires lots of data and lots of record keeping. |
![]()
![]()
![]()