![]()
![]()
![]()
Appendix C-1 - ISNAR The Use of Proprietary Biotechnology Research Inputs at Selected CGIAR Centers
Appendix C-2 - June Blalock. Interviews With Selected Commercial Companies and Universities
Appendix C-3 - E. Binenbaum and B. Wright. On the Significance of South-North Trade in IARC Crops
1 Study conducted by Joel I. Cohen (Project Manager, ISNAR Intermediary Biotechnology Service; study coordinator), Cesar Falconi (Economist, ISNAR-IBS), John Komen (Information Specialist, ISNAR-IBS), and Michael Blakeney (Murdoch University School of Law, Australia).
Acknowledgments
I. Executive Summary
II. Purpose and Methodology
III. Context for Biotechnology and IPR at the IARCs
IV. Analysis of Information
V. Legal Analysis and Options
VI. Summary, Conclusions and Implications
VII. Recommendations
Selected References
Report of an ISNAR Study Commissioned by the Panel on Proprietary Science and Technology for the CGIAR
DRAFT VERSION
Please do not cite or circulate
29 January 1998
International Service for National Agricultural Research (ISNAR)
P.O. Box 93375
2509 AJ The Hague
The Netherlands
Tel: (31) (70) 349-6100
fax: (31) (70) 381-9677
email: [email protected]
ISNAR wishes to extend its sincere appreciation to the Director Generals and contact persons at the IARCs without whose full collaboration this study would not have been possible. The timeliness, clarity, and preciseness of their responses contributed greatly to increasing the study's significance, especially as each center knew the short time frame given to ISNAR. This meant that the material sent to each center required immediate attention. The time and care taken to complete this material was evident from the quality of the information received.
The study sought to distill system-wide lessons and implications from the information collected. Thus, the focus of the study was moved away from the responding centers and their individual approaches in the use of proprietary materials to a summary analysis and set of recommendations. These were prepared in order to stimulate more direct and in-depth consideration of its findings and the issues posed.
To conduct this study, it was necessary to have the complete confidence of the centers as to how the information would be presented in the final report. ISNAR has given this concern great attention, and trusts that centers feel this report to be valuable, especially given the full cooperation provided, and the difficulties anticipated in retrieving this information. While the two tables themselves were brief and specific, collecting the background information for each center's relevant program was often complicated.
The authors would also like to acknowledge the advice and assistance provided by Tim Roberts, Gary Toenniessen, Sam Dryden, Rob Horsch, Don Winkelmann and Stein Bie. Also, thanks to the CGIAR Secretariat for providing financial support.
This report presents the findings and conclusions of a study regarding the use of proprietary applications of biotechnology at selected CGIAR centers. The Proprietary Science and Technology Panel of the CGIAR commissioned ISNAR to conduct the study in November 1997, to gain an understanding of the current technologies and practices employed by the various centers. The purpose of the study is to: (1) provide an assessment of the extent to which proprietary applications of biotechnology are being used at the IARCs; (2) present the potential legal implications for consideration by the IARCs regarding use of the identified proprietary technologies and materials; and (3) give a synthesis of findings and recommendations in order to stimulate further discussion of the study.
ISNAR conducted a rapid survey among 7 CGIAR centers regarding the application of proprietary research inputs, and prospects for generating proprietary products from these inputs. Every center responding to the survey currently uses proprietary inputs (technologies and materials) for biotechnology research. In total, the centers reported using 45 discrete proprietary inputs in a total of 166 individual applications. Selectable marker genes, promoters, and transformation systems show the broadest utility across centers.
While the utility in a broad range of applications is evident, the legal implications for their use and distribution of resultant products are not always clear. The findings of the study indicate that for a substantial number of these applications of proprietary technology, there is no clear knowledge or information regarding their intellectual property protection (IPP). In addition, it is shown that a large number of these tools have come to the centers without written agreement, leaving the centers' legal responsibilities unclear. Thus, the use of proprietary materials and technologies poses a clear challenge to the CGIAR.
ISNAR also requested information on products expected to result from the application of proprietary inputs, whether any difficulties were anticipated regarding use and dissemination, and if centers are planning to take out any form of IPP for these products. A few centers have considered the implications of legal agreements for disseminating research outputs, and report a number of cases where they foresee some sort of distribution limitations due to contractual arrangements. On the question of seeking protection for research outputs, three were identified which may be patented and another 11 for which the use of other protective measures is anticipated.
Considering the findings of the survey, we recommend that the Panel on Proprietary Science and Technology examine the following points:
· Where several centers are using the same proprietary tools, it may be advantageous to collaborate in the acquisition of such technologies;· For those applications of proprietary tools which permission for use is unclear, immediate legal advice must be arranged;
· Actual experiences regarding the use of material transfer agreements and licenses should be analyzed and exchanged among centers, and possibilities for standard formats explored;
· The legal implications of, and possible restrictions on disseminating the products resulting from proprietary technologies deserve further research;
· Guidelines managing intellectual property at individual centers should be reviewed, and possibilities for a system-wide policy or guidelines considered;
· Given the limited familiarity regarding the implications of using proprietary technology, the CGIAR should create more awareness on this subject and develop expertise for managing intellectual property, system-wide and at individual centers.
Background and purpose
During the past few years, the CGIAR has discussed how to best use biotechnology when addressing CGIAR research objectives. At the CGIAR Mid-Term Meeting in May 1997, two expert panels were established to explore this question, one panel on General Issues in Biotechnology, and one on Proprietary Science and Technology. The latter panel was set up to deal with the legal issues and ramifications of proprietary science and the complex partnerships that have arisen. The panel felt that gaining an understanding of the current technologies and practices employed by the various centers would be an important first step in this process. Therefore, in November 1997, the CGIAR Proprietary Science and Technology Panel requested ISNAR to conduct a review of the use of proprietary applications of biotechnology at selected CGIAR centers.
The purpose of the study is three-fold:
· To provide an assessment of the extent to which proprietary applications of biotechnology (technologies and materials) are being used at the IARCs.· To present the potential legal implications for consideration by the IARCs regarding use of the identified proprietary technologies and materials.
· To give a synthesis of findings and recommendations in order to stimulate further discussion of the study.
Methodology
Considering the above mentioned conditions and purpose of the study, ISNAR decided to conduct a rapid survey among CGIAR centers regarding the application of proprietary research inputs, and prospects for generating proprietary products from these inputs. A list of relevant proprietary technologies and materials was constructed by contacting several technical experts. Following this review, the technologies and materials were grouped into eight categories as follows:
· Transformation systems;
· Promoter genes;
· Insect-resistance genes;
· Disease-resistance genes;
· Selectable marker genes;
· Genetic markers;
· Diagnostic probes;
· Others.
Two concise survey tables were developed to determine which proprietary 2 technologies or materials from the categories above are being used at the centers. On the first table, respondents were asked to provide more information on specific applications, the means by which intellectual-property protection is provided (patents, plant breeders' rights, or other means), and how the center obtained permission for research (e.g., license, or material transfer agreement). On the second table, information was requested on the research products to be derived from the technologies or materials identified, the dissemination of results from this research, and if any intellectual-property protection was to be sought by the center itself.
2 For the purpose of this study, proprietary technologies or materials refer to those which are privately owned, managed or protected through some sort of intellectual property. This means that IPP for the technology or material must exist in at least one country, taking into account the territorial implications of IPP.
In consultation with the Panel Chair and with TAC, ISNAR selected 7 centers to complete the survey, reflecting a balance between research on cereal crops, non-cereals, and livestock. The selected centers were initially contacted during the first week of December 1997, by approaching their respective Directors General and subject-matter specialists. All 7 centers returned their completed survey forms during the second half of December. The data received were organized using database management software, facilitating the analysis of qualitative information. Separate records were generated for specific proprietary technologies and materials reported by each center. This method of data entry created many individual records, which helped to ensure the uniqueness of data from centers having multiple crop or research mandates.
A note on confidentiality
An essential condition for conducting the survey in a timely manner was the explicit guarantee of confidentiality. Therefore, specific information collected from each IARC is not presented in this report. Rather, the study focuses on its findings regarding system-wide trends and recommendations for the use of proprietary science. Applications of proprietary technology have been categorized under general headings such as "cereal", "non-cereal", and "other", to avoid showing direct relationships between the findings presented in this report and an individual center.
Recent discussions on IPR in the CGIAR have been primarily driven by two related developments, (1) the increasing importance of biotechnology in centers' research; (2) the growing position of the private sector in international agricultural research.
Since the early 1980s, the IARCs have invested in building up their infrastructure and human-resource capacity for biotechnology research. Annex 1 provides examples of specific IARC-based biotechnology initiatives. By now, most IARCs have specialized units or divisions for molecular biology and other techniques covered by the term "biotechnology". Annex 1 illustrates the wide range of collaborative activities in biotechnology that they have initiated. According to recent TAC figures (TAC, 1997), the centers are spending about US$ 24 million per year on biotechnology research. Of that amount, about 27% is related directly to livestock (primarily animal health). Roughly 15% of the total expenditures go to genetic engineering. It is safe to state that, for the CGIAR client countries, the IARCs have become a key player in agricultural biotechnology. Although combined R&D investments in agricultural biotechnology may be small compared to leading private-sector companies, the IARCs have developed an extensive network of research collaboration with advanced research institutes, public and private, in industrialized countries and developing countries. During the 1997 CGIAR Mid-Term Meeting and International Centers' Week, the chairman of the CGIAR has stated that the centers' capacity for biotechnology research must expand.
Together with a growing involvement in biotechnology, concerns have been expressed at CGIAR meetings about intellectual property rights. Since 1980, intellectual property protection for agricultural inventions has been strengthened. A growing number of countries include the possibility to protect living material under their patent laws. Plant breeders' rights have been introduced and/or strengthened. The resulting possibilities to legally protect agricultural innovation has stimulated the involvement of the private sector in agricultural research. In addition, many advanced public research organizations and universities routinely protect their research results. This situation may create difficulties for the IARCs in accessing, using or protecting relevant technology.
Discussions on IPR in the CGIAR have been many, and will not be repeated in this report. To date, no general policy or guidelines regarding IPR have been issued by the CGIAR. In 1992, the CGIAR adopted a "working document" on genetic resources and intellectual property, containing guidelines on IPR management. The working document reaffirms that the resources maintained in the gene banks at the centers should be freely available, and that the centers should not seek legal protection for their innovations unless it is absolutely necessary to ensure that developing countries have access to new technologies ("defensive patenting"). The centers should not seek intellectual property protection for income-generating purposes and will not view potential returns from intellectual property protection as a source of operating funds. The document also states that any intellectual property right acquired by a center should be exercised without compromising in any manner whatsoever the fundamental position of the CGIAR regarding free access by developing countries to knowledge, technology, materials, and genetic resources (CGIAR, 1992).
Policies regarding IPR may vary among individual IARCs, as they are autonomous organizations. A few centers have drafted their own IPR guidelines, which basically follow the principles laid down in the CGIAR working document.
Utility of proprietary technologies and materials
Every center responding to the survey currently uses proprietary inputs (technologies and materials) for biotechnology research. Table 1 lists the complete range of the proprietary technologies and materials used by the centers, their means of protection, and the specific number of applications reported in center research programs. In total, 45 discrete technologies and materials were reported, covering the eight technology categories introduced above. As most centers apply these technologies and materials in several mandated commodities, we recorded 166 specific applications of proprietary research inputs. Of the eight technology categories surveyed, selectable marker genes, promoters, and transformation systems show the broadest utility across centers (Figure 1; Table 1). This clearly demonstrates the role which proprietary technologies and materials have assumed in research at the IARCs, as is true for advanced research centers globally.
While some applications are being clearly applied in a "research only context," other technologies and materials become part of germplasm or other products suitable for release to the national agricultural research institutes, NGOs, other partners, or even directly to farmers. The wide-spread importance of specific selectable markers (BAR, GUS), promoters (CaMV/35S), transformation systems, and of AFLP genetic markers is evident, while in other cases, more center-specific needs are apparent, such as for insect and disease resistance.
Similarities and differences among centers with regard to the use of these materials and technologies are seen through "center profiles". These profiles also help visualize relative degree of emphasis and differences among multi-crop and single-crop centers (Figure 1). Most but not all centers are using proprietary genetic markers, a set of disease- and insect-resistance genes, and some centers have integrated these technologies more than others across their mandated research portfolio.
Figure 1. Center profiles indicating use of proprietary technologies and materials
Table 1. Proprietary technologies and materials covered by survey.
|
Technology category |
Specific tool |
Protected through |
# of applications reported |
|
Selectable markers |
BAR |
patent |
11 |
|
GUS |
patent; other |
11 |
|
|
kanamycin |
patent; N.K. |
11 |
|
|
hygromycin |
patent; N.K. |
5 |
|
|
HPT |
patent |
4 |
|
|
PAT |
patent |
1 |
|
|
other |
other |
2 |
|
|
Promoters |
CaMV/35S |
patent; N.K. |
14 |
|
maize ubiquitin |
patent; N.K. |
5 |
|
|
rice actin 1 |
patent; other; N.K. |
4 |
|
|
wound-inducible sucrose synthase |
patent |
4 |
|
|
PEP carboxylase |
patent |
1 |
|
|
pith-specific |
N.K. |
1 |
|
|
other |
patent; N.K. |
6 |
|
|
Transformation systems |
Agrobacterium |
patent; N.K. |
14 |
|
biolistic |
patent; N.K. |
10 |
|
|
PEG |
N.K. |
1 |
|
|
electroporation |
N.K. |
1 |
|
|
other |
N.K. |
3 |
|
|
Insect-resistance genes |
Cry I ab |
patent |
9 |
|
Cry I ac |
patent; N.K. |
2 |
|
|
Cry I b |
patent |
1 |
|
|
CpT1 |
patent |
3 |
|
|
soybean trypsin inhibitor |
N.K. |
2 |
|
|
pigeonpea trypsin inhibitor |
N.K. |
2 |
|
|
Disease-resistance genes |
Xa 21 |
patent |
3 |
|
coat protein |
patent; other |
3 |
|
|
RIP |
patent |
1 |
|
|
pathogen-derived |
patent |
1 |
|
|
antifungal protein |
patent |
1 |
|
|
stilbene synthase |
patent |
1 |
|
|
other |
other |
1 |
|
|
Genetic markers |
AFLP |
patent; N.K. |
8 |
|
RAPD |
N.K. |
1 |
|
|
micro-satellite |
N.K. |
1 |
|
|
Diagnostic probes |
DNA hybridization |
N.K. |
1 |
|
ELISA |
N.K. |
1 |
|
|
PCR primers |
N.K. |
1 |
|
|
Others |
snowdrop lectin gene |
patent |
4 |
|
antisense |
N.K. |
2 |
|
|
bacterial gene codon |
patent |
2 |
|
|
granule bound starch synthase |
patent |
2 |
|
|
starch branching enzyme |
patent |
2 |
|
|
bacterial |
patent |
1 |
|
|
eukaryotic |
N.K. |
1 |
N.K. = not known
Utility across research categories
In Table 2, the various technologies and materials are sorted by their use in relation to mandate crop or other types of research, by grouping the information collected into three research categories. These groups provide a means to analyze the information without revealing individual center responses. The categories were defined as follows, based a list of possible research targets for the CGIAR centers:
Cereals: maize, rice, wheat, sorghum, finger millet and pearl milletNon-cereals: beans, cassava, tropical forages, potato, sweet potato, chickpea, cowpea. pigeonpea, groundnut, lentils
Other: diagnostics, livestock health, microbial systems, general developments
These findings reveal an almost equivalent use of inputs among centers working on either cereal or non-cereal crops, with fewer applications recorded for the non-crop centers and programs. The distinction reflects the significant degree of emphasis placed on crop research in the CGIAR system. The information, as shown in the individual center profiles (Figure 1) clearly indicates the wide-spread utility of and reliance on this range of inputs across the system.
Table 2. Applications of proprietary technologies and materials by research category.
|
Technology category |
# of applications per research category |
|||
|
Cereals |
Non-cereals |
Other |
TOTAL |
|
|
Selectable markers |
17 |
26 |
2 |
45 |
|
Promoters |
18 |
14 |
3 |
35 |
|
Transformation systems |
12 |
14 |
3 |
29 |
|
Insect-resistance genes |
8 |
11 |
0 |
19 |
|
Disease-resistance genes |
6 |
5 |
0 |
11 |
|
Genetic markers |
4 |
4 |
2 |
10 |
|
Diagnostic probes |
0 |
0 |
3 |
3 |
|
Others |
6 |
6 |
2 |
14 |
|
TOTAL |
71 |
80 |
15 |
166 |
Means of protection and permission for use
Figures 2 and 3 show the means of protection given to the technologies and materials analyzed in the survey, and how permission for use was obtained by centers. While not all of these proprietary inputs pose difficulties regarding intellectual property or for the dissemination and use of resulting products, it is appropriate for centers to explore any potential difficulties in this regard.
As indicated in Figure 2, in more than 30% of the applications of proprietary technology, centers indicated that they have no clear knowledge or information on the type of IPP provided for a particular proprietary tool. Thus, a high potential exists for infringement of legal conditions regarding the use of these proprietary technologies and materials. In addition, Figure 3 indicates that more than 35% of the applications are done without written agreement, leaving the center unclear as to its legal responsibilities, or as to how the use of the proprietary tool has been achieved.
Figure 2. Proprietary technologies and their means of protection. -

Figure 3. Proprietary technologies and their permission for use.
Note: In some cases, permission for use is covered in more than one way, e.g., a combination of MTA and license. For these cases, the first way of permission mentioned was used for the graph.
Combining the results presented in Figures 2 and 3, it is possible to suggest degrees of legal attention or concern warranted by the use of these technologies (Table 3). Immediate legal attention should be considered when the information on protection and permission are unknown or when there is no written approval for the use of proprietary technologies. About 40% of the total technologies and/or materials identified appear in this category, which constitutes a potentially risky situation for the CGIAR system. As a consequence of not understanding or taking into account the legal conditions of the use of proprietary technologies, the access to such technologies could be restricted or diminished with regard to national program partners.
Table 3. Potential for legal advice needed by CGIAR centers regarding use of proprietary technologies and materials
|
|
Need immediate attention |
Need further investigation |
Low immediate concern |
|||
|
Protection and Permission |
Means of protection |
Permission for use |
Means of protection |
Permission for use |
Means of protection |
Permission for use |
|
|
N.K, |
N.W.A. |
N.K. |
License |
Patent |
License |
|
N.K. |
N.K. |
N.K. |
Sublicense |
Patent |
MTA |
|
|
Patent. |
N.K. |
N.K. |
MTA |
Other |
MTA |
|
|
Patent |
N.W.A. |
|
|
|
|
|
|
Other |
N.K. |
|
|
|
|
|
|
Other |
N.W.A. |
|
|
|
|
|
|
Number of applications in these combinations |
64 |
26 |
76 |
|||
MTA = material transfer agreement;
N.W.A. = no written approval;
N.K. = not known.
Potential difficulties for specific technologies
Some technologies and materials pose more difficulties than others with regard to permission for use. As seen in Figure 4, when permission for use has been obtained, it is generally achieved through MTAs, licenses or a sublicense. However, for each technology category, except diagnostic probes, the centers are using a number of technologies and materials without written agreement, or for which permission is not known. Permission to conduct research using the majority of technologies has been obtained through MTAs or licenses. While obtaining permission for research is the general rule, exceptions do exist. For example, with transformation systems where the permission to use specific systems (PEG/protoplasts and electroporation) is not clear. Similar problems exist for the use of selectable markers, genetic markers, and various insect and disease resistance genes. However, it should also be noted that MTAs may secure permission for research, but do not generally confer permission for use and dissemination. Thus, review of each individual MTA is crucial to achieve clarity regarding IPP implications for the centers.
Figure 4. Agreements and potential difficulties regarding permission to use proprietary technologies and materials
Expected products and concerns regarding dissemination
The information received was next analyzed with regard to expected products and difficulties anticipated for their dissemination. In addition, indications of whether or not any form of IP is expected to be sought by the IARCs was requested. The purpose for using these technologies is to develop an output, such as improved mandate crops, animal health products, new genetic constructs, or new research methodologies. The survey results indicated a total number of 58 outputs or products in these categories. Restrictions may also exist for the use, dissemination or further production of these outputs, based on the fact that the proprietary inputs have IPP. Responses from the centers regarding these issues are presented in tables 4, 5, and 6.
More than 40% of the responses indicate that centers do not have enough information or knowledge to anticipate difficulties in the post-research use and dissemination of outputs generated from proprietary technologies. Consequently, one could imagine that some outputs developed with proprietary technologies will encounter problems with use and dissemination, especially if exports occur to countries where the technologies have IPP. Many centers have yet to take into account the extensions of protection and permission requirements of such technologies.
A few centers have considered the implications of legal agreements for disseminating research outputs, with 14% of the responses foreseeing some sort of limitations. For example, a contractual arrangement between a private multinational, as owner of the input technology, and one center indicates that outputs can be distributed only among specific countries. There is an ex-ante understanding of the restrictions and limitations for the dissemination in this case, and it should be studied further by the CGIAR.
Table 4. Products expected from the application of proprietary tools
|
Product category |
# of expected products reported |
Examples |
|
Improved mandate crops |
36 |
Improved cereal and non-cereal varieties with enhanced insect-, fungal-, and virus resistance |
|
Diagnostics |
11 |
Diagnostic tests for tropical livestock diseases |
|
Vaccines |
1 |
Vaccine for East Coast Fever |
|
Others |
10 |
Transformation protocols; genetic markers |
Table 5. Difficulties anticipated regarding dissemination or use of products because of proprietary or legal issues.
|
Product category |
Difficulties anticipated: # of products reported |
|||
|
None anticipated |
Not known |
Limitations possible |
Under investigation |
|
|
Improved mandate crops |
7 |
19 |
8 |
2 |
|
Diagnostics |
11 |
- |
- |
- |
|
Vaccines |
1 |
- |
- |
- |
|
Others |
3 |
5 |
- |
2 |
IARC patents
The CGIAR, along with other institutions producing international public goods, is considering options to ensure that developments from center research programs will be able to reach intended beneficiaries. As recently stated in the "End-of-Meeting Report" from International Centers Week, 1997: "The CGIAR stands for free flows of germplasm and it has no profit motive. However, it may have to think of defensive patenting in order to stake out a claim and ensure access."
In this regard, information was also collected to assess the degree to which centers are planning to patent or otherwise protect inventions. As seen in Table 6, three outputs were identified which may be patented and 11 other outputs where the use of other protective measures is anticipated.
Table 6. Do Centers expect to file for registration or protection of new products?
|
Product category |
Means of protection or registration |
||
|
Not anticipated |
Not known |
Yes: Patent or other means |
|
|
Improved mandate crops |
19 |
16 |
1 (patent) |
|
Diagnostics |
- |
- |
11 (other) |
|
Vaccines |
- |
- |
1 (patent) |
|
Others |
4 |
5 |
1 (patent) |
This section provides a "first look" at the information collected with regard to potential legal implications for both CGIAR centers and their NARS partners.
Using MTAs
As is indicated in Figure 2, the most common means used by the centers for obtaining legal arrangements for research using proprietary technologies is through Material Transfer Agreements (MTAs), followed by licensing. Such extensive use of agreements and licenses is certainly a new fact of life for the CGIAR system, and for publicly-funded agricultural research in general. The study did not attempt to collect information on the range of providers supplying material to the centers. No doubt many sources are involved, indicating the growing range of materials applicable to CGIAR research.
This study also did not review the type of MTAs being used by the centers. The simplest of such agreements takes the form of a letter accompanying the proprietary technology. In this situation there is a question as to whether a supply on unilaterally prescribed terms constitutes a binding agreement with the recipient.
MTAs may range from the simple letter agreement described above to a more compendious contract that sets out all the relevant terms for the use of proprietary technologies. Typical clauses may include: (a) use permitted for research purposes only; (b) obligation to share royalties or profits; (c) grant back to the supplier of any intellectual property rights generated from derivative material; (d) disallowance of patent applications for the supplied material; (e) maintenance of confidentiality of any trade secrets which are provided, or which may be generated by the acquirer; (f) deferment of publications to secure patenting; (g) acknowledgment of the supplier in connection with any publications; and (h) warranties for example in relation to biosafety clearances.
Given the various legal obligations (as discussed below) that are generated by MTAs, particularly those of the comprehensive contract type, the popularity of the MTA as a means of obtaining proprietary technologies, and, the likelihood that MTAs will be formulated and imposed by the technology supplier, the CGIAR system may wish to review and use standard formats for MTAs which help guide the CGIAR Centers in these complex matters. For example, a useful precedent for MTAs in relation to agronomic materials is the MTA suggested by Barton and Siebeck (1994) for the exchange of genetic resources.
Enforcement of obligations
Where legal obligations are imposed by MTAs, the relevant center must be in a position to honor its obligations under the agreement. For example, where the proprietary technology involves the supply of a trade secret and confidentiality obligations are imposed, the center must be in a position to police the confidentiality of the material supplied. This may involve the establishment of a secure system of operation and the placing of researchers and visitors under confidentiality obligations.
In the event of a default under an MTA, it will be the CGIAR center which will be the likely defendant to a legal suit and not the individual actually responsible for a relevant infringement. This is because it will be the center which is the signatory to the MTA.
Management of legal obligations
Given the increasing legal complexity involved in the supply of proprietary technologies, which may raise matters of contract law, intellectual property law, biodiversity and biosafety law, technology transfer and competition law (where restrictive provisions are imposed) it would be useful for a CGIAR center to have a person who is the primary legal administrator. This person would be responsible for ensuring the compliance of staff with any legal obligations generated by MTAs. Similarly, this administrator would be responsible for ensuring the compliance of a center with terms of any intellectual property licenses. The survey discloses that after MTAs, licenses are the commonest way of acquiring proprietary technologies. Therefore, it should be reiterated that MTAs, licenses and sub-licenses impose direct legal obligations upon the CGIAR centers. The large number of these agreements suggest that it may be prudent for the Director Generals to delegate the oversight of their legal obligations to a legal administrator.
Management of proprietary tools
Where different CGIAR centers are using the same category of proprietary tools to obtain the relevant technology, it may be advantageous to cooperate in the acquisition of such technologies. For example, the survey indicates that CaMV/35S is clearly the promoter of first choice. In this situation the opportunities for coordination are self-evident. Precedents for such coordination have been seen for research collaborations supported by international biotechnology research programs such as the Agricultural Biotechnology for Sustainable Productivity (ABSP).
Management of IP obligations
Table 5 indicates that for the 58 products reported, no dissemination constraints due to legal arrangements are expected for 37% of them, while for 40% of these products, the centers reported not knowing if such constraints may exist. These statistics indicate the need for CGIAR centers and for the system: (i) to develop IP expertise to analyze potential limitations and (ii) to designate an officer to administer legal obligations. The necessity to develop a capacity to manage IP obligations may be incumbent in the constitution of the center.
For example, the IRRI Policy on Intellectual Property Rights provides that IRRI will apply for intellectual property protection under Principle 7 in exceptional circumstances "to ensure availability to developing nations of advanced biological technologies or biological materials" and under Principle 9 on new agricultural equipment. Principle 12 requires that "IRRI will devise, maintain and monitor employee policies on intellectual property rights... and policies or agreements to govern its relations with visitors and research collaborators". The implementation of principles such as these will obviously require an internal system of intellectual property management. The high percentage of applications reported in Table 3 and products in table 5 where IP implications are "not known", may suggest that there is work to do in this regard.
Similarly, the relatively small amount of intellectual property protection being sought by centers (Table 6) may be attributed to an unfamiliarity with IP issues, that suitable IP options are not yet developed and approved, as well as the traditional reliance on development of goods and services developed as international public goods.
The promulgation in April 1994 of the Agreement on Trade Related Intellectual Property Rights (TRIPs), as a membership obligation for countries joining the World Trade Organization, includes a requirement that signatory countries protect plant varieties through either patent protection or a sui generis system. Responses to the survey indicate that proprietary technologies and/or materials covered under PVRs have not been used by the centers. But, the presence of the mandatory obligation in the TRIPs Agreement concerning the introduction of this form of IP protection provides an additional reason for CGIAR centers to familiarize themselves with IP obligations.
The TRIPs Agreement also modifies the rules relating to compulsory patent licensing and contains a chapter concerning restrictive conditions in intellectual property licenses. These international legal developments make it incumbent upon CGIAR centers to understand their relations to these evolving global conditions.
Proprietary inputs used extensively in center research. Information collected in this study indicates the extent to which CGIAR centers are using and integrating biotechnology as part of their ongoing research programs. The centers have moved from a time in the early to late 1980s when biotechnology was virtually non-existent, or limited to plant tissue and cell culture and other in vitro technologies, to a point where these associated technologies and materials are being used to develop a new generation of agricultural inputs, many focused on products arising from transformation (Table 1,3, 4; and Figure 1).
Extensive use of MTAs. Important contributions towards this work include proprietary technologies and materials, meaning that they have been developed and/or under protection by private sector research organizations. The extensive use of such materials means that as centers take on the transformation of mandate crops, the development of vaccines and diagnostic probes, and provide for marker-assisted breeding, that their dependence on licenses, MTAs, and other agreements with the private sector (Figure 3) becomes of greater importance.
Limited IPP sought by centers. Each center questioned indicated that it is using applications of proprietary biotechnology. Each center also has many avenues from which these materials and technologies are being received; although implications are for their eventual use and dissemination to center partners are not always clear. While the technologies received by centers are numerous, the number of resultant products that are expected to be patented by the centers is very low (Table 6).
Centers operating in a challenging and complex environment, highlighting need for increased IP consultations. The use of these materials and technologies pose a challenge to the CGIAR. While their utility in a broad range of applications is evident, the legal implications for post-research use and distribution are not always clear (Tables 3 and 5). To illustrate this point, selected examples where the permission for use of proprietary technologies and/or materials is not clear have been taken from the completed survey forms and compiled in Table 7.
Table 7. Selected examples of proprietary technologies and related dissemination concerns.
|
Example |
Form of protection |
Permission |
Dissemination constraints |
|
CaMV/35S |
Patent |
MTA |
Possible, given recent rulings in favor of multinational company |
|
Cry I ab |
Patent |
MTA/Sublicense |
Unclear IPR position, non anticipated for poor farmers |
|
AFLP marker genes |
Patent |
---- |
Under investigation |
|
Bacterial gene codon |
Patent |
MTA |
Unclear given current controversy |
|
Agrobacterium |
Patent |
No written agreement |
NK, to be negotiated |
|
CpT1 |
Patent |
No written agreement |
NK, to be negotiated |
|
Coat protein genes |
Patent |
No written agreement |
---- |
|
AFLP markers |
Patent |
No written agreement |
NK, to be negotiated |
|
Kanamycin marker |
Patent |
No written agreement |
NK, to be negotiated |
|
Snowdrop lectin gene |
Patent |
No written agreement |
NK, to be negotiated |
|
Stilbene synthase |
Patent |
License |
None reasonable foreseeable |
|
PEP Carboxylase |
Patent |
License and MTA |
Limited to certain countries need approval from multinational company |
|
Xa 21 gene |
Patent |
MTA/Sublicense |
Exclusion of certain countries |
|
Bacterial gene codon modified for plant expression |
Patent |
License |
NK |
NK = not known
Some of the inputs identified have a more global use, while others are relevant to only one or two centers. No matter which, the extent of their use and the fact that some of these applications will become available to the NARS, NGOs and other partners through new products, argues for the need of consistent, system-wide legal advice.
Finally, there are a few implications from the study illustrating complexities for the centers regarding use of newer, more advanced technologies:
· Centers are usually certain as to the type of IPP provided for proprietary technologies, but they are not as clear with regard to receiving authorized use for these inputs;· research at the centers has benefited from proprietary technologies and materials by virtue of the fact that they are in common use, but this also means that they are using "older generation" technologies or materials; and,
· centers not able to obtain authorized use could have more limited access to recent or improved technologies.
Based on the information in this report, the following recommendations are made for the Panel on Proprietary Science and Technology:
1. Centers may wish to acknowledge the use of proprietary technologies and materials in their research programs as one means of demonstrating collaboration, and highlighting the scale of such contributions;2. Given the limited familiarity regarding the implications of using proprietary technology, the CGIAR should create more awareness on this subject by developing system-wide and center expertise for managing intellectual property;
3. Where several centers are using the same proprietary tools, it may be advantageous to collaborate in the acquisition of such technologies;
4. Immediate legal advice must be arranged for those applications of proprietary tools which permission for use is unclear;
5. Review of experiences and conditions regarding material transfer agreements should be analyzed and exchanged among centers, possibilities for standard formats explored, and legal implications determined regarding possible restrictions on use and dissemination;
6. Given the range of proprietary technologies being used, guidelines for managing intellectual property at individual centers should be reviewed, and possibilities for a system-wide policy or guidelines considered.
Barton, J.H., and W.E. Siebeck. 1994. Material Transfer Agreements in Genetic Resources Exchange - The Case of the International Agricultural Research Centers. Rome: International Plant Genetic Resources Institute.
CGIAR. 1992. CGIAR Working Document on Genetic Resources and Intellectual Property. Annex 3 in CGIAR Mid-Term Meeting 1992 - Summary of Proceedings and Decisions. Istanbul, May 19-22, 1992. Washington, DC: CGIAR Secretariat.
TAC. 1997. Added Information on Expenditures in Biotechnology in 1997. Prepared by the TAC Chairman for discussions on Biotechnology at ICW97, 28 October. Unpublished.
ACCESS TO THE PROPRIETARY SCIENCE OF OTHERS
A preliminary informal survey of intellectual property owners was conducted to determine whether it would be possible to obtain authorized access to protected technologies and materials for applications important to the mission of the CGIAR. Five multinational corporations which own plant biotechnology-related intellectual properties in multiple jurisdictions were contacted, as well as five major U.S. land grant universities with extensive agricultural research programs. In order to obtain candid responses, the parties interviewed were assured anonymity. All interviewees have responsibilities for managing and licensing intellectual properties for their respective organizations. None have policy-making authority, although all have input into policy decisions regarding intellectual property matters.
The corporations were asked the following questions:
1 - Does your company have any ongoing or previous working relationship(s) with any CGIAR center(s)? If so, what type of relationship (s)? With which center(s)? If not, for what reasons?
2 - Does your company currently market products in any country(ies) where CGIAR centers are located [list provided]? In other developing countries? What are your marketing plans in these countries for the near future? Do you find intellectual property protection necessary and/or useful in these markets?
3 - Would your company be interested in/willing to cooperate with the CGIAR to make new technologies available to the world's poor?
4 - Under what general terms have you/would you be willing to make company-owned proprietary technology available to the CGIAR centers for research? For local distribution? For export to other countries?
5 - Would the availability of intellectual property rights for technologies/materials developed at the CGIAR centers make possible future working relationships with the centers more or less attractive to your company?
6 - What role, if any, do you see for the CGIAR centers in the development, transfer and distribution of new technologies/materials in the future?
The following is a compilation of the responses received;
Question 1
Those who responded yes were most likely to have worked with CIMMYT and/or IRRI. The types of agreements included materials transfer agreements for company-owned materials, research agreements and testing agreements using company-owned technology. There is one patent license currently under negotiation for center-owned technology. None were aware of any examples where germplasm or other materials had been received from any CG centers, although research managers might be better able to answer this question. Those who responded no to this question said that the centers are not viewed as an important source of either germplasm or technology by their company.
Question 2
All responded that they market products worldwide. There is most likely to be a strong marketing effort in South America, and least likely to be a strong effort in Africa. All companies indicated that they apply for IP rights in all countries where such rights are available and enforced. Where rights are not available, or not enforced, they do not market the latest innovations, and they do not develop new technologies for crops localized to these geographic areas. All agreed that it is essential to improve IP protection before can afford to make any major investments in these countries.
Question 3
All responded yes, and some are already cooperating with various CG centers. An important caveat is that it depends on the technology and the risk associated with uncontrolled distribution. There was much more concern about the appropriate management of herbicide or insecticide resistance than there was about the potential loss of IP rights. All said that they need assurances that there are effective mechanisms to prevent "trickle back" of protected materials into key markets.
Question 4
The primary issue is management and control of distribution (see response to Question 3). All are willing to make materials available under standard materials transfer agreements (no commercial use, no distribution to third parties), in principle. However, there is concern about the enforceability of these terms. They probably would not share the most valuable materials. All would be willing to make materials available for local distribution on a case by case basis, with proper controls. For example, distribution could be limited to locally adapted varieties only. Materials intended for export use would be subject to a commercial license agreement
Question 5
All said that the availability of IP rights for technologies and materials developed by the CG centers would make working with the centers more attractive. IP rights need only be obtained in important commercial markets, such that distribution to subsistence farmers could continues as always. Even if the company was only able to obtain a non-exclusive license, it would still have value because it would contribute to an "orderly marketplace." and the company could be assured that their competitors were no getting a "free ride." A couple of caveats: most public sector institutions overestimate what technology/materials will be commercially useful, and the CG centers will need a knowledgeable IP management/licensing staff to make such a program work. One suggestion was that the CG centers could transfer IP rights to the NARS for management
Question 6
The CGIAR should be a forum for discussion about IP rights and public use issues on a worldwide basis, and it should bring the interests of the private sector into the discussion. The CG centers should continue to adapt technologies to regional needs and act as a technology conduit to subsistence farmers. The role of the CG centers will diminish unless ways are found to access proprietary technologies. However, as they get involved in IP rights and enforcement, the centers should not try to become businesses. They should continue to serve the public interest
The universities were asked the following questions:
1 - When your university licenses intellectual property related to crop improvement, what public use exemptions are usually included in the agreement?
2 - Does your university normally (or has it ever), sought patent protection in the countries where CGIAR centers are located [list provided]? In other developing countries? If so, what public use exemptions are included?
3 - Has your university ever made proprietary technologies/materials available to any of the CGIAR centers? If so, under what terms? If not, why not?
4 - Has your university ever used university-owned intellectual property rights as bargaining chips to obtain access to another party's intellectual property? If so, what additional information can you provide? If not, are you aware of any examples where a public sector institution has used this approach?
The following is a compilation of the responses received:
Question 1
In exclusive and partially exclusive licenses, rights are retained for the university to do research, including with third party non-profit organizations. Where U.S. government funding is involved, rights are retained for U.S. government use. Use in developing countries is usually not an issue, because these countries are usually not included in the license agreement due to a lack of enforceable intellectual property rights. This issue is only explicitly addressed in cases where there is funding from the Rockefeller Foundation.
Some universities retain rights for state crop improvement associations for some crop varieties. This does not apply to utility patents.
Question 2
The answer is generally no, except for Mexico. Otherwise, IP rights are sought only in countries which are of commercial interest to the licensee. Licensees frequently want rights in South America, but seldom in Africa and Asia. Public use exemptions for subsistence farming and non-export production are seldom discussed in the license negotiation. Generally, this is viewed as an enforcement issue for the licensee. There is an operating assumption that the licensee would not enforce patent rights against subsistence farmers.
Questions 3
They have never received a request for proprietary materials from any CG center that they are aware of. However, all agreed there has probably been scientist to scientist transfer of materials. All would be willing to make proprietary materials available to the centers under standard materials transfer agreements (limited to research use, no transfer to third parties, new inventions must be reported and ownership is based an inventor ship). Other use, such as transfer to subsistence farmers, could be determined on a case by case basis, and would depend on rights already granted to a commercial licensee, the local availability of patent rights and assurances from the centers regarding distribution controls. Export would be the main concern.
Question 4
None of these universities has ever done a cross license, although several are under discussion currently. Because the universities are required to share revenues with inventors, there is concern about how to value (in monetary terms) a cross license for the purpose rewarding the inventors. Several universities have in-licensed technology to make a total IP package more valuable. This is also done to provide access to dominant patent rights for small company licensees. However, usually companies would prefer to negotiate directly with each other. Apocryphal examples of cross licenses for multimedia or software technologies were mentioned, but no details were available.
Conclusions
The general willingness of these intellectual property owners to provide access to their proprietary science is encouraging, but it does not in any way assure that access will be available to any particular property. Agreements will have to be negotiated on a case by case basis, dependent upon the owner, the particular property and the specific use intended by the IARC requesting access. However, it should be possible to obtain similar terms for all IARCs for a particular property.
1. The Issue
2. The Data
3. Discussion of Tables and Graphs
4. Conclusions
5. Tables and Figures
An important issue confronting the International Agricultural Research Centers (IARCs) and the Consultative Group on International Agricultural Research (CGIAR) is whether intellectual property rights on technologies and genetic materials from developed countries might in the future jeopardize the free supply of those technologies and materials to IARCs. In particular, if developing countries ("the South") export to developed countries ("the North") IARC crops 1 that incorporate technology or genes that are subject to Northern intellectual property rights, Northern suppliers might in the future take legal action to make IARCs or their clients pay for proprietary technology and genetic materials.
1 Crops which are the focus of IARC research are for convenience denoted 'IARC crops'.
How big a problem might this be? In the long term, the answer depends in part on the future significance of sales of IARC crops in markets offering strong intellectual property protection for the relevant processes and products. In the near future, sales are in general most likely to encounter strong intellectual property rights in countries of the North, although stronger intellectual property protection is spreading to other countries under the provisions of the TRIPS 2 agreement of the World Trade Organization (WTO).
2 TRIPS stands for "Trade-related Intellectual Property Rights, Including Trade in Counterfeit Goods".
In predicting the likely volume of such sales, a good place to start is with recent trade data. Accordingly, this report, prepared as a broad overview prepared to inform the deliberations of the Expert Panel on Proprietary Science and Technology of the CGIAR, focuses mainly on the question: "How significant are exports from South to North of IARC crops, in absolute terms and relative to domestic production and to total exports?"
Raw data on agricultural trade and production were obtained from the FAOSTAT database, made available on the Internet by the Food and Agricultural Organization (FAO) of the United Nations. Note that this data set does not provide bilateral (i.e., country-to-country) trade data. It does provide annual commodity-level production, export and import data for each country. Thus it will indicate United States wheat exports or Russian wheat imports, but not U.S. exports to Russia.
For this report we mainly used data for the year 1995. This is the most recent year for which FAOSTAT currently provides trade data. Thus, the tables are a one-year snapshot (with the exception of Table 5b). In general, this will suffice for our purposes, since most trade flows do not exhibit extreme year-to-year fluctuations. However, some do. 3
3 Table 5b and Figure 3c provide examples of large fluctuations.
The total quantity of imports on a worldwide basis should closely correspond to the total quantity of exports for a given commodity. Factors such as time lags in reporting, loss or destruction of traded goods en route and misclassification of a commodity between exporting and importing country can account for some of the differences. However, for a number of crops, percentage differences over 10% between world exports and imports were noted, suggesting significant data error. 4 In order to maintain a degree of consistency between import and export quantities without embarking on a major data-correction exercise, we adjusted import data by multiplying all import figures by the ratio of world exports to world imports for the crop in question.
4 In 1995, world net exports (exports minus imports) as a percentage of world exports, as reported in FAOSTAT, exceeded ten percent for the following categories: Beans, Dry; Beans, Green; Cow Peas, Dry; Jute; Millet; Pigeon Peas; Plantains; and Sweet Potatoes. Note that none of these commodities belongs to the top-ten of export commodities (ranked according to value of 1995 exports). (Note that in these footnotes, FAOSTAT crop categories are capitalized.)
Table 1 shows indicators of importance of selected crops in international trade. The table includes IARC crops as well as a few non-IARC crops. The latter, coffee, cocoa, grapes, jute, mangos and tea, are included for comparison purposes. 5
5 Some other important non-IARC crops, such as Sugar and Cotton, are not included in Table 1.
The table ranks crops according to value of world exports. Note that each border-crossing counts as trade. Sometimes commodities will be shipped from country A to country C via country B. In such cases, double-counting of exports and imports occurs. 6 In the third column of the table, a measure of the value of world output is provided. In order to value output, we use export prices 7. The fourth column lists world exports as a percentage of world output. Note that this percentage could conceivably be greater than 100 due to the aforementioned double-counting of exports. The fifth column lists value of output of developing countries, again valued at export prices. The sixth column shows output of developing countries as a percentage of world output.
6 Thus, in a sense, our figures provide upwardly biased estimates of trade volumes. However, it may be argued that for our specific purposes our figures are useful. Problems related to proprietary technology and genetic materials are more likely to occur in cases of multiple border crossings.7 Since FAOSTAT does not report dollar value of production of agricultural commodities, a price index was calculated for each commodity as (dollar value of exports)/(quantity of exports), using world totals. This ratio was used as a price for valuing quantities of each commodity in dollars. The FAOSTAT data consistently report exports using the FOB (free on board) valuation standard. Since exported goods tend to be of higher quality than average, and since transportation costs from the production center to port are presumably included in export price, an upward bias in calculated values of production is likely. The export price index of Rice (FAOSTAT code 042) was used to compute the value of Rice, Paddy in world output.
The final column gives net imports - defined as imports minus exports - of developed countries as a percentage of output of developing countries. This statistic tells us how significant is the overall South-North trade flow for developing countries. If it is a large positive percentage, we know that a large fraction of Southern output is exported to the North. One should, however, be cautious in interpreting this statistic, especially where it assumes negative or small positive values. For instance, for soybeans the statistic has a value of -3.1 %. To conclude that Southern exports of soybeans to the North are insignificant would be a mistake. As we see in the market share tables (Tables 3-10), the United States and Brazil are major exporters of soybeans, while the European Union is a major importer. In fact Brazil is a major exporter of soybeans to Europe, even though the overall trade flow of soybeans is from North to South.
Of all the crops listed in Table 1, only bananas, coffee, cocoa, and tea display large positive percentages in the last column; however, the latter three are not of immediate interest to us because they are non-IARC crops. As for bananas, unfortunately our data do not distinguish between cooking bananas and dessert bananas. Cooking bananas are predominantly for local consumption, whereas the international market for dessert bananas is relatively very large. This is an important distinction for our purposes, because in fact dessert bananas can hardly be considered an IARC crop - IARC banana research 8 focuses on cooking bananas. 9 Thus we can conclude that for none of the IARC crops there is a clear overall tendency for trade flows to be from South to North.
8 Two IARCs conduct Banana research: IPGRI/INIBAP (International Network for the Improvement of Banana and Plantain, a part of IPGRI, located in France) and IITA (International Institute for Tropical Agriculture, located in Nigeria).9 The research efforts of IPGRI/INIBAP and IITA are directed at cooking bananas (also known as "starch bananas"), not the dessert bananas (also called "sweet bananas") that dominate South-North trade.
Figure 1a shows a selection of eleven crops ranked according to value of world output. For each crop, it shows output and exports of the world and of developing countries, all in U.S. dollar terms. From this graph, it is evident that for most crops trade is dwarfed by output. In other words, the vast majority of IARC crop output is never traded across national borders.
Figure 1b displays only part of the information contained in figure la. It omits output and focuses entirely on exports. Among IARC crops, rice is by far developing countries' most significant export crop in value terms. In addition, Southern exports dominate international markets for cassava, groundnuts and beans.
Table 2 basically contains the same information as Table 1 (except for the fact that it omits non-IARC crops), but the crops are now arranged in a different way, namely by IARC 10
10 The classification by IARC relies in part on recent IARC reports. It is not exhaustive. As can be seen in the table, centers share responsibility for some crops.
Tables 3-10 and Figures 2-6 break world aggregates down into sub-aggregates for eight groups of countries: Low-Income Developing Countries 11; Brazil; China; Rest of Middle-Income Developing Countries 12; Transition Economies 13; United States; European Union 14; and Rest of Developed Countries 15 There is one Table for each group. The Figures focus on developing countries.
11 Our term "Countries" is not synonymous to "independent states". Developing Countries include Low-Income Developing Countries and Middle-Income Developing Countries. Low-Income Developing Countries include Afghanistan, Angola, Bangladesh, Benin, Bhutan, Burkina Faso, Burundi, Cambodia, Cape Verde, Central-African Republic, Chad, Comoros, Congo Democratic Republic, Djibouti, Equatorial Guinea, Eritrea, Ethiopia, Gambia, Guinea, Guinea-Bissau, Haiti, Kiribati, Laos, Lesotho, Liberia, Madagascar, Malawi, Maldives, Mali, Mauritania, Mozambique, Myanmar, Nepal, Niger, Rwanda, Samoa, Sao Tome and Principe, Sierra Leone, Solomon Islands, Somalia, Sudan, Tanzania, Togo, Tuvalu, Uganda, Vanuatu, Yemen, and Zambia.12 Middle-Income Developing Countries include Brazil, China, and the Rest of Middle-Income Developing Countries, which include American Samoa, Anguilla, Antigua and Barbuda, Argentina, Aruba, Bahamas, Bahrain, Barbados, Belize, Bermuda, Bolivia, Botswana, Bouvet Islands, British Indian Ocean Territory, British Virgin Islands, Brunei Darussalam, Cameroon, Canton Islands, Cayman Islands, Chile, Christmas Islands, Cocos Islands, Colombia, Congo Republic, Cook Islands, Costa Rica, Cote d'Ivoire, Cuba, Cyprus, Dominica, Dominican Republic, East Timor, Ecuador, Egypt, El Salvador, Falkland Islands, Fiji, French Guiana, French Polynesia, French South Territories, Gabon, Gaza Strip, Ghana, Greenland, Grenada, Guadeloupe, Guam, Guatemala, Guyana, Heard and McDonald Islands, Honduras, Hong Kong, India, Indonesia, Iran, Iraq, Jamaica, Johnston Islands, Jordan, Kenya, Korea (North), Korea (South), Kuwait, Lebanon, Libya, Macau, Malaysia, Malta, Marshall Islands, Martinique, Mauritius, Mayotte, Mexico, Micronesia, Midway Islands, Mongolia, Montserrat, Morocco, Namibia, Nauru, Netherlands Antilles, New Caledonia, Nicaragua, Nigeria, Niue, Norfolk Islands. Northern Marianas, Oman, Pakistan, Palau, Panama, Papua New Guinea, Paraguay, Peru, Phillipines, Pitcairn, Puerto Rico, Qatar, Reunion, Saint Lucia, Saudi Arabia, Senegal, Seychelles, Singapore, South Georgia, Sri Lanka, Saint Helena, Saint Kitts and Nevis, Saint Pierre and Miquelon, Saint Vincent, Suriname, Swaziland, Syria, Taiwan, Thailand, Tokelau, Tonga, Trinidad and Tobago, Tunisia, Turkey, Turks and Caicos Islands, U.S. Virgin Islands, United Arab Emirates, Uruguay, Venezuela, Vietnam, Wake Island, Wallis Island, Western Sahara, and Zimbabwe. Note that several Asian "tigers" as well as some oil-exporting countries (and perhaps some other countries like the Bahamas) might be more properly classified as high-income countries.
13 Transition Economies include Albania, Armenia, Azerbaijan, Belarus, Bosnia-Herzegovina, Bulgaria, Croatia, Czech Republic, Estonia, Georgia, Hungary, Kazakhstan, Kyrgyzstan, Latvia, Lithuania, Macedonia, Moldova Republic, Poland, Romania, Russian Federation, Slovakia, Slovenia, Tajikistan, Turkmenistan, Ukraine, Uzbekistan, and Yugoslavia.
14 The European Union includes Austria, Belgium, Denmark, Finland, France, Germany, Greece, Ireland, Italy, Luxembourg, Netherlands, Portugal, Spain, Sweden and United Kingdom.
15 Developed Countries include the European Union, the United States, and the Rest of Developed Countries. The Rest of Developed Countries include Andorra, Australia, Canada, Faeroe Islands, Gibraltar, Iceland, Israel, Japan, Liechtenstein, Monaco, New Zealand, Norway, San Marino, South Africa, Svalbard, Switzerland, and Vatican City.
Tables 3-10 provide market share measures for each of the eight groups. These were calculated using raw data from FAOSTAT on imports, exports and production, all measured in metric tons. 16 We obtained data for these groups of countries by adding up values for constituent countries. This approach is appropriate for production. With trade data, aggregate exports and imports (as separate items) fail to differentiate between trade within a group of nations and trade to nations outside the group. Again, this is a consequence of the fact that FAOSTAT does not provide bilateral trade data.
16 In some cases, we needed to make adjustments to commodity categories to make trade categories compatible with production categories:(1) There is a single category of Cassava in production data, and three categories (Dried, Starch and Tapioca) in trade data. For the group trade data we used the Dried Cassava category.(2) Only Green Coffee is represented in production data, while Green and Roast coffee are represented in trade data. Trade in Green and Roast Coffee is compared to production of Green Coffee.
(3) Groundnuts have a single category in production data but two in trade data (In-Shell and Shelled). Total (In-Shell and Shelled) Groundnut trade is compared to production of Groundnuts in Shell.
(4) Only Rice, Paddy is represented in production data, whereas trade data are for Rice (Total).
For each group of countries, we included only crops that are in one way or another significant. 17 The columns of Tables 3-10 are largely self-explanatory, except for the sixth column. FAOSTAT does not provide consumption data. We calculated "consumption" (C) quantities from the accounting identity C = Y + M - X, using the available data for production (Y), exports (X) and adjusted 18 imports (M). This approximation entails possible distortions due to commodity storage for consumption or export in a later period.
17 Crops for which all four percentages are below 5 % are omitted from Tables 3 - 10.18 Recall that we adjusted imports to make aggregate world imports match aggregate world exports. Combined with our method for computing consumption, this implies that aggregate output equals aggregate computed consumption.
In Table 3, we see that dry beans account for more exports (in value terms) from low-income developing countries than all other IARC crops combined. Another salient fact is that though exports from the poorest countries dominate international markets for cow peas and pigeon peas, the size of these markets is very small compared to international trade in many other crops. Figure 2a demonstrates that what is true for developing countries in general, namely that exports are only a small fraction of output of IARC crops, holds a fortiori for low-income developing countries. In figure 2b 19 we see that rice imports are by far the most significant feature of the poorest countries' trade in IARC crops.
19 Compared with Figure 2a, Figure 2b contains no additional information; it omits production.
Table 4 highlights the fact that soybeans are the only IARC crop of which Brazil - a major player in several non-IARC crop markets - is an important exporter.
Table 5 a shows that Chinese producers have significant international market shares mainly in beans, groundnuts, and sweet potatoes. Interestingly, notwithstanding the enormous Chinese production of rice, Chinese rice exports were relatively very small, and net Chinese rice exports were even negative, in 1995. At this point, however, the reader should be mindful of the perils of a one-year snapshot. As we see in Table 5b and Figure 3c, Chinese rice exports exhibit large fluctuations; for example, in 1994, they were almost ten times as large as in 1995. Relatively small fluctuations in Chinese output lead to large fluctuations in exports or imports for a number of crops. This is due to the fact that - once again - trade is small compared to output, as is demonstrated in Figure 3a. Finally, as most vividly illustrated in figure 3b, not only for rice, but for all four most important crops 20 in Chinese trade, exports were much smaller than imports in 1995. As we see in Figure 3c, China has been a major importer of wheat during the entire period 1986-1995.
20 Rice, Wheat, Maize, and Soybeans.
Next, consider Table 6, which provides information about the category of middle-income developing countries excluding China and Brazil. This is a very large and disparate group of countries 21 with a combined population of over two billion. Not surprisingly, the combined export market share of this group is significant for most IARC crops, most notably rice, cassava, groundnuts, and chickpeas. Net group exports of four of these five crops 22 are positive.
21 See footnote 11.22 Groundnuts being the exception.
In Figures 4a and 4b, Brazil is included in the group. 23 Figure 4a shows - again - that for all IARC crops, the vast majority of output is not traded internationally, the most extreme case in point being yams - an important crop in terms of output, but negligable in terms of international trade. Note that rice group output (in value terms) is vastly larger than group output of any other IARC crop. As shown in figure 4b, the only IARC crop whose group exports (in value terms) come anywhere close to those of rice is bananas. (But, as we noted above, the type of bananas that is usually traded internationally is not an IARC research priority.) Moreover, bananas and cassava are the only major export crops listed here for which group exports are much larger than group imports.
23 Only for Soybeans does this make a significant difference.!
Figures 5 and 6 show how world output and world exports, respectively, of some major IARC crops are divided among four groups of countries: low-income developing countries, 24 China, middle-income developing countries, 25 and the rest of the world. 26
24 See footnote 10.25 In Figures 4a, 4b, 5, and 6 Brazil is included in the category "Middle-Income Countries excluding China".
26 The "Rest of the World" category consists of all Developed Countries and Transition Economies.!
Table 7 provides market share data for the transition economies. Wheat and barley are the only major export crops for this group. Wheat exports stand out in value terms, while barley is the only other major crop of which this group is a somewhat significant net exporter. Group output of wheat, barley and potatoes is significant relative to world output.
Tables 8, 9, and 10 provide market share data for three groups of developed countries. Here, we are especially interested in net imports. 27 A measure of net imports is given by subtracting any percentage in the third column from the corresponding percentage in the fourth column 28 Thus, taking into account volume of trade (in value terms), we see in Table 8 that the European Union is a significant net importer of maize, bananas, groundnuts, soybeans, dry beans, cassava, and sorghum. Interestingly, inspection of Table 10 reveals that the category of other developed countries (which excludes the U.S.A. and the E.U.) exhibits the exact same pattern.
27 Note that if both imports and exports are large, it is likely that a large proportion of group trade is intra-group trade. This is especially true in the European Union, which is a geographically contiguous trading block. For example, most Potato trade of member countries of the European Union is with other member countries. The reader is also reminded that the last column of Table 1 provides information about aggregate net imports of all developed countries.28 The reader is reminded that we adjusted the raw imports data so that, by construction, aggregate world imports equal aggregate world exports.
Of these crops, maize and sorghum are not significant net export crops of developing countries; the United States dominate the international maize and sorghum markets. As for groundnuts and dry beans, combining information from Tables 8, 9, and 10, we see that although U.S. net exports of these crops are substantial, the combined net imports of the European Union and other developed countries are much larger. In the case of soybeans, the European Union and other developed countries are large net importers, while the United States dominate the international market. However, as reported above, Brazilian soybean exports are significant. From this data set, it is impossible to tell to what extent U.S. exports dominate other developed countries' import markets. Judging by FAOSTAT data, it may be that all of Brazil's exports go to developed countries, but it may also be that a large proportion of Brazil's exports goes to other middle-income developing countries. 29 However, it is well known that Brazil is a significant exporter of soybeans to developed countries. 30 Finally, there is a very clear pattern in international cassava trade: cassava is mainly exported by middle-income developing countries (excluding Brazil and China) to the European Union. The international cassava market is of intermediate size. 31
29 We currently do not have this information because FAOSTAT does not provide bilateral trade data.30 In the early 1970s, Brazil quickly established itself as a Soybean exporter to Japan and the European Union. One should always keep in mind that markets are dynamic. In the future, other challenges to currently dominant crop exporters will no doubt arise.
31 As Table 1 shows, world exports total a little over half a billion U.S. dollars.
Table 9 shows that the United States are a major net importer of bananas, plantains and yams. In these crops, international trade is clearly dominated by the category of middle-income developing countries, as can be seen in Table 6. As shown in Table 1, the international (predominantly non-IARC varieties) banana market is big, while international markets for plantains and yams are small.
We conclude our discussion of the tables and graphs with a few comments on rice. Rice is not only the world's most important crop in terms of output, but also the number one IARC crop in terms of developing countries' exports (see Table 6). However, most of these exports probably go to other developing countries (see also Table 3). Due to the lack of bilateral trade data in FAOSTAT, we are unable to quantify South-North rice trade here. From Table 8 we can infer that imports of the European Union's member countries from non-member countries comprise between 2.7% and 7.9% of world imports. Because U.S. net rice exports total 12.7% of world exports, a large proportion of E.U. imports may well be supplied by U.S. exporters. But we cannot exclude the possibility that total rice exports from developing to developed countries are significant. 32
32 Based on FAOSTAT, South-North Rice trade cannot exceed one billion U.S. dollars, and is likely to be substantially less and to comprise a number of distinct varieties.
It should be emphasized that the database used for this report, FAOSTAT, has some major limitations and flaws, the most important of which is its lack of bilateral trade data. 33 Nevertheless, (mainly) on the basis of FAOSTAT it is possible to draw some conclusions regarding the importance of South-North trade in IARC crops.
33 The currently available budget for this research project does not permit the purchase of COMTRADE, which is a data set offered by the United Nations Statistics Division. COMTRADE does provide bilateral trade data.
Of most IARC crops, only small percentages of world output are traded internationally. Notably, rice is perhaps the most important crop in the world, but only a small fraction of rice output is traded internationally. 34
34 Even so, Rice is the number four IARC crop in terms of value of world exports.
IARC crops exhibiting significant South-North trade flows include soybeans, dry beans, groundnuts, cassava, plantains, and yams, and perhaps rice 35 Among these, rice and soybeans are the only crops whose international markets are very large 36 relative to those of other crops. International trade in dry beans, groundnuts, and cassava is also sizeable. 37 Dry beans are the only IARC crop for which exports from the poorest category of countries - the low-income developing countries - are noteworthy. Finally, plantains and yams are mostly exported from middle-income developing countries to developed countries, but these international markets are small. 38
35 Bananas are not included in this listing, because dessert bananas are not a major focus of IARC research. The international market for dessert bananas is very large and clearly dominated by exports from developing countries.36 Total world trade in both Rice and Soybeans exceeds seven billion U.S. dollars. Due to the lack of bilateral trade data in FAOSTAT, we are currently unable to exactly quantify South-North tradeflows of Soybeans and Rice.
37 That is, between half a billion and one-and-half-billion U.S. dollars.
38 That is, less than one hundred million U.S. dollars.
The recent trade patterns reported here have one clear implication. The poorest countries are unlikely to be greatly exposed in the near term to accusations of intellectual property rights violations by their exports of IARC crops to the North.
For middle-income countries, problems might occur in some of the seven crops listed above. Investment in bilateral trade data might provide a more accurate picture of their potential exposure. We suggest that the Expert Panel consider the feasibility of estimating threshold values for exports to the North below which serious exposure to intellectual property challenges is unlikely.
Table 1: Indicators of Importance of Trade, 1995 (Values in US$ 1,000,000)
Note that non-IARC crops appearing in this table are italicized.
|
|
Value of World Exports |
Value of World Output |
World Exports/ |
Value of Output of Developing* |
Output of Developing*/ |
Net Imports of Developed*/ |
|
WHEAT |
16,564 |
91,096 |
18.2% |
42,766 |
46.9% |
-21.7% |
|
Coffee** |
12,209 |
16,960 |
72.0% |
16,954 |
100.0% |
56.9% |
|
MAIZE |
10,829 |
71,410 |
15.2% |
34,820 |
48.8% |
-15.4% |
|
SOYBEANS |
7,392 |
29,282 |
25.2% |
14,593 |
49.8% |
-3.1% |
|
RICE** |
7,297 |
179,858 |
4.1% |
171,495 |
95.4% |
-1.0% |
|
BANANAS |
4,620 |
19,820 |
23.3% |
19,510 |
98.4% |
15.6% |
|
BARLEY |
2,669 |
20,220 |
13.2% |
3,884 |
19.2% |
-23.0% |
|
Cocoa Beans |
2,459 |
3,958 |
62.1% |
3,958 |
100.0% |
49.0% |
|
POTATOES |
2,273 |
91,718 |
2.5% |
32,913 |
35.9% |
0.0% |
|
Tea |
2,267 |
5,093 |
44.5% |
4,811 |
94.5% |
14.8% |
|
Grapes |
1,943 |
57,097 |
3.4% |
17,639 |
30.9% |
1.5% |
|
BEANS, DRY |
1,256 |
9,031 |
13.9% |
7,830 |
86.7% |
2.5% |
|
GROUNDNUTS** |
1,033 |
22,435 |
4.6% |
21,044 |
93.8% |
4.1% |
|
SORGHUM |
839 |
6,891 |
12.2% |
5,144 |
74.6% |
-5.0% |
|
CASSAVA** |
638 |
22,492 |
2.8% |
22,492 |
100.0% |
1.8% |
|
Mangos |
297 |
18,762 |
1.6% |
18,692 |
99.6% |
0.9% |
|
LENTILS |
280 |
1,277 |
21.9% |
1,023 |
80.1% |
-7.4% |
|
CHICK-PEAS |
248 |
7,256 |
3.4% |
6,973 |
96.1% |
0.8% |
|
BEANS, GREEN |
192 |
4,095 |
4.7% |
2,682 |
65.5% |
2.3% |
|
Jute |
102 |
736 |
13.9% |
736 |
100.0% |
1.5% |
|
PLANTAINS |
67 |
14,351 |
0.5% |
14,351 |
100.0% |
0.3% |
|
MILLET |
57 |
5,956 |
1.0% |
5,712 |
95.9% |
0.4% |
|
SWEET POTATOES |
34 |
37,647 |
0.1% |
37,116 |
98.6% |
0.0% |
|
YAMS |
21 |
25,575 |
0.1% |
25,414 |
99.4% |
0.1% |
|
COW PEAS, DRY |
5 |
533 |
0.9% |
524 |
98.3% |
0.0% |
|
PIGEON PEAS |
2 |
833 |
0.2% |
833 |
100.0% |
0.0% |
* See footnotes 11,12,14, and 15 for definitions of the Developed and Developing categories.
** Production data are for Coffee, Green; Rice, Paddy; Groundnuts in Shell; and Cassava. Trade data are for Coffee, Green and Roast; Rice (Total); Groundnuts, Shelled plus Groundnuts In Shell; and Dried Cassava.
Table 2: Indicators of Importance of Trade (crops are sorted by IARCs*), 1995 (Values in US$ 1,000,000)
|
Research Center |
|
Value of World Exports |
Value of World Output |
World Exports/ |
Value of Output of Developing** |
Output of Developing**/ |
Net Imports of Developed**/ |
|
CIAT |
RICE*** |
7,297 |
179,858 |
4.1% |
171,495 |
95.4% |
-1.0% |
|
BEANS, DRY |
1,256 |
9,031 |
13.9% |
7,830 |
86.7% |
2.5% |
|
|
CASSAVA*** |
638 |
22,492 |
2.8% |
22,492 |
100.0% |
1.8% |
|
|
BEANS, GREEN |
192 |
4,095 |
4.7% |
2,682 |
65.5% |
2.3% |
|
|
CIMMYT |
WHEAT |
16,564 |
91,096 |
18.2% |
42,766 |
46.9% |
-21.7% |
|
MAIZE |
10,829 |
71,410 |
15.2% |
34,820 |
48.8% |
-15.4% |
|
|
BARLEY |
2,669 |
20,220 |
13.2% |
3,884 |
19.2% |
-23.0% |
|
|
CIP |
POTATOES |
2,273 |
91,718 |
2.5% |
32,913 |
35,9% |
0.0% |
|
SWEET POTATOES |
34 |
37,647 |
0.1% |
37,116 |
98.6% |
0.0% |
|
|
ICARDA |
WHEAT |
16,564 |
91,096 |
18.2% |
42,766 |
46.9% |
-21.7% |
|
BARLEY |
2,669 |
20,220 |
13.2% |
3,884 |
19.2% |
-23.0% |
|
|
BEANS, DRY |
1,256 |
9,031 |
13.9% |
7,830 |
86.7% |
2.5% |
|
|
CHICK-PEAS |
248 |
7,256 |
3.4% |
6,973 |
96.1% |
0.8% |
|
|
BEANS, GREEN |
192 |
4,095 |
4.7% |
2,682 |
65.5% |
2.3% |
* IARCs (International Agricultural Research Centers) are in alphabetical order; crops for each IARC are ranked by Value of World Exports** See footnotes 11, 12, 14 and 15 for definitions of the Developed and Developing categories.
*** Production data are for Rice, Paddy; Groundnuts in Shell; and Cassava. Trade data are for Rice (Total); Groundnuts, Shelled plus Groundnuts In Shell; and Dried Cassava.
Table 2 (continued): Indicators of Importance of Trade (crops are sorted by IARCs*), 1995 (Values in US$ 1,000,000)
|
Research Center |
|
Value of World Exports |
Value of World Output |
World Exports/ |
Value of Output of Developing** |
Output of Developing**/ |
Net Imports of Developed**/ |
|
ICRISAT |
GROUNDNUTS*** |
1,033 |
22,435 |
4.6% |
21,044 |
93.8% |
4.1% |
|
SORGHUM |
839 |
6,891 |
12.2% |
5,144 |
74.6% |
-5.0% |
|
|
CHICK-PEAS |
248 |
7,256 |
3.4% |
6,973 |
96.1% |
0.8% |
|
|
MILLET |
57 |
5,956 |
1.0% |
5,712 |
95.9% |
0.4% |
|
|
PIGEON PEAS |
2 |
833 |
0.2% |
833 |
100.0% |
0.0% |
|
|
IITA |
MAIZE |
10,829 |
71.410 |
15.2% |
34,820 |
48.8% |
-15.4% |
|
SOYBEANS |
7,392 |
29,282 |
25.2% |
14,593 |
49.8% |
-3.1% |
|
|
RICE*** |
7,297 |
179,858 |
4.1% |
171,495 |
95.4% |
-1.0% |
|
|
BANANAS**** |
4,620 |
19,820 |
23.3% |
19,510 |
98.4% |
15.6% |
|
|
CASSAVA*** |
638 |
22,492 |
2.8% |
22,492 |
100.0% |
1.8% |
|
|
YAMS |
21 |
25,575 |
0.1% |
25,414 |
99.4% |
0.1% |
|
|
COW PEAS, DRY |
5 |
533 |
0.9% |
524 |
98.3% |
0.0% |
|
|
IPGRI/INIBAP |
BANANAS**** |
4,620 |
19,820 |
23.3% |
19,510 |
98.4% |
15.6% |
|
IRRI |
RICE*** |
7,297 |
179.858 |
4.1% |
171,495 |
95.4% |
-1.0% |
|
WARDA |
|
|
|
|
|
|
|
* IARCs (International Agricultural Research Centers) are in alphabetical order; crops for each IARC are ranked by Value of World Exports** See footnotes 11, 12,14 and 15 for definitions of the Developed and Developing categories.
*** Production data are for Rice, Paddy; Groundnuts in Shell; and Cassava. Trade data are for Rice (Total); Groundnuts, Shelled plus Groundnuts In Shell; and Dried Cassava.
**** The FAOSTAT database does not distinguish between cooking bananas and dessert bananas. IARC banana research focuses on cooking bananas which are predominantly for local consumption, rather than the dessert bananas that are traded internationally in large quantities.
Table 3: Market Share Data for Low-Income Developing Countries*, 1995
|
|
Group Exports |
Group Exports per capita |
Group Exports/ |
Group Imports/ |
Group Output/ |
Group Consumption/ |
|
BEANS, DRY |
277,958 |
$0.48 |
27.3% |
6.8% |
16.6% |
13.7% |
|
RICE** |
79,384 |
0.14 |
1.6% |
14.1% |
11,0% |
11.5% |
|
SORGHUM |
47,431 |
0.08 |
5.3% |
3.0% |
18.0% |
17.7% |
|
GROUNDNUTS** |
17,509 |
0.03 |
1.7% |
1.1% |
11.5% |
11.4% |
|
BANANAS |
10,671 |
0.02 |
0.2% |
0.1% |
9.6% |
9.6% |
|
MILLET |
6,180 |
0.01 |
16.9% |
0.6% |
24.4% |
24.2% |
|
COW PEAS, DRY |
3,400 |
0.01 |
91.0% |
0.0% |
26.9% |
26.1% |
|
CASSAVA** |
2,265 |
0 |
0.7% |
0.0% |
25.2% |
25.2% |
|
PIGEON PEAS |
1,900 |
0 |
99.6% |
5.2% |
14.2% |
14.0% |
|
LENTILS |
1,119 |
0 |
0.4% |
2.1% |
10.7% |
11.0% |
|
YAMS |
4 |
0 |
0.1% |
3.5% |
10.8% |
10.8% |
|
SWEET POTATOES |
2 |
0 |
0.0% |
0.1% |
5.1% |
5.1%, |
|
PLANTAINS |
0 |
0 |
0.0% |
0.0% |
53.6% |
53,6% |
* For a listing of countries in Low-Income Developing category, see footnote 11.
** Production data are for Rice, Paddy; Groundnuts In Shell; and Cassava. Trade data are for Rice (Total); Groundnuts, Shelled plus Groundnuts In Shell; and Dried Cassava.
Table 4: Market Share Data for Brazil, 1995
|
|
Domestic Exports |
Domestic Exports per capita |
Domestic Exports/ |
Domestic Imports/ |
Domestic Output/ |
Domestic Consumption/ |
|
SOYBEANS |
770,426 |
$4.84 |
10.9% |
2.6% |
20.3% |
18.2% |
|
MAIZE |
5,315 |
0.03 |
0.0% |
1.7% |
7.1% |
7.3% |
|
BANANAS |
3,907 |
0.02 |
0.1% |
0.0% |
10.3% |
10.3% |
|
YAMS |
1,310 |
0.01 |
5.9% |
0.0% |
0.7% |
0.7% |
|
BEANS, DRY |
1,016 |
0.01 |
0.0% |
9.1% |
16.3% |
17.6% |
|
WHEAT |
16 |
0 |
0.0% |
6.0% |
0.3% |
1.4% |
|
CASSAVA |
0 |
0 |
0.0% |
0.0% |
15.4% |
15.4% |
Table 5a: Market Share Data for China, 1995
|
|
Domestic Exports |
Domestic Exports per capita |
Domestic Exports/ |
Domestic Imports/ |
Domestic Output/ |
Domestic Consumption/ |
|
BEANS, DRY |
262,819 |
$0.22 |
26.5% |
2.0% |
7.8% |
4.4% |
|
GROUNDNUTS* |
256,879 |
0.21 |
24.9% |
0.1% |
35.8% |
34.5% |
|
SOYBEANS |
99,696 |
0.08 |
1.2% |
8.6% |
10.7% |
12.6% |
|
RICE* |
56,486 |
0.05 |
1.0% |
7.7% |
33.9% |
34.2% |
|
BANANAS |
32,611 |
0.03 |
0.3% |
1.2% |
5.8% |
6.0% |
|
MAIZE |
13,256 |
0.01 |
0.1% |
15.2% |
21.8% |
24.1% |
|
SORGHUM |
13,005 |
0.01 |
1.5% |
0.5% |
8.9% |
8.8% |
|
LENTILS |
11,473 |
0.01 |
7.4% |
0.2% |
4.1% |
2.5% |
|
SWEET POTATOES |
6,867 |
0.01 |
34.5% |
0.0% |
86.4% |
86.4% |
|
POTATOES |
5,800 |
0 |
0.4% |
0.0% |
16.0% |
16.0% |
|
MILLET |
3,740 |
0 |
7.2% |
0.9% |
11.8% |
11.7% |
|
WHEAT |
1,559 |
0 |
0.0% |
12.4% |
18.8% |
21.1% |
|
BARLEY |
280 |
0 |
0.0% |
6.9% |
3.2% |
4.2% |
|
CASSAVA* |
227 |
0 |
0.0% |
13.4% |
2.1% |
2.5% |
* Production data are for Rice, Paddy; Groundnuts In Shell; and Cassava. Trade data are for Rice (Total); Groundnuts, Shelled plus Groundnuts In Shell; and Dried Cassava.
Table 5b: Chinese Trade in Wheat and Rice, 1986-1995
|
Year |
Wheat IMPORTS |
Wheat EXPORTS |
Rice IMPORTS |
Rice EXPORTS |
|
1986 |
936,329 |
570 |
51,233 |
211,264 |
|
1987 |
1,484,326 |
748 |
83,110 |
220,404 |
|
1988 |
1,891,441 |
885 |
76,184 |
204,199 |
|
1989 |
2,757,839 |
239 |
305,076 |
111,574 |
|
1990 |
2,319,117 |
559 |
12,755 |
97,990 |
|
1991 |
1,600,026 |
265 |
40,987 |
181,784 |
|
1992 |
1,663,219 |
298 |
40,317 |
232,897 |
|
1993 |
1,007,715 |
8,238 |
36,628 |
266,222 |
|
1994 |
1,177,918 |
10,055 |
143,490 |
533,138 |
|
1995 |
2,253,067 |
1,559 |
435,273 |
56,486 |
Table 6: Rest of Middle-Income Developing Countries* (excluding Brazil and China)
|
|
Group Exports |
Group Exports per capita |
Group Exports/ |
Group Imports/ |
Group Output/ |
Group Consumption/ |
|
RICE** |
4,972,253 |
$2.04 |
75.1% |
57.8% |
48.4% |
47.7% |
|
BANANAS |
3,244,814 |
1.33 |
85.9% |
10.4% |
72.8% |
54.9% |
|
WHEAT |
1,378,857 |
0.57 |
9.0% |
43.3% |
26.7% |
33.2% |
|
MAIZE |
909,918 |
0.37 |
9.2% |
40.2% |
16.9% |
21.6% |
|
SOYBEANS |
801,690 |
0.33 |
12.8% |
19.2% |
18.7% |
20.3% |
|
CASSAVA** |
506,677 |
0.21 |
92.7% |
4.6% |
57.3% |
55.1% |
|
POTATOES |
370,503 |
0.15 |
17.4% |
15.0% |
17.2% |
17.1% |
|
GROUNDNUTS** |
336,287 |
0.14 |
32.5% |
34.0% |
46.0% |
45.9% |
|
BEANS, DRY |
296,447 |
0.12 |
19.5% |
39.3% |
46.0% |
48.8% |
|
CHICK-PEAS |
204,438 |
0.08 |
77.8% |
52.8% |
91.7% |
90.8% |
|
BARLEY |
107,359 |
0.04 |
6.5% |
38.8% |
14.7% |
19.2% |
|
LENTILS |
104,805 |
0.04 |
31.1% |
60.6% |
65.4% |
71.9% |
|
SORGHUM |
38,734 |
0.02 |
4.9% |
38.6% |
47.4% |
51.5% |
|
PLANTAINS |
36,456 |
0.01 |
75.0% |
13.0% |
46.4% |
46.2% |
|
YAMS |
19,374 |
0.01 |
93.8% |
2.0% |
87.9% |
87.9% |
|
MILLET |
8,823 |
0 |
19.4% |
19.7% |
59.8% |
59.8% |
|
SWEET POTATOES |
6,859 |
0 |
23.0% |
10.9% |
6.6% |
6.6% |
|
COW PEAS, DRY |
26 |
0 |
0.1% |
95.7% |
71.3% |
72.2% |
|
PIGEON PEAS |
18 |
0 |
0.4% |
94.8% |
85.8% |
86,0% |
* For a listing of countries in Middle-Income Developing category, see footnote 12.
** Production data are for Rice, Paddy; Groundnuts In Shell; and Cassava. Trade data are for Rice (Total); Groundnuts, Shelled plus Groundnuts In Shell; and Dried Cassava.
Table 7: Market Share Data for Transition Economies* 1995
|
|
Group Exports |
Group Exports per capita |
Group Exports/ |
Group Imports/ |
Group Output/ |
Group Consumption/ |
|
WHEAT |
1,211,517 |
$2.92 |
9.8% |
6.8% |
17.6% |
17.1% |
|
BARLEY |
292,452 |
0.71 |
18.7% |
10.0% |
30.5% |
29.3% |
|
MAIZE |
188,813 |
0.46 |
1.3% |
1.4% |
6.4% |
6.4% |
|
POTATOES |
71,249 |
0.17 |
5.3% |
7.2% |
37.0% |
37.0% |
|
BANANAS |
47,417 |
0.11 |
0.8% |
10.8% |
0.0% |
2.4% |
|
MILLET |
8,054 |
0.02 |
18.4% |
1.6% |
3.2% |
3.0% |
|
GROUNDNUTS** |
2,055 |
0 |
0.2% |
5.1% |
0.0% |
0.3% |
* For a listing of countries in Transition Economies category, see footnote 13.
** Production data are for Groundnuts In Shell; trade data are for Groundnuts, Shelled plus Groundnuts In Shell.
Table 8: Market Share Data for European Union*, 1995
|
|
Group Exports |
Group Exports per capita |
Group Exports/ |
Group Imports/ |
Group Output/ |
Group Consumption/ |
|
WHEAT |
4,772,843 |
$12.84 |
25.4% |
17.5% |
16.1% |
14.6% |
|
MAIZE |
1,949,614 |
5.24 |
9.6% |
14.4% |
5.9% |
6.7% |
|
POTATOES |
1,630,943 |
4.39 |
64.8% |
67.2% |
16.1% |
16.2% |
|
BARLEY |
1,602,311 |
4.31 |
46.4% |
25.7% |
30.4% |
27.5% |
|
BANANAS |
1,175,799 |
3.16 |
9.8% |
36.7% |
0.7% |
7.1% |
|
RICE** |
946,427 |
2.55 |
5.2% |
7.9% |
0.4% |
0.5% |
|
GROUNDNUTS** |
159,496 |
0.43 |
15.4% |
42.4% |
0.0% |
1.5% |
|
SOYBEANS |
106,417 |
0.29 |
1.2% |
50.1% |
0.8% |
13.2% |
|
BEANS, DRY |
101,700 |
0.27 |
4.5% |
24.7% |
0.8% |
3.6% |
|
CASSAVA** |
48,735 |
0.13 |
6.6% |
80.7% |
0.0% |
1.8% |
|
SORGHUM |
40,900 |
0.11 |
2.7% |
13.4% |
0.9% |
2.2% |
|
PLANTAINS |
30,782 |
0.08 |
24.9% |
14.8% |
0.0% |
0.0% |
|
MILLET |
14,786 |
0.04 |
10.2% |
55.1% |
0.0% |
0.4% |
|
CHICK-PEAS |
13,078 |
0.04 |
3.8% |
36.9% |
0.5% |
1.7% |
|
LENTILS |
9,895 |
0.03 |
2.7% |
31.0% |
0.5% |
6.7% |
|
SWEET POTATOES |
9,492 |
0.03 |
25.6% |
72.7% |
0.0% |
0.1% |
* For a listing of member countries of the European Union, see footnote 14.
** Production data are for Rice, Paddy; Groundnuts In Shell; and Cassava. Trade data are for Rice (Total); Groundnuts, Shelled plus Groundnuts In Shell; and Dried Cassava.
Table 9: Market Share Data for the USA, 1995
|
|
Domestic Exports |
Domestic Exports per capita |
Domestic Exports/ |
Domestic Imports/ |
Domestic Output/ |
Domestic Consumption/ |
|
MAIZE |
7,534,947 |
$28.21 |
77.0% |
0.4% |
36.4% |
24.8% |
|
WHEAT |
5,457,780 |
20.43 |
31.6% |
1.5% |
10.9% |
5.2% |
|
SOYBEANS |
5,427,678 |
20.32 |
71.6% |
0.4% |
46.9% |
28.9% |
|
RICE* |
996,530 |
3.73 |
13.7% |
1.0% |
1.4% |
0.9% |
|
SORGHUM |
682,105 |
2.55 |
83.8% |
0.0% |
21.4% |
11.2% |
|
GROUNDNUTS* |
221,274 |
0.83 |
21.4% |
2.3% |
5.4% |
4.6% |
|
BEANS, DRY |
212,817 |
0.8 |
14.8% |
1.9% |
7.7% |
5.9% |
|
BANANAS |
200,954 |
0.75 |
2.9% |
29.4% |
0.0% |
6.3% |
|
BARLEY |
178,142 |
0.67 |
6.2% |
5.0% |
5.5% |
5.3% |
|
POTATOES |
83,172 |
0.31 |
3.6% |
4.3% |
7.1% |
7.1% |
|
LENTILS |
38,919 |
0.15 |
13.6% |
0.8% |
3.3% |
0.5% |
|
MILLET |
11,005 |
0.04 |
21.7% |
0.5% |
0.7% |
0.5% |
|
SWEET POTATOES |
8,000 |
0.03 |
9.7% |
6.8% |
0.4% |
0.4% |
|
COW PEAS, DRY |
1,438 |
0.01 |
8.9% |
4.3% |
0.1% |
0.0% |
|
PLANTAINS |
0 |
0 |
0.0% |
71.9% |
0.0% |
0.3% |
|
YAMS |
0 |
0 |
0.0% |
92.2% |
0.0% |
0.1% |
* Production data are for Rice, Paddy and for Groundnuts In Shell. Trade data are for Rice (Total) and for Groundnuts, Shelled plus Groundnuts In Shell.
Table 10: Market Share Data for Rest of Developed Economies* (excluding USA and European Union), 1995
|
|
Group Exports |
Group Exports per capita |
Group Exports/ |
Group Imports/ |
Group Output/ |
Group Consumption/ |
|
WHEAT |
4,147,700 |
$17.63 |
24.2% |
8.3% |
8.4% |
5.4% |
|
BARLEY |
538,216 |
2.29 |
22.1% |
12.5% |
14.4% |
13.0% |
|
MAIZE |
236,883 |
1.01 |
2.5% |
25.0% |
2.5% |
5.9% |
|
SOYBEANS |
172,006 |
0.73 |
2.1% |
18.2% |
2.0% |
6.1% |
|
POTATOES |
147,718 |
0.63 |
8.2% |
4.8% |
4.0% |
3.9% |
|
LENTILS |
113,894 |
0.48 |
44.7% |
2.1% |
15.7% |
6.4% |
|
BEANS, DRY |
96,703 |
0.41 |
6.8% |
15.0% |
2.3% |
3.5% |
|
GROUNDNUTS** |
37,169 |
0.16 |
3.6% |
14.8% |
0.7% |
1.3% |
|
CHICK-PEAS |
18,202 |
0.08 |
12.4% |
3.3% |
3.3% |
3.0% |
|
SORGHUM |
16,247 |
0.07 |
1.8% |
44.4% |
2.9% |
8.1% |
|
MILLET |
4,786 |
0.02 |
6.3% |
18.4% |
0.2% |
0.3% |
|
SWEET POTATOES |
1,822 |
0,01 |
2.9% |
9.0% |
0.9% |
0.9% |
|
BANANAS |
902 |
0 |
0.0% |
11.4% |
0.8% |
3.5% |
* For a listing of countries in the Rest-of-Developed category, see footnote 15.
** Production data are for Groundnuts in Shell; trade data are for Groundnuts, Shelled plus Groundnuts In Shell.
[Figure 1a] Production and Exports (World vs. Developing Countries), 1995
[Figure 1b] Exports (World vs. Developing Countries), 1995
[Figure 2a] Production and Trade (Low-Income Countries), 1995
[Figure 2b] Trade (Low-Income Countries), 1995
[Figure 3a] Production and Trade (China), 1995
[Figure 3b] Trade (China), 1995
[Figure 3c] Fluctuation of Chinese Trade in Wheat and Rice
[Figure 4a] Production and Trade (Middle-Income Countries excluding China), 1995
[Figure 4b] Trade (Middle-Income Countries excluding China), 1995
[Figure 5] Production by Groups of Countries, 1995
[Figure 6] Exports by Groups of Countries, 1995
![]()
![]()
![]()
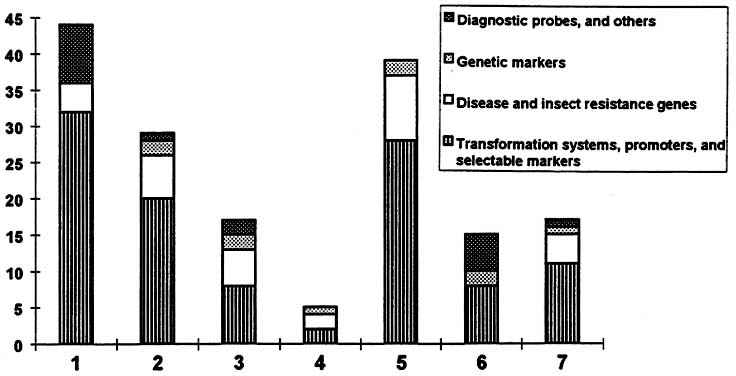
![[Figure 1a] Production and Exports (World vs. Developing Countries), 1995](w8425e01.jpg)
![[Figure 1b] Exports (World vs. Developing Countries), 1995](w8425e02.jpg)
![[Figure 2a] Production and Trade (Low-Income Countries), 1995](w8425e03.jpg)
![[Figure 2b] Trade (Low-Income Countries), 1995](w8425e04.jpg)
![[Figure 3a] Production and Trade (China), 1995](w8425e05.jpg)
![[Figure 3b] Trade (China), 1995](w8425e06.jpg)
![[Figure 3c] Fluctuation of Chinese Trade in Wheat and Rice](w8425e03.gif)
![[Figure 4a] Production and Trade (Middle-Income Countries excluding China), 1995](w8425e07.jpg)
![[Figure 4b] Trade (Middle-Income Countries excluding China), 1995](w8425e08.jpg)
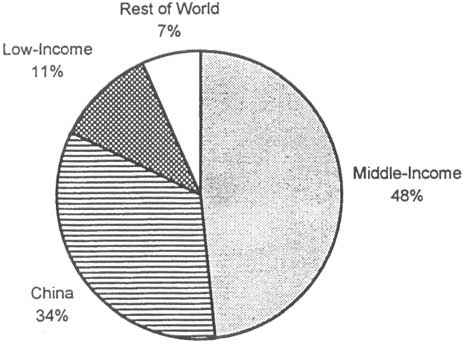
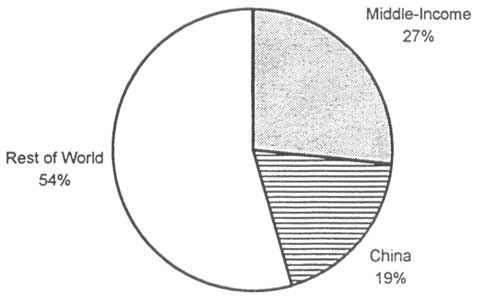
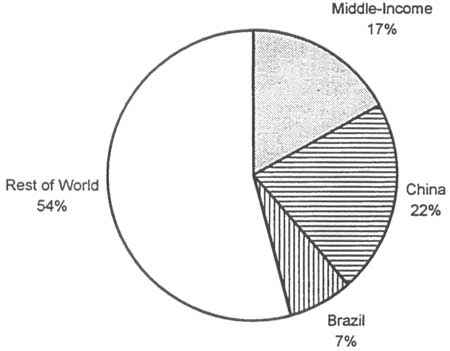
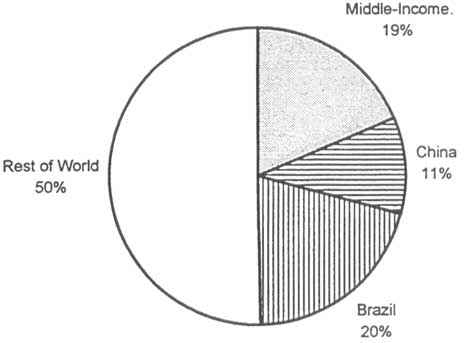
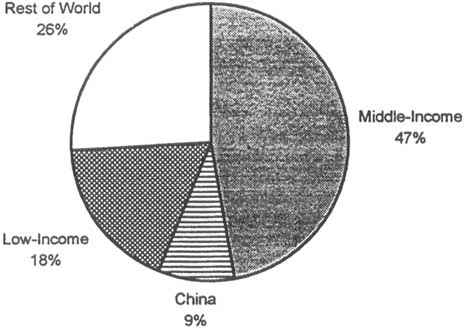
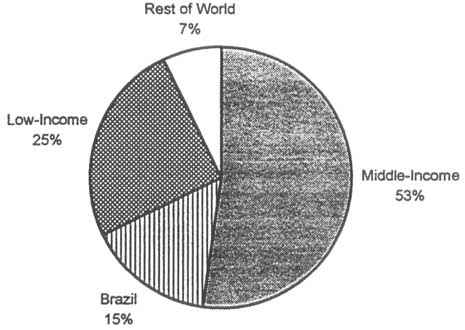
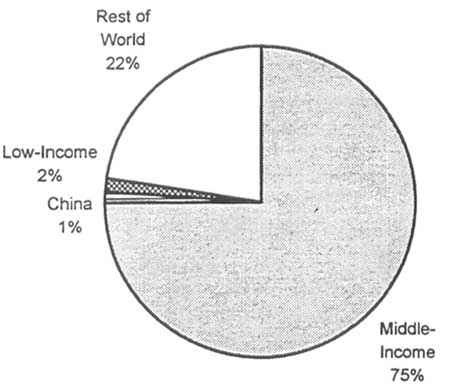
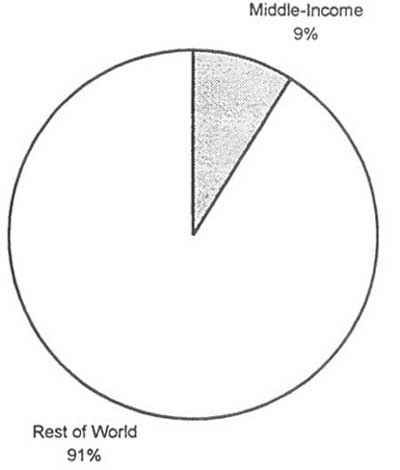
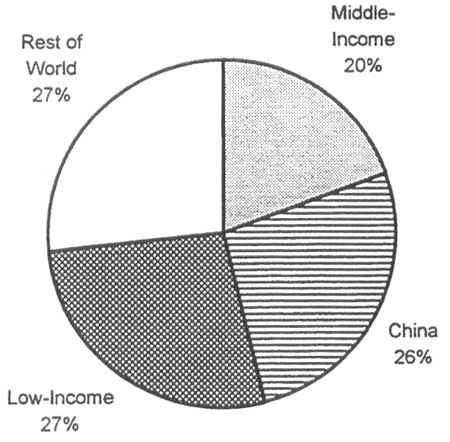
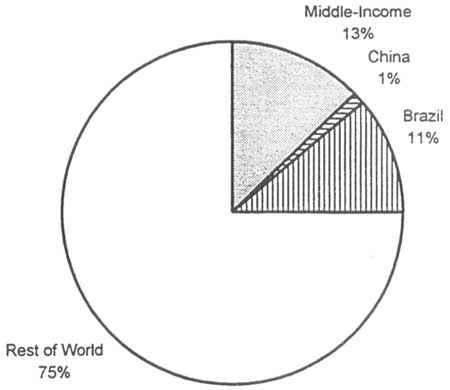
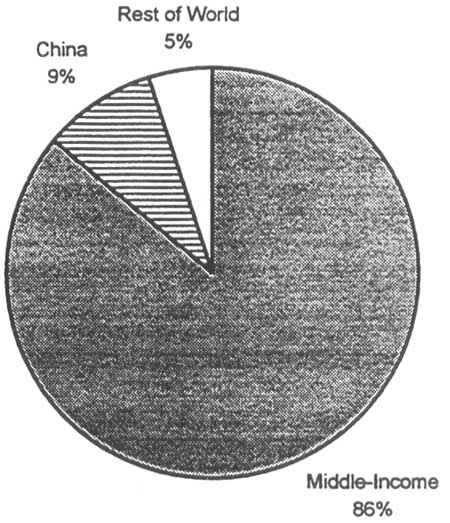