


Changes in demand and supply
Changes in policy and other factors
Changes in import prices and exchange rates
Overvalued exchange rate
An increase in dairy imports is a common feature in many African countries, and thus it may be assumed that there are common factors causing it. In this chapter, the potential reasons for the increases are discussed with general reference to various countries. Chapter 7 gives some details on two countries, Nigeria and Mali.
A comprehensive analysis of the effects of increased dairy imports into sub-Saharan Africa is not possible for two reasons. First, the available data base for dairy production, human nutrition levels and household incomes is weak and, consequently, unable to reflect the changes expected from increased dairy imports. There is also the problem of time-lag between the changes in price patterns induced by increased imports and the production modifications in response to them. Second, the effects of dairy import policy on consumer and producer welfare are influenced by a number of other policies which have not been considered in this study.
According to the basic theory on market equilibrium, consumption during any period of time is equal to domestic production plus net imports (plus any net change in stocks, but this will be ignored). In this section it is assumed that:
· consumption is wholly composed of market demand (i.e. non-market elements such as free school milk and other social programmes are excluded), and that· market demand and domestic supply are not influenced by the level of imports, which means that imports are treated as a residual to fill the gap between supply and demand.
Discussion in Chapters 3 and 5 has shown that the second assumption is not quite true. Governments may interfere directly or indirectly with imports, such that the levels of imports are partly determined by factors exogenous to market supply and demand, and these factors must be quantified and explained. To do that the actual levels of dairy imports into sub-Saharan Africa are compared with the quantity of imports necessary to fill the gap between domestic supply and demand. The actual development of dairy imports as affected by policy is then compared with a theoretical one which assumes that imports change only as a function of changes in domestic demand and supply. This calculation is done on a per country basis below.
Although population growth and rising real incomes are generally assumed to be the main factors stimulating demand, changes in real consumer prices and the possible effects of urbanisation must also be taken into account. The human population of sub-Saharan Africa increased by 2.9% on average each year between 1970 and 1980 (World Bank, 1981). If all other factors remained constant, and assuming no alteration in consumption caused by changes in age distribution, the demand for milk should have increased at the same rate as the population13.
13 A changing age distribution could have influenced the demand for milk if the proportion of children in the population increased and they consumed more milk per person than adults. But since no empirical data exist, a population elasticity of demand equal to 1 will be assumed.
Over the same period, incomes (measured as GNP per capita) increased annually by an average of 0.8% in sub-Saharan Africa (World Bank, 1981). Part of this additional income was probably spent on milk products. The increase in the demand for milk due to rising incomes can be calculated from the income elasticity of the quantitative demand for milk in sub-Saharan Africa, estimated in the mid-1970s (FAO, 1978b) to be 0.68.
Based on this income elasticity of demand, an annual growth rate of about 0.54% could be expected (0.8 × 0.68). There are, however, several complicating factors, for consumers differ according to their rural or urban status and income, and their preferences change over time. Furthermore, different dairy products have different income elasticities. The income elasticity of 0.68 is, therefore, only a rough indication of the general relationship between incomes and the demand for dairy products.
The data base is inadequate to calculate the income elasticities of milk demand for individual African countries and different products. But when the effects of population growth (2.9%) and of increased per capita income (0.54%) are added, it is obvious that the demand for dairy products in sub-Saharan Africa should have increased by an average of about 3.4% per annum during the 1970s.
The effect of retail price changes on the consumption of milk is well defined in economic theory: rising prices with a normally shaped demand function will lead to a decrease in consumption, and vice versa. The extent of the change is determined by the price elasticity of demand. But while cross-price elasticities could in theory indicate the effects on consumption of the changing prices of commodities which are complementary to or substitute for milk, in practice there are several problems.
First, milk is not a homogeneous product and qualitative differences in fat content, purity, freshness and taste are likely to lead to substantial price differences. Reconstituted milk often cannot compete at the same price as fresh milk because, allegedly, it is of poorer quality. Second, the effect of price on consumption also depends on the distribution systems for milk and dairy products. In most sub-Saharan African countries, petty traders compete with cooperatives and/or parastatals and each tends to provide different services to the consumers, which, combined with differences in product quality, can have important implications on the price elasticity of demand for milk.
Finally, there is the problem of insufficient information on retail prices and their fluctuations. In most African countries, no single price can be established because of the diversity of distribution channels. Some tentative calculations on price ratios and exchange rates are given later, but the information is inadequate to quantify the effects of changing consumer prices on the demand for milk. The effects of changes in import prices and exchange rates are discussed below.
Migration of people from rural to urban areas is often quoted as a major factor determining the demand for food. But while rapid urbanisation may change consumption patterns, it certainly boosts demand for imported foodstuffs, since the change of status from rural subsistence to that of the urban dweller would seem to force people to meet most of their food requirements in the market place. In most sub-Saharan African countries it is easier to import milk products than to provide them locally, given the state of existing marketing channels and general infrastructure.
According to the World Bank (1981), urban population in sub-Saharan Africa increased during 1970-80 by 6% annually, and by as much as 8.5% a year in 35 major capitals. There are, however, no empirical data available to relate this growth rate to an increasing demand for dairy products, particularly imports.
A number of causal factors affect domestic supply, none of which has ever been quantified. The change in total domestic milk supply in any one period is a function of changes in the accessible production technology; in production costs (both absolute and in relation to other products); in the ratio between effective producer prices for milk and other agricultural products; and of the influences of weather and other unforeseen factors. The difficulties in finding quantitative evidence for these factors are partly methodological (e.g. how to quantify changes in technology) and partly empirical (e.g. how to establish effective farm-gate prices at statistically representative levels).
A further complication arises from the fact that different production systems react in various ways to changes in the relevant factors. This is particularly true in respect of the producer price for milk. Rodriguez (1986) quantified the short-term price elasticity of supply for commercial milk producers in Zimbabwe at +0.63, but found only qualitative evidence for the reaction of communal farmers.
The majority of milk producers in Africa are rural producer/consumers such as the communal farmers of Zimbabwe. These farmers belong to a system where a high, if not dominant, proportion of the milk produced is used for their own subsistence, making it difficult to determine their reaction to changing producer prices. This could be done using the ratio between milk and cereal prices, but very little is known about the size, or even the sign (positive or negative), of the cross price elasticities of either demand or supply.
In view of the practical problems in quantifying the factors affecting domestic milk supply in sub-Saharan Africa, and the difficulties of covering even one country satisfactorily, domestic milk production has been treated as an exogenous variable in this cross-country analysis. Domestic production of cow's milk increased by an average of 1.3% per year between 1970 and 1980 (Addis Anteneh, 1984, p. 9). Comparing the actual increase in production with the calculated increase in demand (3.4%), it is clear that imports were needed to supply the difference.
Commercial dairy imports into sub-Saharan Africa grew by an average of about 10% per year during the same period. Since this tremendous growth cannot be explained by the effects of population growth and rising incomes alone, other factors must be considered, of which dairy import policies and changes in the real prices of dairy imports are the most important. To quantify these other factors, a rough calculation on a per country basis is given below.
The first calculation concerns a general commodity balance identity. The equation is defined as:
MtN + Qt + Stt-1 = Ct + Stt (1)
where a country's net dairy imports14 within a certain period (MtN), plus its domestic production for the period (Qt) and end-stocks carried over from the previous period (Stt-1), equal total milk consumption (Ct) and the end-stocks to be carried over to the following period (Stt).
14 Includes only commercial imports; data for food aid are not available for a sufficiently long period.
Stocks of milk and milk products are assumed either to have a very short shelf-life (e.g. whole milk), so that significant amounts are not stored, or to be constant over the years. If this is so, then equation 2, which deals with changes in the variables15, can be derived from equation 1:
(2)
i.e. the relative change in imports is equal to the relative change in total consumption minus the relative change in production. All changes have to be weighted according to their respective shares in total consumption in the base period.
15 For reasons of legibility, all subscripts and superscripts have been left out. All imports are net imports, and the calculation covers changes within one period only.
Total consumption (C) is believed to be mainly determined by population (N) and per capita income (Y), so changes in these (and their elasticities) are now substituted for changes in C, together with a residual (e*) comprising changes in all other factors determining consumption.
Equation 2 thereby converts to:
(3)
where h is the income elasticity of demand for milk and the population elasticity of demand is assumed to be equal to one.
Isolating the residual term (e*) and expressing the share of domestic production in total consumption as a rate of self-sufficiency (RSS) gives:
(4)
The residual term (e*) includes all influences on changes in dairy consumption other than changes in population and income. One of these other influences is policy.
We can now define a new variable, e, which is the residual proportionate change in dairy imports that cannot be explained by changes in population, income growth or domestic production. From equations 3 and 4 we can see that
(5)
where:
1 - RSS is the share of imports in consumption.
Table 4 gives the values of the residual import growth rates (e) and those of other variables from which the rate was calculated for 32 sub-Saharan African countries. All figures denoting change (d) are given as annual averages between 1972-74 and 1980-82.
A comparison of signs shows that the sign of the residual term and that of the average annual change in commercial dairy imports were the same for 22 of the 32 countries listed in the table. Thus in almost three quarters of the countries for which relevant data were available, the hypothesis was confirmed that in addition to population growth, increased income per person and shortfalls in domestic milk production, other factors were responsible for the increase in dairy imports during the 1970s. It now remains to be determined to what extent did national dairy import policies directly affect this increase.
Let us now give an example of how to interpret Table 4 by using the data for Nigeria. Commercial dairy imports into Nigeria grew by an average of 15.4% annually over the period 1972-74 to 1980-82; no food aid was imported. The residual term value of +10.4% indicates that the balance between population, income and milk production growth in Nigeria can explain only a 5.0% (i.e. 15.4% - 10.4%) increase per annum in dairy imports; the remaining 10.4% must therefore be due to other influences on dairy imports, such as government policy.
Table 4. The effects of policy and other factors on dairy imports by country, sub-Saharan Africa, 1972-74 (av.) to 1980-82 (av.).
|
Country |
Rate (%) of self-sufficiencya (RSS) |
Changes inb: |
Residual imports growth ratec (e) |
|||
|
Commercial dairy imports (dM/M) |
Population (dN/N) |
Income (h ×dY/Y) |
Production (dQ/Q) |
|||
|
Percent per year |
||||||
|
West Africa |
||||||
|
Benin |
0.79 |
12.2 |
2.9 |
0.3 |
1.1 |
1.1 |
|
Burkina Faso |
0.88 |
36.2 |
2.5 |
0.7 |
-1.0 |
25.1 |
|
Gambia |
0.71 |
19.9 |
3.0 |
0.0 |
2.3 |
15.2 |
|
Ghana |
0.13 |
-2.9 |
3.1 |
-2.2 |
0.0 |
-3.9 |
|
Guinea |
0.91 |
3.2 |
2.9 |
0.1 |
0.0 |
-30.1d |
|
Côte d'Ivoire |
0.07 |
14.4 |
5.0 |
0.8 |
12.1 |
9.1 |
|
Liberia |
0.05 |
6.5 |
3.5 |
-0.1 |
9.1d |
3.4 |
|
Mali |
0.78 |
3.3e |
2.6 |
1.3 |
4.7 |
2.2 |
|
Mauritania |
0.65 |
5.5 |
2.7 |
-0.7 |
3.7 |
6.7 |
|
Niger |
0.79 |
3.9e |
3.3 |
-0.1 |
8.0d |
18.8 |
|
Nigeria |
0.57 |
15.4 |
3.2 |
0.9 |
3.4 |
10.4 |
|
Senegal |
0.58 |
5.7 |
2.9 |
-0.6 |
-0.7 |
-0.7 |
|
Sierra Leone |
0.50 |
10.2 |
2.6 |
-0.5 |
14.0d |
20.0 |
|
Togo |
0.50 |
12.9 |
3.0 |
0.1 |
2.5 |
9.2 |
|
Central Africa |
||||||
|
Burundi |
0.98 |
35.0d |
2.3 |
0.6 |
2.7 |
22.3d |
|
Cameroon |
0.74 |
8.5 |
2.3 |
2.7 |
-2.4 |
-17.6 |
|
Central African Republic |
0.60 |
3.0 |
2.3 |
-0.5 |
3.7 |
4.1 |
|
Congo |
0.03d |
8.9 |
2.9 |
1.5 |
40.3d |
5.6d |
|
Rwanda |
0.96 |
-3.2 |
3.4 |
1.2 |
0.4 |
-108.6d |
|
Zaire |
0.87 |
-4.2 |
3.0 |
-2.1 |
-16.7d |
-122.9d |
|
East Africa |
||||||
|
Ethiopia |
0.97 |
21.3 |
2.5 |
-0.2 |
1.5 |
-6.9d |
|
Kenya |
1.12 |
n.d.f |
4.0 |
1.2 |
2.3 |
n.d. |
|
Somalia |
0.99 |
80.5d |
2.8 |
0.7 |
9.2d |
641.3d |
|
Sudan |
0.99 |
18.8 |
3.1 |
0.7 |
6.1d |
249.6d |
|
Tanzania |
0.92 |
0.4 |
3.4 |
1.1 |
-6.5d |
-130.6d |
|
Uganda |
0.89 |
-1.6 |
3.1 |
-3.1 |
2.7 |
20.3d |
|
Southern Africa |
||||||
|
Lesotho |
0.61 |
10.1 |
2.4 |
4.0 |
2.1 |
-3.0 |
|
Madagascar |
0.65 |
-5.6 |
2.6 |
-1.5 |
-1.9 |
-12.3 |
|
Malawi |
0.68 |
1.5 |
3.2 |
1.6 |
8.7 |
5.0 |
|
Swaziland |
0.88 |
9.0 |
2.6 |
0.3 |
2.7 |
4.6d |
|
Zambia |
0.53 |
-15.0d |
3.1 |
-1.8 |
-3.2 |
-21.4 |
|
Zimbabwe |
0.99 |
47.2d |
3.3 |
-1.0 |
-3.3 |
-509.5d |
a Calculated in the base period 1972-74 (av.).
b All changes are average annual changes between 1972-74 (av.) and 1980-82 (av.).
c The full form of equation 5 is:

d Figures are considered particularly unreliable or are very high due to a low share of imports in consumption in the base period.
e Imports have been adjusted for the 1972-74 drought.
f n.d. = not defined. Kenya was a net exporter until 1979.
Source: Author's calculation based on FAO Production Yearbooks (various years), FAO (1978a), World Bank (1981), and World Bank (1984).
When there is no government interference, the amount of imports entering a country depends on the relationship between international prices and domestic production costs. At market equilibrium, the domestic price equals the international price, but if the government interferes with the price of imports either directly or indirectly, the domestic price will differ from the international one and import totals will change (see Figures 6 and 7 in Chapter 5). Similarly, changes in international prices affect import levels, but this assumes that no additional import quantity restrictions are simultaneously imposed.
Towards the end of the 1970s, world market prices for dairy products came increasingly under pressure from the protectionist policies of the main dairy producers, the United States and the EEC (Tangermann and Krostitz, 1982). Real world prices of dairy products began to fall during 1975/76, and within a period of 3 years (1980/81 to mid-1984) the prices for skim and whole milk powder reached the GATT minimum export price (FAO, 1985).
The stocks of skim milk powder held by the EEC and the United States at the end of the third quarter of 1983 were approximately double the annual volume of international trade in this product (GATT, 1983). No change in the position is foreseen (FAO, 1985; van Dijk et al, 1983), as the recent introduction of milk quotas has stabilised rather than reduced the EEC dairy surplus. Theoretically, depressed international prices for dairy products stimulate imports of such products, thereby exerting a constant downward pressure on domestic milk prices in sub-Saharan African countries (see also explanations to Figure 6 in Chapter 5).
The little empirical evidence that exists on dairy prices in African countries is inadequate to prove the stimulating effect of depressed international prices on dairy imports. We have therefore used ratios between the indices of international and domestic prices (Table 5), where the numerator is import price in the recent period divided by import price in the base period, and the denominator is domestic price in the recent period divided by domestic price in the base period.
A ratio of less than one means that domestic prices increased relative to international prices, providing a stimulus for increased imports. This ratio does not indicate the absolute relationship between international and domestic prices in the base period, and parity should not be assumed. On the other hand, a ratio of unity between the indices means that the ratio of international to domestic prices in the base period is maintained in the recent period.
An analysis of these ratios for 20 sub-Saharan African countries shows that the changes in commercial dairy imports, in dairy production, or in the rate of self-sufficiency (calculated for commercial dairy imports only) did not depend on the ratio between the indices of current international and domestic dairy prices (in local currencies at official exchange rates). The import price index of all but 7 of the 27 dairy products imported into the 20 countries has fallen more, or increased less, than the domestic price index, and although this must have influenced the quantities imported, there is no statistical proof. The difficulty in finding significant correlations may also be due to the effect of tariff policies.
Another complicating factor is that import prices vary greatly among countries, even for the same commodity. For example, in 1982 the coefficient of variation of the prices of imported dry milk powder was 0.35 across 42 sub-Saharan African countries. This was calculated on the basis of the unweighted mean of dry milk prices for the 42 countries, which in 1982 was US$ 0.20 kg-1 LME with a range of US$ 0.37 kg-1 to US$ 0.07 kg-1 LME.
Figure 10 shows the deflated prices16 of dry milk for four selected countries - Gabon, Nigeria, Senegal and Somalia. Gabon was selected because of its relatively high import prices for dry milk, and Nigeria because it is the greatest importer in terms of volume. Both Senegal and Somalia are among the five largest importers by volume, but Somalia imports at relatively low prices. The great disparity in import prices, even for the same commodity, suggests discriminatory and variable dumping policies on the part of EEC and other surplus-producing exporters.
16 Cost, insurance and freight prices deflated by the consumer price index for industrialised countries 1980 = 100.
The third major influence on the price mechanism in trade is the exchange rate, which translates international prices into domestic prices. Although exchange rate policy is not a specific instrument of dairy import policy, it may have had important effects on the growth of dairy imports into sub-Saharan Africa during the 1970s.
Table 5. Average annual changes in dairy imports, production and self-sufficiency rate, and ratio of international to domestic dairy prices, sub-Saharan Africa, 1972-74 (av.) to 1980-82 (av.)
|
Country |
Changes (percent per year) in: |
Ratio between the indices1 of international and domestic prices |
||
|
Commercial dairy imports |
Milk production |
Self-sufficiency rate |
||
|
Benin |
12.2 |
1.1 |
-3.4 |
0.75 |
|
Burkina Faso |
36.2 |
-1.0 |
-10.6 |
0.38 |
|
Burundi |
35.0 |
2.7 |
-2.4 |
0.87 |
|
Cameroon |
8.5 |
-2.4 |
-3.9 |
0.20-0.23 |
|
Kenya |
n.d.2 |
2.3 |
-2.4 |
1.70 |
|
Lesotho |
10.1 |
2.1 |
-3.7 |
0.99 |
|
Madagascar |
-5.6 |
-1.9 |
1.1 |
0.57 |
|
Malawi |
1.5 |
8.7 |
1.9 |
1.09-0.99 |
|
Mauritania |
5.5 |
3.7 |
-0.6 |
1.01-0.67 |
|
Niger3 |
3.9 |
8.0 |
0.6 |
0.66-0.90 |
|
Rwanda |
-3.2 |
0.4 |
0.0 |
0.78 |
|
Senegal |
5.7 |
-0.7 |
-3.1 |
0.47 |
|
Somalia |
80.5 |
9.2 |
-6.9 |
0.50 |
|
Sudan |
18.8 |
-4.5 |
-0.5 |
0.63 |
|
Swaziland |
9.0 |
2.7 |
0.9 |
1.45 |
|
Tanzania |
0.4 |
-6.1 |
-0.7 |
0.92-0.94 |
|
Uganda |
-1.6 |
2.7 |
0.4 |
0.08 |
|
Zaire |
-4.2 |
-16.7 |
-22.8 |
1.04-1.07 |
|
Zambia |
-15.0 |
-3.2 |
4.6 |
0.72-1.09 |
|
Zimbabwe |
47.2 |
-3.3 |
0.6 |
0.39 |
1 The numerator index is import price in the recent period divided by import price in the base period. The denominator index is domestic price in the recent period divided by domestic price in the base period.
2 n.d. = not defined.
3 Imports have been adjusted for the 1972-74 drought.
Source: Author's calculation based on FAO Trade Yearbooks (various years) and FAO Production Yearbooks (various years).
A common criticism levelled at African governments is that their exchange rates are fixed above the rates that would prevail without their interference, thereby encouraging imports. If the nominal or official exchange rate (ERoff) is defined as the number of units of domestic currency per unit of foreign currency, then the exchange rate distortion factor (ERDF) can be calculated as a ratio of an adjusted exchange rate in year t (ERtadj) and the official exchange rate in the same period (ERtoff):
(6)
The adjusted exchange rate is the official exchange rate in a base year adjusted by the ratio of domestic and international rates of inflation as follows:
(7)
where:
edt = the domestic cost of living index in period t, and
eft = the international cost of living index in the same period.
In calculating the adjusted exchange rate, the cost of living indices were re-indexed to the base year (i. e. index = 1.0 when t = 0, which in this case was in 1972). The adjusted exchange rate represents the real exchange rate if the official exchange rate in the base period is undistorted, that is:
Ertadj = Ertreal if Erooff = ERoreal (8)
Most countries in sub-Saharan Africa have tended to overvalue their currencies, while only a few maintain floating exchange rates and perhaps none have undervalued currencies. Most overvalued currencies are likely to have been overvalued already in 1972, the base period for the present calculations.
Assuming that the initial official exchange rate (ERooff) was overvalued, the trend in the degree of overvaluation is indicated by the exchange rate distortion factor (ERDF). An ERDF greater than unity indicates that the exchange rate has become even more overvalued, while an ERDF of less than unity indicates corrections to lessen the degree of overvaluation (if overvaluation existed in the base period), and an ERDF of unity indicates no change in the degree of over- (or under-) valuation relative to the base period.
Figure 10. Deflated prices1 of dry milk imports for four sub-Saharan: African countries, 1972-84.
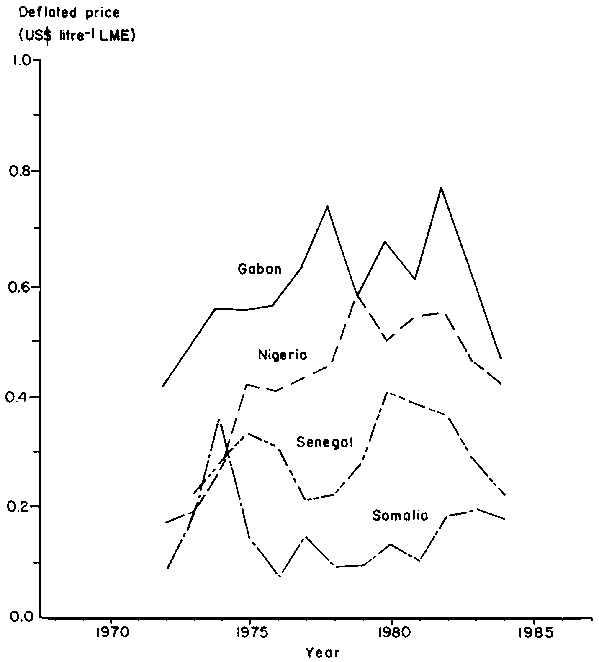
1 Cost, insurance and freight prices deflated using the consumer price index for industrialised countries; 1980 = 100.Source: FAO trade data tapes for 1986.
The ERDFs are not comparable among countries, since the degree of exchange rate distortion in the base year is variable among countries and usually not known. However, in each case where the ERDF is above unity there is an increasing tendency for imports to be drawn in.
In many sub-Saharan African countries, failure to adjust exchange rates in response to differential rates of inflation between domestic and international currencies may have contributed to the increase in dairy imports. This hypothesis was tested using a model relating per capita dairy imports to domestic milk production per person, to real dairy import prices and to the ERDF, thus:
(9)
where:
M/N = volume of commercial dairy imports per person,
Q/N = domestic milk production per person, and
Pm* = the real dairy import price expressed in US$ kg-1 LME and deflated to the base year 1980 by the IMF (1983) consumer price index for industrialised countries.
While this model is not founded on any structural theory, significant relationships between dairy imports and the ERDF would suggest that trends in exchange rates have influenced the level of the imports. Regressions calculated separately for 24 sub-Saharan African countries show that in most of these countries, the regression coefficients for real dairy import prices during 1972-82 had the expected negative signs (Table 6). However, for 9 countries (Ghana, Madagascar, Rwanda, Sierra Leone, Sudan, Swaziland, Tanzania, Togo and Zambia), none of the coefficients was significant and the R2 was less than 0.60.
An analysis of import elasticities (measured at the mean) in relation to changes in real import prices and the exchange rate distortion factor showed that the own-price elasticity of dairy imports for the 21 countries with the expected negative sign is -0.89 on average (unweighted). Kenya and Zimbabwe, which changed from net exporters to net importers of dairy products in the mid-1970s, had positive import price elasticities as did Madagascar, where commercial dairy imports accounted for only 5% of total dairy imports in 1982.
The expected sign for the exchange rate distortion variable is positive, i.e. the greater the trend toward overvaluation of domestic currency, the greater the imports per person. The average elasticity of the exchange rate distortion factor was 0.42 for the 21 countries with negative import price elasticities, and 1.37 for those 14 (but excluding Zimbabwe) which had positive ERDF coefficients. These results imply - if we use the average of values for only those countries whose elasticity has the expected sign - that for every percent decrease in real import prices in US$ terms, dairy imports have gone up by about 0.89%, and for every percent increase in the exchange rate overvaluation they have further increased by about 1.37%.
Several of the regression coefficients relating per capita dairy imports and per capita milk production show an unexpected positive sign, which implies that greater domestic milk production encourages higher dairy imports. In some countries this may be explained by the poor quality of milk production data, but for Ghana, Madagascar, Zaire and Zambia, the positive coefficients are due to the fact that both milk production and dairy imports per person declined between 1972 and 1982. In Kenya, the positive coefficient for real import prices reflects both increased per capita production and increased per capita dairy imports during 1972-82.
In countries such as Somalia, Burkina Faso or Nigeria (see Chapter 7), links between domestic milk production and dairy imports are weak owing to poor transport facilities. Imports only reach the capital and a few larger towns and may increase since urban areas are the main consumption areas, even while domestic milk production in the rural areas is also increasing but milk cannot be transported to the urban markets.
The effects of the various factors influencing dairy imports have been calculated in two different ways. Annual average rates of change in the volume of commercial dairy imports between 1972-74 (av.) and 1980-82 (av.) were first explained as the result of the combined effects of changes in human population, per capita income, domestic milk production, and a 'residual' import growth rate representing policy and other unidentified factors (see Table 4). Then, a regression relating commercial dairy imports to import prices and the exchange rate distortion factor was calculated for the same period (equation 9 and Table 6). It now remains to be seen whether the residual term for each country (Table 4) fits with the calculated effects of the two variables investigated in some detail in this chapter, namely import prices and the exchange rate distortion factor.
We can examine the fit in two ways: by examining the signs (±) of the residual and by calculating a multiple regression. There is a fit if the sign of the residual for each country agrees with the direction in which one expects the actual changes in the country's exchange rate distortion factor and import prices to have altered its imports. In the cross-country regression analysis, the 'residual' (dependent variable) is expressed as a function of two independent variables, the exchange rate distortion and import prices, and the value of the coefficient of determination (R2) shows how much of the originally unexplainable (residual) rate of change in imports over the 1972-82 period can be attributed to changes in the two independent variables.
The signs of the residuals given in Table 7 will be examined first to determine whether each country's residual change in imports (column C) is compatible (columns H and I) with the size and signs of the corresponding factors and elasticities of the exchange rate distortion (columns D and E) and import prices (columns F and G). 'Compatible with' means that the values of columns D, E, F and G explain to some extent the size and sign of the residual.
Among 22 sub-Saharan African countries for which data were available, 12 had positive import residuals (i.e. their dairy imports grew faster than can be explained simply by changes in population, income and domestic production), and of these all except four (Sudan, Togo, Gambia and Malawi) had exchange rate factors and elasticities compatible with their residuals. Among the remaining 10 countries with negative residuals, all except four (Ethiopia, Rwanda, Cameroon, and Zaire) had residuals compatible with their exchange rate distortion. Altogether, 14 out of 22 countries had import residuals compatible with the exchange rate distortion.
Table 6. Elasticities of response to changes in factors influencing dairy imports into sub-Saharan Africa, 1972-82.
|
Country |
R2 |
Elasticitiesa of response to changes in: |
||
|
Domestic production per person |
Real import price |
Exchange rate distortion factor |
||
|
Burkina Faso |
0.871 |
+0.04 |
-1.40** |
+0.44 |
|
Cameroon |
0.865+ |
-0.39 |
-0.66* |
+0.92 |
|
Central African Republic |
0.676 |
-1.78** |
0.96** |
+1.33 |
|
Ethiopia |
0.795 |
-1.73 |
-1.12** |
+3.05** |
|
Gambia |
0.792 |
-4.17 |
-0.01 |
-0.72 |
|
Ghana |
0.562+ |
+1.21 |
-0.23 |
-0.04 |
|
Côte d'Ivoire |
0.929 |
+0.01 |
-1.41*** |
+1.06*** |
|
Kenya |
0.636 |
+6.06 |
+7.82** |
-3.71 |
|
Madagascar |
0.238 |
+0.58 |
+0.53 |
-0.14 |
|
Malawi |
0.679 |
-0.08 |
0.91*** |
+0.76 |
|
Mauritius |
0.566 |
+1.36 |
-1.14* |
+1.34 |
|
Niger |
0.765 |
-2.17*** |
-1.03** |
+2.02* |
|
Nigeria |
0.917 |
+0.73 |
-0.78** |
+1.36** |
|
Rwanda |
0.350 |
+5.43 |
-0.01 |
+4.39 |
|
Senegal |
0.622 |
+0.95 |
-0.76** |
-0.89 |
|
Sierra Leone |
0.589 |
+0.18 |
-0.78 |
+0.12 |
|
Somalia |
0.569 |
+2.25 |
-0.21 |
+1.34* |
|
Sudan |
0.419 |
-1.74 |
-1.93 |
-3.04 |
|
Swaziland |
0.251 |
+4.94 |
-0.82 |
+0.44 |
|
Tanzania |
0.529+ |
+0.13 |
-0.36 |
-0.61 |
|
Togo |
0.438+ |
-2.26 |
-0.91 |
-1.72 |
|
Zaire |
0.753 |
+0.64*** |
-1.05** |
+0.66** |
|
Zambia |
0.101 |
+0.43 |
-1.15 |
-3.34 |
|
Zimbabwe |
0.671 |
-17.90** |
+0.15 |
+35.20 |
a Calculated using equation 9, with the dependent variable being volume of commercial dairy imports, expressed in kg LME per person. Elasticities were measured at the mean.
+ = determinant of matrix is less than 0.20, indicating multicollinearity.
* = statistically significant at the 10% level.
** = statistically significant at the 5% level.
*** = statistically significant at the 1% level.
Source: Calculations based on IMF (1983), FAO Production Yearbooks (various years) and FAO Trade Yearbooks (various years).
With respect to import prices, 9 out of the 12 countries with positive residuals had import price factors and elasticities compatible with the sign of the residual, the exceptions being Togo, Nigeria and Swaziland. Among the countries with negative residuals, only 2 (Madagascar and Zimbabwe) had residuals compatible with the situation they face in respect of import prices.
Thus we can say that where imports grew faster than can be explained by changes in population, income and domestic production, the increase was due to the effects of exchange rate overvaluation and low import prices (probably because of exporting countries' subsidies). But where the growth in dairy imports was unexpectedly low, import prices (particularly high ones) do not seem to be a plausible cause, and other reasons have to be sought.
Table 7. Compatibility of the calculated effects of exchange rate distortion and changes in import prices with the unexplained growth in dairy imports, sub-Saharan Africa, 1972- 74 (av.) to 1980-82 (av.).
|
Country |
Initial import dependency ratio |
Residual import growth rate |
Exchange rate distortion |
Import price |
Compatibility of import residual with |
|||
|
Factor |
Elasticity |
Factor |
Elasticity |
Exchange distortion |
Import price change |
|||
|
(A) |
(B) |
(C) |
(D) |
(E) |
(F) |
(G) |
(H) |
(I) |
|
Somalia |
0.01 |
641.3 |
2.14 |
1.34 |
0.24 |
-0.21 |
Y |
Y |
|
Sudan |
0.01 |
249.6 |
1.29 |
-3.04 |
0.95 |
-1.93 |
N |
Y |
|
Burkina Faso |
0.12 |
25.1 |
1.07 |
0.44 |
0.30 |
-1.40 |
Y |
Y |
|
Sierra Leone |
0.50 |
20.0 |
1.05 |
0.12 |
0.50 |
-0.78 |
Y |
Y |
|
Niger |
0.21 |
18.8 |
1.25 |
2.02 |
0.72 |
-1.03 |
Y |
Y |
|
Gambia |
0.29 |
15.2 |
1.15 |
-0.72 |
0.67 |
-0.01 |
N |
Y |
|
Nigeria |
0.43 |
10.4 |
1.92 |
1.36 |
1.05 |
-0.78 |
Y |
N |
|
Togo |
0.50 |
9.2 |
1.12 |
-1.72 |
1.34 |
-0.91 |
N |
N |
|
Côte d'Ivoire |
0.93 |
9.1 |
1.44 |
1.06 |
0.37 |
-1.41 |
Y |
Y |
|
Malawi |
0.32 |
5.0 |
0.93 |
0.76 |
0.83 |
-0.91 |
N |
Y |
|
Swaziland |
0.12 |
4.6 |
1.27 |
0.44 |
1.05 |
-0.82 |
Y |
N |
|
Central African Republic |
0.40 |
4.1 |
1.12 |
1.33 |
0.68 |
-0.96 |
Y |
Y |
|
Senegal |
0.42 |
-0.7 |
1.10 |
-0.89 |
0.69 |
-0.76 |
Y |
N |
|
Ghana |
0.87 |
-3.9 |
9.75 |
-0.04 |
0.58 |
-0.23 |
Y |
N |
|
Ethiopia |
0.03 |
-6.9 |
1.35 |
3.05 |
0.79 |
-1.12 |
N |
N |
|
Madagascar |
0.35 |
-12.3 |
1.17 |
-0.14 |
0.65 |
0.53 |
Y |
Y |
|
Tanzania |
0.08 |
-130.6 |
1.53 |
-0.61 |
0.62 |
-0.36 |
Y |
N |
|
Cameroon |
0.26 |
-17.6 |
1.14 |
0.92 |
0.68 |
-0.66 |
N |
N |
|
Zambia |
0.47 |
-21.4 |
1.07 |
-3.34 |
0.87 |
-1.15 |
Y |
N |
|
Zaire |
0.13 |
-122.9 |
1.86 |
0.66 |
0.80 |
-1.05 |
N |
N |
|
Rwanda |
0.04 |
-108.6 |
1.51 |
4.39 |
0.33 |
-0.01 |
N |
N |
|
Zimbabwe |
0.01 |
-509.5 |
0.91 |
35.20 |
0.22 |
0.15 |
Y |
Y |
Notes: Column B figures calcultated as 1 minus the value of RSS shown in Table 4; column C figures drawn from the right-hand column in Table 4; exchange rate distortion factor (column D) defined in equation 6; column E figures drawn from Table 6; column F figures are c.i.f. import prices for 1980-82 calculated as a proportion of 1972-74; column G figures drawn from Table 6. The rules used to determine compatibility between import residual and exchange distortion or import price change are as follows.· In respect of the exchange rate distortion factor, there is compatibility (marked as Y in column H) if:- either column D (exchange rate distortion factor) is > 1 and column E is positive
- or column D <1 and column E is negative
- and the residual (column C) is positive:OR
- either column D < 1 and column E is positive
- or column D> 1 and column E is negative
- and the residual (column C) is negative.
Absence of compatibility is marked as N in column H.· In respect of import prices there is compatibility (marked as Y in column 1) If:
-either column F (import price factor) is > 1 and column G is positive
- or column F < and column G is negative
- and the residual (column C) is positive:OR
- either column F > 1 and column G is negative
- or column F < 1 and column G is positive
- and the residual (column C) is negative.
Absence of compatibility is marked as N in column I.
We now turn to the use of regression analysis to assess to what extent the size and sign of the residuals (i.e. the so far unexplained rates of change in commercial imports during 1972-82) can be explained. In our cross-country analysis (n = 22), the residual was treated as the dependent variable and changes in the exchange rate distortion factor (ERDF) and in import prices (valued in 1980 US$), each multiplied by their respective elasticities, were treated as the independent variables. A third term, an interaction between the exchange rate and import price, was also introduced17.
17 The actual form of the regression was:Y = Constant + b 1 (X1) + b 2 (X2) + b 3 (X3)where, with reference to the columns of Table 7:
Y = column C
X1 = (column D - 1) (column E)
X2 = (column F - 1) (column G)
X3 = (X1) (X2)
Analyses were carried out with one (ERDF), two (ERDF plus price) and three (ERDF, price and their interaction) independent variables. The value of R2 for regressions with one variable was 0.26, with two it was 0.28 and with three 0.47. The coefficient for the exchange rate variable had the expected sign (i.e. positive) and was statistically significant (P < 0.02) in all three analyses. Its value was not affected by the inclusion of the price variable but nearly doubled when the interaction effect was added. The price coefficient had an unexpected sign (i.e. positive) and was statistically insignificant in both the analyses that included the price variable. The coefficient for the interaction effect was negative and statistically significant (P = 0.03). The absolute values of the coefficients have no particular meaning.
The value of R2 was an important statistic, for it indicated, in broad terms, that in the 22 countries for which comparable data are available, between a quarter and a half (depending on the form of the equation chosen) of the hitherto unexplained changes in the rate of import growth can be attributed to changes in exchange rate distortion and import prices. The countries whose residuals the regression was least able to explain were Rwanda and Somalia, clearly showing that in these two countries other important influences were at work.
When the 3-variable regression was re-run excluding Rwanda and Somalia, the signs of the coefficients remained the same and their values did not change much. The coefficient of the price variable remained statistically insignificant, but the value of R2 rose to 0.88 and the coefficients for the exchange rate distortion and interaction variables improved in statistical significance (P < 0.01).
The exchange rate distortion factor is clearly a 'policy variable'. The level of import prices, and the changes in it over time, are less clearly influenced by policy, although the very different prices paid at the same time and for the same product by different African governments suggests that they are not entirely 'price takers'. An attempt to incorporate the ratio between international and domestic prices, which is a policy variable, did not yield statistically significant results (see Table 5).
To summarise, the results provide evidence that, in addition to the factors normally cited as the main determinants of increased imports into sub-Saharan Africa (i.e. population and income growth), national governments have significantly influenced this increase through their own policies, specifically their interference with the exchange rate. There are, however, many other policies, some specifically directed at dairy imports, which are likely to have been of importance and whose effects depend on the combination of instruments and the details of their design and implementation18, but which cannot be described sufficiently using cross-country analysis. Some typical examples of dairy imports and dairy import policy for selected countries will be given in the next chapter.
18 Compare Chapter 5 above, and see von Massow (1984b) and Mbogoh (1984) for rough outlines of individual countries, policies.
