4.1 Products consumed (Question 24)
4.2 Frequency of Consumption (Questions 24 and 25)
4.3 Levels of Consumption (Questions 22, 23, 24 and 25)
4.4 Consumption Patterns
4.5 Consumption preferences (Question 31)
4.6 Constraints to and Opportunities for Increased Dairy Product Consumption (Questions 9, 24, 25, 26, 31, 32)
4.7 Determinants of Consumption
Between 1991 - 92, scientists from ILCA and the Kenya Agricultural Research Institute (KARI) undertook a characterisation study of dairy consumption in the dairy shed surrounding the coastal city of Mombasa. Using the enumeration areas demarcated during the 1989 population census, the Mombasa dairy shed was stratified into rural, urban and pert-urban areas. An estimate was made of the overall sample size needed for statistically valid data analysis. The overall sample size was then proportionally allocated among the location strata, thus yielding the number of clusters to be sampled in each area. The clusters to be surveyed were then randomly selected. The household was determined as the consumption unit and primary level of observation. Four households were randomly selected from each identified cluster, producing an overall household sample size of 630 households5. Adopting a formal survey technique, a structured questionnaire such as that proposed in Annex 2 was administered to the food budget manager of each household.
5 In this particular instance, the size of the population from which a sample was to be drawn was known, and for this reason it was possible to use traditional cluster sampling rather than the adaptive cluster methodology. However, because this situation is not often encountered, the Conceptual Framework proposes the adaptive cluster methodology for drawing samples.
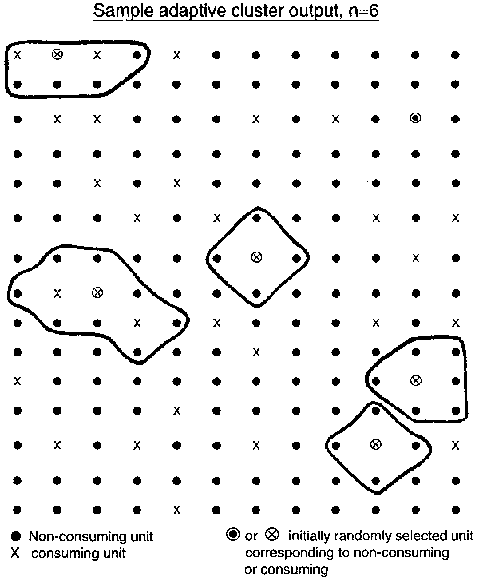
Figure 2. Household selection following the rules of adaptive cluster sampling methodology.
Presented below are selected results from the Mombasa dairy consumption characterisation study (Mulling, 1992). These are examples of useful data analyses which can be carried out at the characterisation phase based on the CF's recommended minimum data set. The examples are cross-referenced with the questions in the proposed household survey (Annex 2) which produce the data used in the analysis. The information generated is related to the functional parameters, performance indicators and hypotheses previously identified in the methodology. New hypotheses are developed about the relationships between households of different strata and their dairy consumption choices. Finally, research issues are identified.
Functional parameters. The consumption system of coastal Kenya is characterised by considerable product diversity (Figure 3). Unprocessed and processed, local and standardised dairy products appear among the items consumed. Milk consumption is, however, virtually exclusively cow's milk.
Figure 3. Dairy product consumption by household location, Mombasa and Kilifi Districts, Coast Province, Kenya, 1 991.
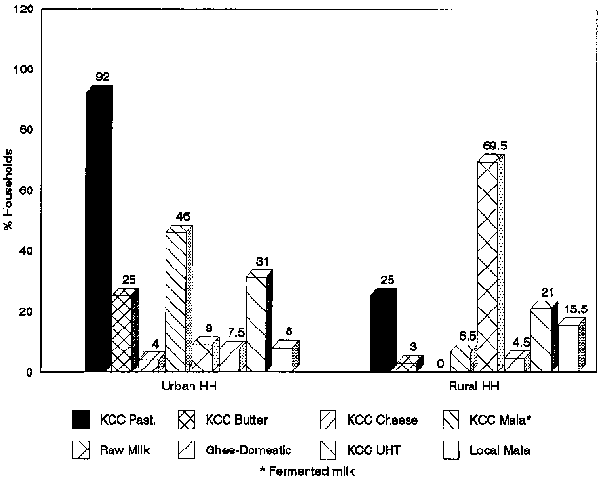
Performance indicators. The percentage of households regularly consuming liquid milk is high, ranging from 70 per cent in rural locations to 92 per cent in urban locations. Quantity consumed rapidly decreases, however, as degree of processing increases, e.g. only 25 per cent and four per cent of urban households consume butter and cheese, respectively. Consumption of processed dairy products is observed even less frequently among rural and low-income households, indicating that the majority of the population do not consume processed products to any substantial degree.
Hypotheses. Analysis of consumption data stratified by household location suggests that location exerts a strong influence on the types of dairy products consumed. While strengthening the hypothesis that there is a relationship between household location and dairy consumption, it is not possible, however, to conclude that location is a more influential determinant than household income as hypothesis C1 purports.
Researchable issues. Further research is indicated investigating the reasons which underlie non-consumption of particular processed dairy products. Non-consumption may be related to higher prices associated with these products. Alternatively, it might reflect a location-specific group of consumers without access to the product in question, which would suggest inefficiencies in the marketing system. It may also be due to lack of product appeal among particular groups. Perishability, storage and packaging may be additional factors.
Frequency of consumption is another step in the process of identifying patterns among dairy product consumers. Although a group of households consumes the same set of dairy products, they may consume individual products with quite different frequencies. Table 5 looks at the frequency of consumption of different dairy products among coastal Kenya households.
Table 5. Frequency of dairy product consumption in households sampled in Mombasa and Kilifi Districts, Coast Province, Kenya, 1991.
|
Product |
Consumption frequency (Percent of households) |
|||
|
Daily |
Weekly |
Monthly |
Never |
|
|
Raw milk (cow) |
44 |
12 |
0 |
44 |
|
KCC milk |
40 |
12 |
8 |
40 |
|
UHT milk |
21 |
21 |
12 |
46 |
|
Goat milk |
1 |
2 |
4 |
93 |
|
Fermented milk |
15 |
28 |
10 |
47 |
|
Butter |
18 |
8 |
4 |
70 |
|
Cheese |
5 |
3 |
4 |
88 |
Functional parameters. Consumption frequency of the two fresh milk products, raw milk and KCC pasteurized milk, displays a bi-modal distribution pattern, i.e. consumption frequency tends towards the extremes of either daily or never, with few respondents in between. The frequency distribution of UHT milk consumption is more even, although many respondents indicate that they do not consume UHT milk at all. Fermented milk is consumed with high to moderate frequency, but the processed dairy products, butter and cheese are regular parts of the diets of only a few households.
Researchable issues. The issue of non-consumption of dairy products is again highlighted. But, the bi-modal distribution of consumption frequency of raw and KCC pasteurized milk strengthens the hypothesis that separate markets exist for these products. The separation of the two product markets could result from bi-modal income distributions, marketing constraints, market interventions, or a combination thereof, and is an issue for research.
The quantity of dairy products consumed per individual per year is frequently used to summarise the status of dairy consumption at a point in time. The number of kilograms of milk consumed per capita per year can be used to: i) draw comparisons between groups of dairy consumers; ii) estimate overall consumption of dairy products in an area; and iii) identify determinants of dairy demand. Obtaining information on consumption levels is, however, not an easy task. There are difficulties in acquiring good measurements of consumption and problems in combining quantities of different products, e.g. milk and butter, into a single figure. An additional computational problem arises from the fact that products are consumed at different frequencies and that this consumption may vary considerably over the year. Overcoming these problems and arriving at reliable consumption estimates requires collecting the separate pieces of information, standardising products, quantities and frequencies, and then computing the estimates. Details of how dairy products may be standardised, consumption frequencies reconciled, and household members of different ages and sex converted to consumer units are provided in Annex 3. Table 6 presents estimated dairy consumption levels based on these standardization procedures for households in the Mombasa characterisation study.
Table 6. Dairy consumption among coastal Kenya households sampled by location and income group, Kilifi and Mombasa Districts, Coast Province, Kenya, 1991.
|
Location and income group |
Urban |
Peri-urban |
Rural |
||||
|
High |
Middle |
Low |
Middle |
Low |
Middle |
Low |
|
|
(N = 39) |
(87) |
(78) |
(27) |
(35) |
(76) |
(178) |
|
|
Mean Its*/consumer unit/day |
0.78 |
0.62 |
0.43 |
0.54 |
0.28 |
0.35 |
0.30 |
|
Standard deviation |
0.54 |
0.60 |
0.54 |
0.48 |
0.22 |
0.43 |
0.34 |
|
Median value |
0.65 |
0.45 |
0.29 |
0.40 |
0.21 |
0.20 |
0.17 |
* Liquid milk equivalents (LME).
Performance indicators. Quantities consumed are generally less than a liter of liquid milk equivalent per consumer unit per day, however, there is considerable range across income classes and geographic locations, with the highest consumption level (urban/high income) being more than twice that of the lowest (pert-urban/low income). There is also notable variation in consumption within the defined strata as indicated by standard deviations which are equal to or greater than the means.
Hypotheses. The data support acceptance of hypothesis 20: "Consumption levels of dairy products are positively correlated to population concentration". Consumption levels increase as one moves from the sparsely populated rural areas to the densely populated urban areas, even within the same income classes.
Researchable issues. Assuming that the observed variations in consumption levels are not due to consumer preferences, there appears to be considerable scope for increasing the quantities and diversity of dairy products consumed, particularly among middle and low income households in pert-urban and rural locations. Subsequent research should therefore determine the respective influences of household income and product availability as constraints to dairy consumption. Answering this question will assist in allocating research resources between development of cost-reducing production technologies, and the design of more effective and efficient marketing systems.
At the household level the consumption pattern is defined as the combination of the types, quantities and frequencies of dairy product consumption. Where dairy products are numerous and widely consumed, discerning consumption patterns may become complicated. Below are some of the more distinct consumption patterns identified in the coastal Kenya study. These results have lead researchers to examine more closely the consumption patterns of pert-urban households, some of which exhibit patterns resembling those of rural households while yet others display consumption patterns similar to urban households. Understanding the sources of these differences will yield important information on (1) the changing patterns of food consumption as populations relocate to pert-urban areas, and (2) the determinants of dairy-product demand.
Functional parameters. Twelve per cent of the households surveyed were not, or only on special occasions, consuming any dairy products. The coastal Kenya households which consume dairy products may be characterised as belonging to either of two broad categories: those consuming only liquid milk products 42%, and those which, in addition to milk, consume more highly processed products (58%). Within these two groups are subclasses of consumers differentiated by their intensity of consumption. Although only a small minority of the consuming households (three per cent) are classified as "very high" intensity consumers, 47 per cent are considered as "high" intensity. Highest intensity consumption is associated with households of Asian and Swahili ethnic and cultural backgrounds.
Performance indicators. As earlier identified, levels, range and frequency of dairy consumption - the combination of which determine consumption pattern - are closely linked to household location and income class. Analysis also reveals, however, the important role of ethnicity and cultural attributes in determining consumption patterns. It is therefore critical that system performance be set in its social context for proper evaluation as performance measures are likely to differ according to ethnic and cultural expectations.
Hypotheses. Among other factors, prices, household income and location, tastes and preferences, cultural beliefs and taboos, and personal attributes of the food budget manager are hypothesised as determinants of dairy consumption. Of these, the latter three in fact reflect the ethnic and cultural background of the household. Separate testing of hypotheses will provide statistical evidence of the role of ethnicity and culture in determining dairy product consumption. Initial analysis of consumption patterns strongly suggests, however, that these social characteristics are significant consumption determinants and substantially mitigate price, income and location factors.
Table 7. Dairy consumption patterns and associated socio-economic descriptors,
Mombasa and Kilifi Districts, Coast Province, Kenya, 1991.
|
|
Consumption patterns (number of households) |
Litres milk equivalent consumed per year |
Social characteristics |
|
Consumers of milk only (including sour milk) |
KCC pasteurized and UHT daily (once or twice). Fresh milk and fermented
milk never or daily. |
1032 |
Rural and pert-urban middle income house-holds; diverse ethnic affiliation. |
|
KCC pasteurized or fresh milk daily. Fermented milk at least once a week. |
636 |
Rural and peri-urban, low and middle income households; coastal |
|
|
Fresh milk between daily and once a month. Fermented milk occasionally. |
588 |
Rural and low income, coastal |
|
|
Consumers of milk and other dairy products |
KCC pasteurized, UHT and fresh milk daily (up to 2 times a day). All
other dairy products (cheese, butter, yoghurt, cream) at least once a
week. |
1104 |
Peri-urban, middle and high income households; Swahili and Indian ethnic groups. |
|
KCC pasteurized daily, UHT and fermented milk daily to once a week. Half
of households consume fresh milk daily. Cream and butter occasionally. |
804 |
Rural and peri-urban, middle and high income households; Bantu and lake basin migrant households. |
|
|
Fresh milk at least once a week. KCC pasteurized and UHT between once
a week and every 2 months. Fermented milk weekly. Powder milk, cream and
butter occasionally. |
516 |
Rural and low income households; coastal Bantu ethnic groups. |
|
|
KCC pasteurized, fresh milk and fermented milk once a week at least.
Occasional consumers of other dairy products including cheese, cream and
yoghurt (once every two months). |
672 |
Peri-urban low and middle income households; diverse ethnic groups. |
LME: Liters of milk equivalent
Researchable issues. That the unique food habits of many ethnic groups persist despite long residence outside their native countries or regions, demonstrates the strength of "food cultures". Still, there is also evidence among the data from coastal Kenya that food habits have been adapted. Little information is available, however, on the process of changing food habits in coastal Kenya or other areas of sub-Saharan Africa. Research into this process could be expected to yield information of value for future agricultural research planning, market development, human nutrition, and government policy-making. This information also underscores the need to include socio-cultural considerations in research design and social scientists, e.g. anthropologists and sociologists, in the multi-disciplinary research team.
Data on consumer preferences highlight production and marketing opportunities. Table 8 presents some of the results related to consumer preferences.
Table 8. Milk-product preferences among households sampled by household location and income category in Mombasa and Kilifi Districts, Coast Province, Kenya, 1991.
|
|
KCC pasteurized vs fresh milk (%) |
KCC pasteurized vs KCC UHT milk (%) |
KCC UHT milk vs fresh milk (%) |
||||
|
KCC past. |
Fresh milk |
KCC past. |
KCC UHT |
Fresh milk |
KCC UHT |
||
|
Location |
Urban |
27 |
69 |
61 |
30 |
72 |
22 |
|
Peri-urban |
13 |
87 |
73 |
24 |
89 |
11 |
|
|
Rural |
8 |
78 |
38 |
34 |
77 |
9 |
|
|
Income class |
High |
35 |
58 |
50 |
31 |
61 |
27 |
|
Middle |
18 |
76 |
58 |
31 |
77 |
17 |
|
|
Low |
12 |
77 |
44 |
32 |
78 |
10 |
|
KCC: Kenya Cooperative Creameries
N.B. Inter-column rows totalling less than 100% reflect "Indifferent" consumer responses.
Functional parameters. Among the liquid milk products, a clear preference exists for unprocessed (raw) whole milk. This is true irrespective of household location or income class.
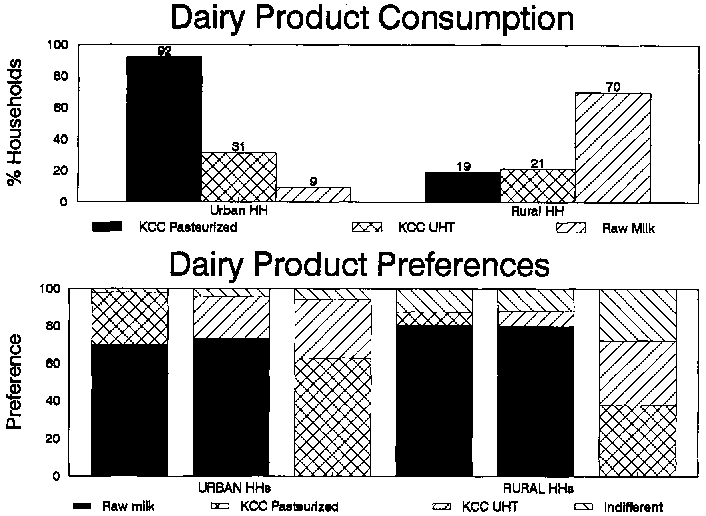
Performance indicators. Figure 4 comparing consumer preferences with actual consumer behaviour reveals that the two patterns do not coincide. The divergence implies that households are not consuming their preferred dairy products but rather are forced to choose among whatever products the market is offering.
Hypotheses. While applicable, testing hypothesis 21 ("Tastes and preferences are more important determinants of dairy consumption than household income") with this data set will not yield valid results because consumption structures do not reflect consumer preferences.
Researchable issues. It can be hypothesized that the discrepancy between consumption preferences and consumer behaviour results from supply factors such as lack of appropriate technology to increase production of raw milk, or, market failure. Market failure may result from government interference in the form of fixed prices, marketing restrictions, etc. which distort or impede the flow of goods and information between producers and consumers. Markets may also not be functioning well due to non-interventionary causes such as lack of infrastructure and technology.
Improvement in the performance of consumption systems can be achieved through either removal of constraints on consumption or by capitalizing on previously unexploited opportunities. It is important in the course of research to remain aware of both avenues. Oftentimes, consumers know -or at least have firm opinions about - what prevents them from fully realising their consumption goals. In such cases, uncovering constraints may be as easy as asking consumers directly about their objectives and their problems in attaining them. However, when constraints occur within the marketing system, or at the level of production, consumers may only partially understand the nature of the problem. They are capable of describing the symptom, e.g. unavailability of fresh milk on the market, but are in fact unaware of the "illness", e.g. no milk collection service. Consumers obviously can only speak from their individual experience and are poorly placed to see new opportunities. Researchers, who will generally have more information on such a problem, are better situated to perceive new opportunities. However, in attempting to discover the constraints to and opportunities for improving consumption systems, researchers must not only look for direct and obvious problems but also discern the indirect and subtle issues. That consumption constraints are here gleaned from a series of six questions illustrates the numerous ways in which performance of the consumption system may be impaired.
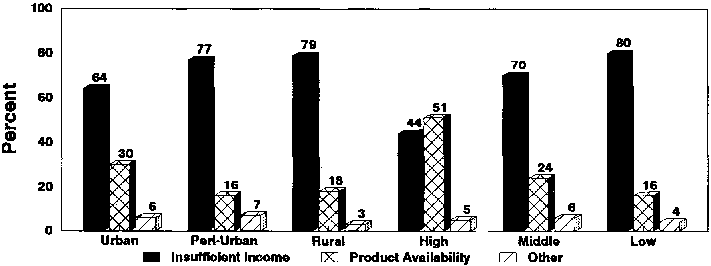
Performance indicators. Figure 5 depicts consumer response regarding their consumption constraints by household location and income. "Insufficient household income" dominates the stated constraints to increased dairy consumption. Product unavailability is, however, a notable problem among the high and middle income communities.
Researchable issues. The stated constraints may be described as fundamental, and based on the size and uniformity of household response, they constitute substantial problems to be overcome. Household real income can be increased by reducing the prices of dairy products. Reducing dairy product prices relative to their substitute goods will in addition make them more price competitive. Research is therefore needed to isolate the principal cost components of dairy products with a view towards reducing them. Policy analysis should not be overlooked in this process as fixed price policies can create price floors that bolster prices above competitive market levels. Consumers' comments on the unavailability of dairy products underscore the discrepancy between their consumption behaviour and their stated preferences which has been described previously, as well as research activities needed to investigate the issue of market failure.
The preceding analysis has revealed three principal determinants of consumption among coastal Kenya households; ethnicity and cultural traditions, household income and household location. Household location influences structure of consumption by influencing the availability of dairy products. Essential for realizing household consumption goals, household income has a more direct effect on dairy consumption. The relative effect of income and location will, however, vary depending on the aspect of dairy consumption under consideration, i.e. whether one is investigating determinants of levels of consumption or types of products consumed.
Income appears to predominate over household location as a determinant of dairy consumption (hypothesis C1). Still, where household income is a less binding factor, ethnicity and cultural attributes, and household location (the product availability issue) play a substantial role in determining dairy product consumption patterns (hypotheses C1 and 21). Analysis of the data from coastal Kenya refutes hypothesis C7: "Low per capita dairy consumption in SSA is by conscious choice rather than the result of imposed constraints."
Low levels of dairy consumption among the majority of coastal Kenya households and the high incidence of income and availability constraints indicate that even small changes in these areas could result in significantly improved performance of the consumption system. Cost-reducing dairy production technologies, and increased supply of dairy products through market development and marketing policy reform are identified as priority areas of future research aimed at improving performance of the dairy consumption system in coastal Kenya.