ANNEX 1. Information required on dairy product consumption at the dairy-shed level.
ANNEX 2. Proposed household questionnaire for the characterization of the consumption system.
ANNEX 3. Procedures for standardising product measures and consumption frequencies, and calculation of consumer units
ANNEX 4. Sampling stratification: guidelines and comments
ANNEX 5. Computation of means and variance for data collected using the adaptive cluster method
i. Begin by listing all the dairy products known to be consumed in the dairy shed.
|
Dairy product categories |
Dairy products consumed in the dairy shed |
Production and processing areas |
Consumption levels (Its/LMEs) |
Typical use |
Linkage to a particular social group or location |
Seasonal variation in availability (shortage periods) |
Gov't quality standards (Yes/No) |
|
Milk |
|
|
|
|
|
|
|
|
|
|
|
|
|
|
|
|
|
|
|
|
|
|
|
|
|
|
|
|
|
|
|
|
|
|
|
Sour/fermented milk |
|
|
|
|
|
|
|
|
|
|
|
|
|
|
|
|
|
|
|
|
|
|
|
|
|
|
Cooking fat |
|
|
|
|
|
|
|
|
|
|
|
|
|
|
|
|
|
|
|
|
|
|
|
|
|
|
Edible spread |
|
|
|
|
|
|
|
|
Cheese |
|
|
|
|
|
|
|
|
Cosmetic fats/oils |
|
|
|
|
|
|
|
ii. Factors which could affect availability of dairy products.
|
Dairy product |
Is there a government fixed price? (Yes/No) |
Is there any gov't tax at any level prior to the consumer? |
Is there any gov't subsidy at any level prior to the consumer? |
Is the product imported? |
Is it a standardised dairy product? |
|
|
|
|
|
|
|
|
|
|
|
|
|
|
|
|
|
|
|
|
|
|
|
|
|
|
|
|
|
|
|
|
|
|
|
|
|
|
|
|
|
|
iii. Urban population density and growth rate.
|
Administrative division (of dairy shed) |
Size (sq. km) |
Population |
Population growth rate (percent per annum) |
|
|
|
|
19xx |
19yy |
|
|
|
|
|
|
|
|
|
|
|
|
|
|
Dairy she overall |
|
|
|
|
HOUSEHOLD LEVEL DAIRY CONSUMPTION SURVEY
Enumerator note: A shortened questionnaire is attached for "Edge unit" households, i.e. those households which have not consumed any dairy product in the last 7 regular days. Begin your interview by finding out if the household has or has not met this condition. If you determine that the household is an edge unit, use the shortened questionnaire.
1. Date of Interview [ | | | | | ] Location and Identification of Survey HH:
2. Name of Enumerator ___________________ [ | ]
3. District ___________ [ | ] 4. Division ___________ [ | ]
5. Location ___________ [ | | ] 6. Village ___________ [ | | ]
7. Household Classification 1 = Rural 2 = Urban 3 = Peri-urban
8. Is there electricity in the house? Yes/No
9. If "Yes", do you have a refrigerator? Yes/No
Demographics
10. Who makes the decisions about what foods are purchased? i.e. who manages the HH food budget?
HH Head: Male HH Head: Female Wife #1 Wife #2 Daughter Son
Other (specify) ___________
11. If the food budget manager is not the HH head, who is the HH head?
Husband Grandfather Mother #1 Mother #2 Grandmother Daughter Son
Other (specify) ___________
12. Respondent's position in HH (if not the food budget manager or HH head)
13-16. FBM's: Sex [ ] Age [ | ] Ethnic Group ________ [ | ] Religion [ | ] ________
17. FBM's education level No formal [ ] Adult literacy [ ] Primary only [ ] Secondary [ ] Beyond secondary [ ] Other [ ]
18-21. Head of household's: Sex [ ] Age [ | ] Ethnic Group ________ [ | ] Religion ________ [ ]
Household Size and Structure
22. Total No. HH members [ | ]
|
23. |
< 2 yrs |
2-10 |
11-15 |
16-30 |
31-50 |
> 50 yrs |
|
Male |
|
|
|
|
|
|
|
Female |
|
|
|
|
|
|
|
|
+ |
+ |
+ |
+ |
+ |
= total HH? |
Dairy Product Consumption
24. Below is a list of dairy products* commonly eaten in this area. How frequently is each dairy product eaten by this household?
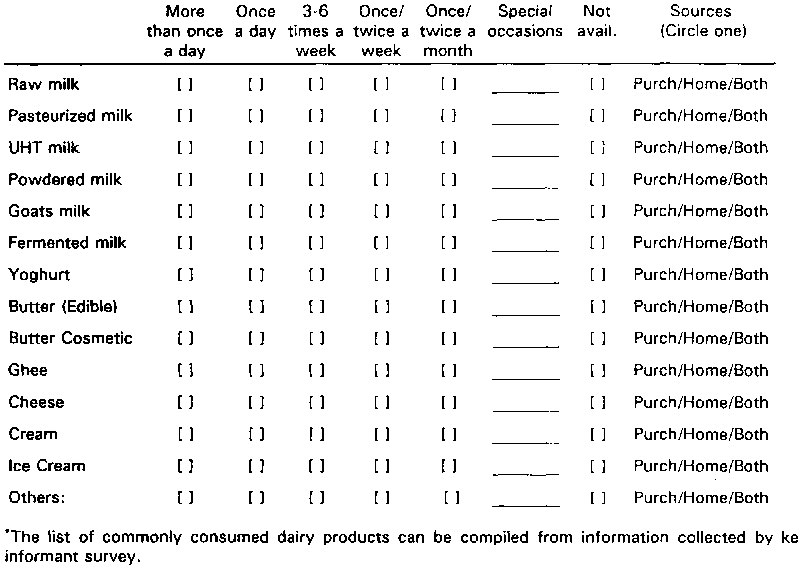
* The list of commonly consumed dairy products can be compiled from information collected by key informant survey.
25. For each dairy product eaten more than once/twice a week, complete one of the following formatted pages.
|
Dairy Product: |
||||||||||||||
|
Quantity eaten by the household at a time |
__________/__________/__________ (Not/unit/time) |
|||||||||||||
|
How is the product eaten? |
by itself |
used as ingredient |
processed into: |
|||||||||||
|
Complementary foods/beverages consumed with the dairy product? |
Complements ___________ ___________ ___________ |
|||||||||||||
|
Sources of this dairy product |
Source(s) |
Purchase source 1: |
Purchase source 2: |
Home produced/prepared |
||||||||||
|
Quantity and frequency of purchases/home production |
___/___/___ |
___/___/___ |
___/___/___ |
|||||||||||
|
Price/unit |
|
|
|
|||||||||||
|
Distance of source (minutes) |
|
|
|
|||||||||||
|
Are there times when the product disappears from/is not available on the market? |
J |
F |
M |
A |
M |
J |
J |
A |
S |
O |
N |
D |
Season |
|
|
If this product is not available, what do you substitute for it? |
No substitute (do without it) |
|||||||||||||
|
Among the months when it is available, are there months when you cannot afford to purchase and consume it? |
J |
F |
M |
A |
M |
J |
J |
A |
S |
O |
N |
D |
Why? |
|
26. Are there dairy products which you would like to consume but which the market does not offer?
> ___________ [ | ]
> ___________ [ | ]
> ___________ [ | ]
____________________________________________________________
Attitudes and Beliefs about Dairy Products and HH Food Budget
27. How do you prepare fresh milk before you drink it? (PLEASE NUMBER THE STEPS.)
Filter ____ Cooling ____ Boiling ____ Bottling/Packaging ____ Other (specify) ____
28. Are there times, or particular individuals who should not eat certain dairy products?
|
Who? |
What dairy product? |
When not to have it? |
Why? |
|
_____ |
______________ |
_______________ |
_____ |
|
_____ |
______________ |
_______________ |
_____ |
|
_____ |
______________ |
_______________ |
_____ |
29. Are there times, or particular individuals who should eat certain dairy products?
|
Who? |
What dairy product? |
When they should have it? |
Why? |
|
_____ |
______________ |
_________________ |
_____ |
|
_____ |
______________ |
_________________ |
_____ |
|
_____ |
______________ |
_________________ |
_____ |
30. Who is given or drinks the most milk in your household?
|
|
< 2 yrs |
2-10 |
11-15 |
16-30 |
31-50 |
> 50 yrs |
|
Male |
|
|
|
|
|
|
|
Female |
|
|
|
|
|
|
|
|
|
|
|
|
|
|
31. Dairy Product Preferences
Below is a list of dairy products grouped in pairs. Assuming availability and price are not of concern, which dairy product would your household prefer over the other, and WHY?
(Note: Products MUST be equal substitutes! The products listed below are examples from Kenya of substitute dairy products. Actual products will differ by survey area and researchers must determine the products to be listed based on prior knowledge, e.g. key informant survey.)
|
Dairy Products |
Preferred |
Why? |
|
i. Milk Products |
|
|
|
> Cow or goat's milk |
__________ |
__________ |
|
> Fresh (raw) cow's milk or pasteurized milk |
__________ |
__________ |
|
> Fresh (raw) cow's milk or UHT milk |
__________ |
__________ |
|
> Pasteurized milk or UHT milk |
__________ |
__________ |
|
ii. Fermented/Sour Milk Products |
|
|
|
> Home-made yoghurt or commercial "BIO" yoghurt |
__________ |
__________ |
|
> Home-made yoghurt or commercial "Mugumu" yoghurt |
__________ |
__________ |
|
> "BIO" yoghurt or "Mugumu" yoghurt |
__________ |
__________ |
|
iii. Cooking Fats/Oils/Ghee/Margarine |
|
|
|
> Local ghee or "Kimbo" cooking fat |
__________ |
__________ |
|
> Local ghee or "Rama" cooking fat |
__________ |
__________ |
|
> "Kimbo" or "Rama" cooking fat |
__________ |
__________ |
|
iv. Edible spreads (e.g. butter, margarine, etc.) |
|
|
|
> "KCC" butter or "Irish Spring" butter |
__________ |
__________ |
|
> "KCC" butter or "Blue Band" margarine |
__________ |
__________ |
|
> "Irish Spring" butter or "Blue Band" margarine |
__________ |
__________ |
|
v. Cheeses |
|
|
|
> "KCC" cheddar or "Rift Valley" cheddar |
__________ |
__________ |
|
> "KCC" cheddar or "Ol Doinyo" cheddar |
__________ |
__________ |
|
> "Rift Valley" cheddar or "Ol Doinyo" cheddar |
__________ |
__________ |
|
vi. Cosmetic butters/fats/oils |
|
|
|
> Shoa butter or Debre Zeit butter |
__________ |
__________ |
|
> Shoa butter or Addis butter |
__________ |
__________ |
|
> Debre Zeit butter or Addis butter |
__________ |
__________ |
32. What prevents you from consuming more dairy products? (If more than one constraint is mentioned, number the constraints in descending order of their severity.)
|
High price |
Not available |
Insufficient household income |
Fear of disease/contamination |
|
Do not need/require more |
Do not like taste |
Spoilage |
Other (specify) |
Dairy Product Disposal
33. Is any milk being produced by this household? Yes/No
If "Yes":
|
Milk Production |
Daily HH Production |
Daily HH Consumption |
Processed |
Sold |
|
|
(Qty/unit) |
(Qty/unit) |
(Qty/unit/time) |
(Qty/unit/time) |
Household Income
34. How much money are you spending on average each week for food (including dairy products) for the household? [ | | | ]
35. To which of the following income categories does your household belong (Enumerators note! This is total household income from all sources.)
Example based on KENYA, 1992 minimum wage rate of shillings 1500 per month.
|
Household Income Range |
Household Income Range |
Tick the appropriate box |
|
< 1/2 monthly minimum wage |
< Shs 750 |
|
|
1/2 - 1 × monthly minimum wage |
Shs 750 - 1500 |
|
|
1 - 2 × monthly minimum wage |
Shs 1501 - 3000 |
|
|
2 - 4 × monthly minimum wage |
Shs 3001 - 6000 |
|
|
4 - 8 × monthly minimum wage |
Shs 6001 - 12000 |
|
|
8 - 16 × monthly minimum wage |
Shs 12001 - 24000 |
|
|
> 16 × monthly minimum wage |
> Shs 24000 |
|
36. Consumption Frequency Checklist
"EDGE UNIT" HOUSEHOLD QUESTIONNAIRE
Enumerator note: The following shortened questionnaire is to be used for "Edge unit" households, i.e. those households which have not consumed any dairy product in the last 7 regular days.
1. Date of Interview [ | | | | | ] Location and Identification of Survey HH:
2. Name of Enumerator ___________________ [ | ]
3. District ___________ [ ] 4. Division ___________ [ | ]
5. Location ___________ [ | | ] 6. Village ___________ [ | | ]
7. Household Classification 1 = Rural 2 = Urban 3 = Peri-urban
8. Is there electricity in the house? Yes/No
9. If "Yes", do you have a refrigerator? Yes/No
Demographics
10. Who makes the decisions about what foods are purchased? i.e. who manages the HH food budget?
HH Head: Male HH Head: Female Wife #1 Wife #2 Daughter Son
Other (specify) ___________
11. If the food budget manager is not the HH head, who is the HH head?
Husband Grandfather Mother #1 Mother #2 Grandmother Daughter Son
Other (specify) ___________
12. Respondent's position in HH (if not the food budget manager or HH head)
13-16. FBM's: Sex [ ] Age [ | ] Ethnic Group ________ [ | ] Religion [ | ]
17. FBM's education level No formal [ ] Adult literacy [ ] Primary only [ ] Secondary [ ] Beyond secondary [ ] Other [ ]
18-21. Head of household's: Sex [ ] Age [ | ] Ethnic Group ________ [ | ] Religion ________ [ ]
Household Size and Structure
22. Total No. HH members [ | ]
|
23. |
< 2 yrs |
2-10 |
11-15 |
16-30 |
31-50 |
> 50 yrs |
|
Male |
|
|
|
|
|
|
|
Female |
|
|
|
|
|
|
|
|
+ |
+ |
+ |
+ |
+ |
= total HH? |
Dairy Product Consumption
24. Below is a list of dairy products* commonly eaten in this area. How frequently is each dairy product eaten by this household?
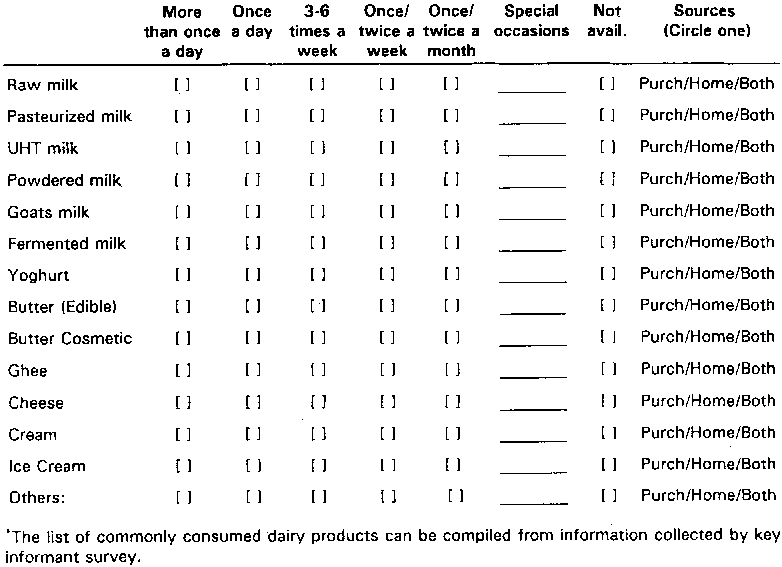
* The list of commonly consumed dairy products can be compiled from information collected by key informant survey.
25. What prevents you from consuming more dairy products? (If more than one constraint is mentioned, number the constraints in descending order of their severity).
|
High price |
Not available |
Insufficient household income |
Fear of disease/contamination |
|
Do not need/require more |
Do not like taste |
Spoilage |
Other (specify) |
Household Income
26. How much money are you spending on average each week for food (including dairy products) for the household? [ | | | ]
27. To which of the following income categories does your household belong (Enumerators note! This is total household income from ail sources.)
Example based on KENYA, 1992 minimum wage rate of shillings 1500 per month.
|
Household Income Range |
Household Income Range |
Tick the appropriate box |
|
< 1/2 monthly minimum wage |
< Shs 750 |
|
|
1/2 - 1 × monthly minimum wage |
Shs 750 - 1500 |
|
|
1 - 2 × monthly minimum wage |
Shs 1501 - 3000 |
|
|
2 - 4 × monthly minimum wage |
Shs 3001 - 6000 |
|
|
4 - 8 × monthly minimum wage |
Shs 6001 - 12000 |
|
|
8 - 16 × monthly minimum wage |
Shs 12001 - 24000 |
|
|
> 16 × monthly minimum wage |
> Shs 24000 |
|
28. Consumption Frequency Checklist
In the unregulated, informal markets that predominate in many rural areas, dairy products are sold or traded in many forms and measures, some of which can be highly location- specific. Nevertheless, these measures are usually well understood by local consumers and are regarded as legitimate standards of measure. It is recommended that data collection involving quantities be gathered using local standards of measure. Doing so will have the twofold advantage of allowing respondents to use quantities with which they are familiar and can estimate accurately. In turn, this will facilitate collection of more accurate data and reduce the chances of non-sampling errors. It does, however, complicate the work of the researcher who must convert the local measures into standards which are widely recognised, such as litres, kilograms etc. This is not so difficult if the local measures are some form of commercially marketed container on which the volume is indicated. However, if the local measure used is not one of these, say for instance a calabash, then it will be necessary to calculate the volume or weight of the measure by emptying the contents into a calibrated container or weighing a reasonable number of samples and obtaining an average value. Furthermore, this will be necessary for each of the different dairy products as densities, and hence weights, will vary.
There still remains the problem of expressing total quantity of dairy products consumed: how does one add together products which are not of the same form, such as milk and butter? To resolve this problem, and to account for the fact that making a kilogram of butter requires an estimated 6.6 litres of milk, the concept of liquid milk equivalents (LME) is introduced. Quite simply, the LME of a dairy product is that quantity of whole liquid milk which is required to make the dairy product in question. Normally, LMEs are expressed in kilograms. Table 9 lists LME conversion factors calculated by the United Nations Food and Agriculture Organisation for various dairy products. The CF follows these conversion factors.
Table 9. Conversion factors expressed as kilograms of whole liquid milk equivalent (LME) per kilogram of milk product.
|
Product (1.0 kg) |
Conversion factor (kg LME) |
|
Fresh milk |
1.0 |
|
Skim and whole milk powder |
7.6 |
|
Condensed and evaporated milk |
2.0 |
|
Cheese and curd |
4.4 |
|
Butter |
6.6 |
|
Butter oil |
8.0 |
|
Other products |
2.0 |
Source: FAO (1978)
Similarly, respondents should be allowed to answer questions using the time reference best known to them, i.e. daily, weekly, monthly etc. It will then be necessary to standardise these time references prior to analyzing the data.
From the standpoint of nutritional assessment, it is important to recognise that caloric requirements differ according to the age and sex of an individual. For this reason, the preferred human unit of measure is the consumer unit. Table 10 provides conversion factors for translating per capita consumption into consumer units. This assumes, of course, that information is available regarding the "structure" of each household, i.e. the composition of the household by age and sex of its members.
Table 10. Conversion factors for calculation of consumer units (CU).
|
|
Age classes |
|||||
|
< 2 years |
2 - 10 years |
11 - 15 years |
16-30 years |
31 - 50 years |
> 50 years |
|
|
Male |
0.35 |
0.6 |
0.8 |
1.0 |
1.0 |
0.8 |
|
Female |
0.35 |
0.6 |
0.7 |
0.8 |
0.8 |
0.65 |
Source: adapted from Leegwater et al (1990).
Having standardised the products, frequency of consumption and consumer units of measure, one can now sum, analyze and compare results from data involving dairy products of different types consumed at various time intervals by individuals of different ages and gender.
In applying the foregoing methodology, one will have formulated hypotheses regarding household consumption behaviour and its determinants. These hypotheses speculate on relationships between dairy consumption and various household attributes such as income, ethnicity, location and others. In order to properly test the hypotheses, it is important that the household sample drawn adequately displays the full range of these attributes, i.e. it is representative of the household population. Careful stratification will increase the likelihood that the household sample selected will reflect the variation of the desired attributes in the household population.
Key variables of interest are specified in the stated hypotheses. Begin the sample design by obtaining through key informants and secondary sources as much information as possible regarding the geographical distribution of these characteristics. Determine if these characteristics are distributed with any clear patterns. If they are, then these patterns should be taken into account when selecting the sampling clusters. For example, if income is hypothesised as a key determinant of dairy consumption, ensure that households of all income levels are represented in the sample to be surveyed. Moreover, to ensure that a particular income group is not over- or under-represented, apportion the clusters to be sampled in accordance with each group's occurrence in the population. Sometimes this information will be available from government sources such as the Central Bureau of Statistics, or possibly it may be extracted from previous surveys. Accord each group or stratum its appropriate number of clusters from among the total number of clusters to be sampled in the dairy shed. From the subtotal of clusters belonging to the given stratum, draw at random that number of clusters which-has been apportioned to it. Continue in this fashion for the other strata to be sampled. The resulting stratified sample should reproduce the population mixture. Following this procedure will increase the likelihood of capturing key consumption determinants as well as ensuring the representativeness of the survey results. However, to avoid sampling errors and to ensure comparable data sets, it is imperative that identical stratification criteria are used across sites. The table below illustrates how, by careful definition, stratification can be uniformly applied.
Table 11. Criteria for stratification of households by location.
|
Location Type |
Attributes |
|
Urban |
Within a town or city municipal limits |
|
Majority of homes have indoor, potable water supply |
|
|
Majority of population has ready access to telephone service |
|
|
Main roads are tarmac surfaced |
|
|
Majority of households infrequently or never engage in farming activities |
|
|
Peri-urban |
Outside a town or city/municipal limits |
|
Minority of the homes have electricity |
|
|
Minority of the homes have indoor, potable water supply |
|
|
Majority of homes have access to piped water |
|
|
Telephone service in the area is limited |
|
|
Main roads may not be tarmac but are all-weather roads |
|
|
There is feasible access to a town or city for a commuting (i.e. daily) work force |
|
|
Some households maintain farms but it is not a farming-based community |
|
|
Rural |
Fails to meet the foregoing tests for urban or pert-urban locations |
N.B. In order to be classified as an urban or pert-urban location, it is required that the area under consideration meet all of the criteria specified for that location type.
The computation of the mean per stratum (where stratification has been used) is given as:

where 
for n primary units, m, cluster size for ith primary unit and Zi is the cluster mean.
An unbiased estimator of the variance, if the initial sample is selected without replacement, is given by:
Var 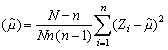
If stratification has been used, then the above estimates will represent those of the strata. Estimates of means and variances may then be combined using known (well-documented) procedures (see Cochran, 1963).