![]()
![]()
![]()
3.1 Formulate research questions and hypotheses
3.2 Determine the methods of analysis
3.3 Determine the information to he collected
3.4 Identify the sources of information
3.5 Determine the method of data collection for each source
3.6 Develop field instruments
3.7 Coding and management of data
3.8 Data analysis
In the general Conceptual Framework for Market-Oriented Dairy Research (Rey et al., 1993), the following steps are suggested for characterization of a dairy marketing system:
· formulate questions and hypotheses to be answered or tested in relation to perceived problems;· determine the analytical methodologies to be used to answer the formulated questions and to test the hypotheses;
· in accordance with the questions, hypotheses and analytical methodologies selected, define the data needs;
· define the sources of the data required;
· determine the most appropriate data collection methods for these sources; and
· where primary data collection is deemed necessary, design the survey including sample selection procedures and the field instrument, then computerize data; and
· analyze.
The iterative sequence of these steps are shown in Figure 2. These steps will promote efficiency in the choice of analytical methods, data and data sources, method of collection, and sample design. Each of the identified steps is discussed below with reference to its application.
The search for a solution to any problem starts with a good understanding of the problem and its probable origin. Researchers in a team may differ in their perception of a problem but common ground about the system being studied is imperative to formulate the research questions and hypotheses to be answered or tested. Researchable issues can be identified by looking at the goals and objectives of the participants in the dairy marketing system and how various factors such as government regulations, infrastructure, size of market, credit, etc. interfere with or promote achievement of the marketing goals.
A number of possible hypotheses related to dairy marketing systems are presented in Table 3. The hypotheses are classified into the four aspects of a dairy marketing system mentioned earlier. While the objective is to describe dairy marketing as a whole, a specific hypothesis deals with only one portion or aspect of the system. The list of hypotheses is not exhaustive. Based on specific circumstance or location, some hypotheses may be dropped as not relevant and/or additional hypotheses may be formulated as required. For example, a marketing chain or a milk shed may not have any processing plant, any processing being done at producer level. In this case, the hypotheses related to processing enterprises are not relevant for that location. Subject to this adjustment, the list of hypotheses may constitute the minimum common set of hypotheses which together will characterize the system.
The type of data to be collected is determined by one's research objectives and associated costs of data collection (Scherr and Vosti, 1993). It is essential to determine ahead of time the theoretical concepts and methods to be used to analyze the data and test hypotheses. Different analytical methods require different types of data. Based upon the method of analysis to be used, specific data requirements can be identified. For example, seller concentration may be used as one of the measures of market structure. Again, seller concentration may be measured in a number of ways, for example by fitting a Lorenz Curve or by the following ratio: C = S/P. 100, where C is the concentration ratio, P is the total output or sales of an industry or market, and S is the output or sales of a certain number, say 5 or 10, of the largest firms in the industry or market. Similarly, marketing margins, and spatial or temporal price correlations may be used as some of the measures of marketing efficiency. Each of these measures requires different data.
Simple analytical tools such as descriptive statistics (percentages, mean, mode, median, standard deviation, coefficient of variation etc.) will often suffice in quantifying the descriptors of the marketing system. But where it is desired to test hypotheses or to explore cause-effect relationships, it will be necessary to employ economic and marketing theory and concepts, and statistical methods such as ANOVA, correlation and regression analyses. Collection of data required for the chosen analytical technique has to be planned ahead of time. A variety of methods for data collection and analysis in marketing research suitable for specific problem situations are illustrated in Scott (1995).
Sometimes questionnaires for field data collection are constructed to collect as much information as possible, with the hope that the use and relevance of the data will appear during analysis or that the data may be used for some future objectives (Malik, 1993). Experience has shown a number of disadvantages associated with this approach:
· respondents become bored with long interview/questionnaires resulting in poor data quality and unwillingness to cooperate in subsequent surveys;· omission of relevant information due to overloading the survey instrument; and
· inefficient use of resources when analysis eventually makes use of only a fraction of the data collected.
All the information collected should be relevant and useful in answering specific questions or testing hypotheses already selected or stated. The data collected should also be compatible with the analytical methods chosen. In Table 3, each of the suggested hypotheses is matched with the data required for its testing as well as the source of data. Some data may contribute to testing several hypotheses. The data listed in Table 3 have to be manipulated to derive other categories of data for testing hypotheses. For example, market share of processed and non-processed products in total sales have to be calculated from raw data on volume of sales of different types of products.
Figure 2. Steps to be followed in characterizing a dairy marketing system.
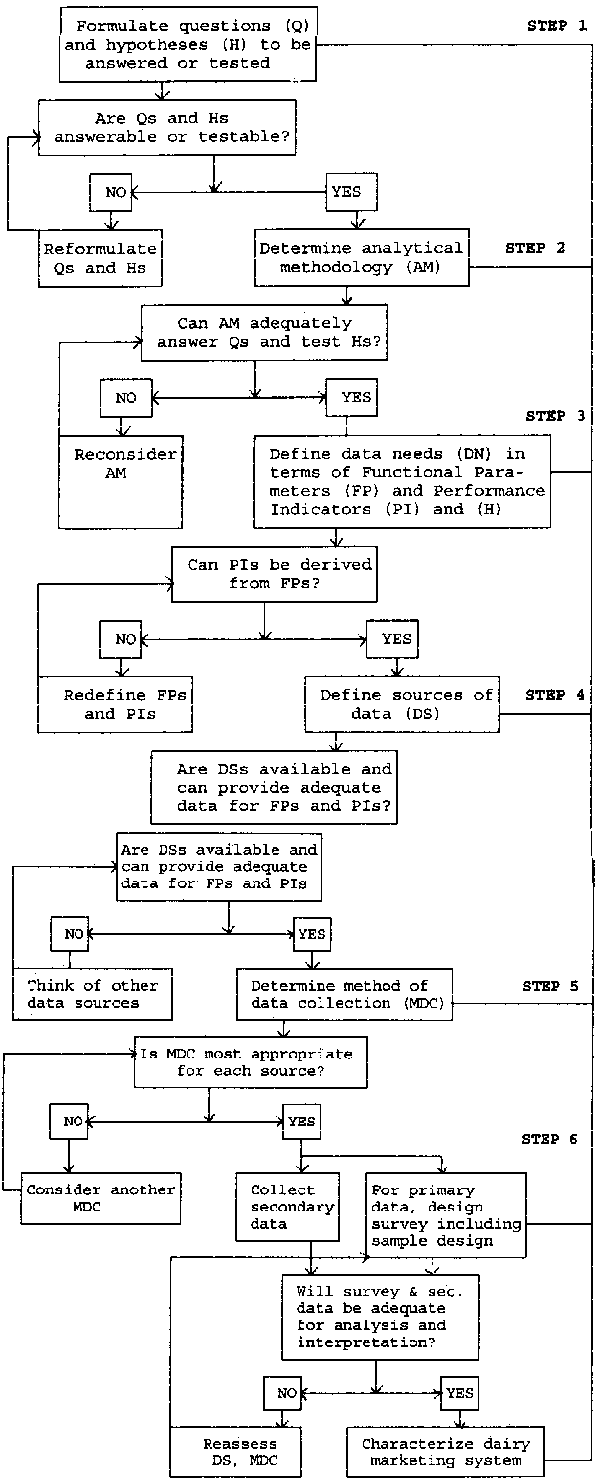
Table 3. Some hypotheses on dairy marketing, data required for their testing and sources of information.
|
Hypotheses |
Main Data Required |
Sources of data |
|
Dairy Products |
|
|
|
1. The share of processed and standardized dairy products marketed in formal markets is greater than that in informal markets |
- Volume of sales of standardized vs non- standardized dairy product per market |
Marketing agents |
|
2. As income and degree of urbanization increases, more standardized dairy products are marketed |
- Number of dairy products marketed that meet minimum quality standards |
Marketing agents |
|
3. Marketed surplus of milk primarily depends on output level, family size, input and output prices, access to market, access to market information, nature of dairy development project (credit, input supply, sales obligations) |
- Output, family size, home consumption, |
Producers |
|
SIZE, STRUCTURE AND ORGANIZATION |
|
|
|
4. Number and types of intermediaries are larger in informal than in formal markets, and number of intermediaries are larger where dairy density (dairy output per square km) is higher |
- Number of middlemen between producer and consumer for formal and informal markets |
Marketing agents |
|
5. Intermediaries in formal markets are more organised and vertically integrated than in informal markets |
- Vertical links in the marketing chain |
Marketing agents |
|
6. Among producers and retail traders, women and children perform more dairy marketing activities than men |
- Household size and composition of producers and retail traders |
Marketing agents |
|
7. Urbanization and growth in per capita income both contribute to increased dairy production |
- Sizes of urban population and population growth |
Secondary sources |
|
8. Size and location of formal processing facilities determine size of milkshed and number of intermediaries |
- Size and location of processing plants |
Marketing agents |
|
MARKET POLICY AND |
|
|
|
9. Regulations on price, quality and system of payment in formal markets influence the decisions by small-scale farmers to sell milk in that market |
- Nature of regulations in formal markets |
Marketing agents |
|
10. Type of dairy processing used is influenced by the availability of technologies (for storage, cooling, bulking), the size of the market, access to producers, access to credit and consumer preference |
- Type of processing technologies available |
Consumers |
|
MARKET CONDUCT AND |
|
|
|
11. Unit marketing costs of large-scale commercial dairy enterprises are lower than those for small-scale enterprises |
- Quantities of dairy products produced |
Marketing agents |
|
12. Price received and transaction costs are important factors for producers in decisions about the market outlet(s) to be used |
- Formal and informal market price of milk |
Producers |
|
13. Price of milk is inversely related to market supply in particular season of the year |
- Quantities sold per season |
Marketing agents |
|
14. Spatial and temporal variations in farm gate prices are higher than those for retail prices |
- Farm gate and retail prices by location, distance and season |
- Marketing agents |
|
15. Small scale processing units are more productively efficient than large scale processing units |
- Processing plant size, volume of business |
- Processing plants |
|
16. Private processing plants are more productively efficient than in parastatal plants |
- Capacity utilization |
- Processing plant |
|
17. Underutilization of capacity in dairy processing industry exist due to lack of local supply, seasonal fluctuation in supply, small and scattered production units, poor and seasonally impassable roads, inappropriate transport |
- Capacity utilization |
- Processing plant |
|
18. In informal markets, market agents are competitive; margins reflect costs not excess profits. In formal markets, margins may fail to cover costs |
- Marketing margins, marketing costs, profits of firm in informal and formal markets |
- Marketing agents |
|
19. Absence of excess profit does not imply marketing operations are performed at least cost or at consumers' satisfaction or that various market functions are operationally efficient |
- Profits, costs, consumer preferences |
- Marketing agents |
In this step the best source(s) of the information necessary for characterizing the marketing system are to be identified. The data source(s) chosen should combine quality attributes of reliability and accuracy while considering access and ease of data acquisition. Potential sources for secondary and primary data on the marketing system are:
Published materials, official statistics, "grey" literature (documents with limited circulation). Sources included in this category are publications and reports prepared by government statistics offices, Ministries of Agriculture, Livestock, Cooperatives, Trade, Industry and Planning, the customs department, dairy boards, produce marketing organizations, urban councils, cooperatives, national and international research institutes, university departments (e.g. Agricultural Economics, Economics, Commerce, Business); development and cooperative banks, the World Bank, FAO, bilateral development agencies (e.g. USAID, ODA, GTZ, FINNIDA, IFAD); and non-governmental organizations.
Key informants. These are individuals who are knowledgeable about a subject, and are willing to share their knowledge. As with researchers, perceptions and views about a particular problem or issue may differ among key informants, so a chain of informants would be useful to achieve consensus of opinions. An example of a key informant chain for a marketing system would be a retail shop/supermarket manager, a dairy board or cooperative manager, an extension agents and a village head. Holtzman (1986) has given a comprehensive listing of key informants, particularly in relation to food grain marketing, including a description of the advantages and disadvantages of each key informant as a source of data.
Marketing agents. These are individuals, groups of individuals or organizations that facilitate the flow of dairy products from producers to consumers through various activities such as production, purchase, processing and sale. Examples of market agents include farmers selling dairy products, retailers, wholesalers, or supermarket owners trading dairy products, produce marketing organizations, dairy boards, cooperatives, importers and exporters.
In Table 3, possible source(s) of data for testing different hypotheses are shown. Marketing agents are the focal point for data collection. They constitute the unit of observation and it is at this level that most primary marketing data are collected. More importantly, the concept of a marketing system is largely built around the activities and arrangements made by marketing agents, individually or collectively, to move dairy products from producers to consumers.
Dairy marketing systems may differ depending upon a number of factors (e.g. physical and policy environment, organizational arrangements, marketing channels, etc.) so that the appropriate method for collecting information will depend upon the marketing system being considered. Group interviews that might be used to collect information from members of a dairy cooperative, for example, probably would not be used to interview dairy board or cooperative managers, supermarket managers or customs officials.
Data collection methods will also differ depending upon the type of data sought and the sources from which they are to be collected. Data are classified into two general types: qualitative and quantitative. Qualitative data produce descriptions of situations, events, policy environment, people and systems interactions. Quantitative data are collected when a number, ratio or proportion related to the target population is to be estimated (Casley and Kumar, 1988; Frankenberger, 1992). For the functional parameters and performance indicators identified in Table 2, quantitative data are appropriate and may be collected from secondary or primary sources. When collected from secondary sources, the method of collection is straightforward, being consultation of previously published and unpublished records. Collection of primary data on a dairy marketing system entails more detailed methodologies and requires an informal or a formal survey.
Data collection methods are selected once the required data and their source(s) have been defined. Alternative methods should be considered before making a choice as more than one method may contribute toward proper characterization of the system. Mettrick (1993) recommended a combination of group interviews, case studies, formal and informal surveys as appropriate for collecting information on a marketing system. Brief description of these data collection methods are as follows:
Group interview: Open-ended discussion with a group of respondents sharing resources or activities. Group interviews are useful for tapping the collective wisdom or memory of a community or organization. For example, dairy producers and traders operating in a milk or dairy shed may constitute two independent groups for interview.
Case study: Detailed study of a small number of units, selected as representative of the target group(s) relevant to the issue under consideration, but not necessarily representative of the population as a whole (Casley and Lury, 1982; Pableo and Ignacio, 1986). Case studies are appropriate when a detailed understanding of complicated relationships is considered more important than ensuring a sample representative of the entire population.
Informal survey: A semi-structured but systematic activity designed to quickly acquire new information on, or to generate new hypotheses about, a subject of interest or an area. Often a multidisciplinary team conducts the survey to cover different interrelated dimensions about the subject. It is appropriate when the need is for understanding rather than quantifying a system. Informal surveys can be followed by a small-scale, focused verification survey to improve credibility. It forms the basis for decisions on the important information that should be quantified in the verification survey, how the questions should be structured and how a representative sample should be chosen (CIMMYT, 1980). Informal survey methods are most appropriate for collecting qualitative data. These data can be obtained during group or individual interviews with key informants or marketing agents. In relation to dairy marketing analysis, the following steps are suggested:
(1) Identify a set of key informants for each type of dairy product marketed in the different areas of a milk shed. This may be done by contacting the extension service of the Ministries of Agriculture and Livestock, dairy cooperatives, cattle breeders' associations, etc. Selection of key informants should ensure that there is adequate geographic coverage to permit a sense of variation in the information being collected from them.(2) Develop a topical outline with questions targeted at each dairy product marketed but allowing for additional topics to be incorporated as they arise during the informal discussion with key informants. An example of the kinds of information to be collected is presented in Annex 1.
(3) Depending upon the number of key informants and their locations, convene group or individual meetings during which informal discussions are held with them on how the dairy marketing system for each product is organized, who is involved in the process, and the marketing nodes. Group meetings may be organized for farmers who produce and sell fresh milk whereas individual meetings can be held with managers of supermarkets and dairy processing plants.
(4) From the discussions, it should be possible to develop for each of the dairy products marketed, a list of their sources and outlets, estimate of the number and type of agents involved, their location, etc. A principal objective of this exercise should be to develop an idea of those variables which influence the structure, conduct and performance of the market. A critical part of informal survey by a team is the sharing and compiling of notes from the interviews to create a genuine and substantive consensus about the issues involved.
When sample units consist of farmers who produce and sell milk, or members of a dairy cooperative, convening group meetings to discuss marketing issues is often relatively easy.
However, this may not be the case when sample units consist of traders, households or food institutions. In such cases, a moving key informant survey is necessary. Careful consideration must therefore be given to ensuring good geographical coverage of the dairy shed in order to avoid omitting units in some areas, and thereby possibly distorting or introducing "bias" into the survey.
Formal survey: A questionnaire-based survey of a sample of respondents who are representative of a particular population. Formal surveys are indicated when valid statistical inferences are needed. Sample size should be sufficiently large to allow making these inferences. Formal survey methods are most appropriate for collecting quantitative data on functional parameters and performance indicators. If a random sample is desired, then the sampling method must ensure that the sample from which the data are collected is representative of the population. Choosing a representative sample generally requires a comprehensive sampling frame. A sampling frame is a complete list of the population about which one wishes to collect information. For a dairy marketing system, the population includes all the individuals and institutions (marketing agents) involved in the sale of dairy products. These can be classified into the following broad categories:
· farmers who produce and sell dairy products;· individual traders or other plants and organizations that purchase, collect, process and resell dairy products; and
· facilitating organizations such as marketing boards.
Sample frames containing all of these sampling units are often difficult to find. When a suitable sampling frame cannot be found, one may be constructed through key informant surveys using the steps outlined above. Lists of the types of individuals and organizations needed may be compiled based on information from the key informants. This information can then be used to design and plan a formal survey in terms of choosing the sampling units, sample size, criteria for sample selection, and questionnaire design. When an adequate or reliable frame cannot be developed from informal interviews, sample may be taken by "select as encountered' method within the geographical area being considered.
In a few cases, however, sample frames may be available through the extension service, Ministries of Agriculture and Livestock, dairy cooperatives, or through development assistance agencies. Before one uses a sampling frame to select a sample, care should be taken to ensure that the frame is up-to-date, complete and fulfills all predetermined criteria set for sample selection. Sample selection can be carried out as follows:
(1) Determine the unit of analysis. Examples include farmers who produce and sell dairy products, itinerant traders, food institutions (e.g. hotels, restaurants), retail and wholesale shops, supermarkets, public and private organizations (e.g. schools, hospitals), and processing plants.(2) Define the boundary of a dairy shed, or a marketing chain which may be considered as the next higher level of sampling and analytical unit. Based on the information collected during the informal diagnostic survey, establish the geographical distribution of these sampling units within the dairy shed or marketing chain. Sampling units may be widely distributed within the dairy shed or they may exhibit particular patterns of distribution. Retail shops carrying dairy products, for example, may be concentrated in the city center whereas itinerant traders may be evenly distributed throughout the city. Farmers, on the other hand, may be found exclusively in rural and/or pert-urban areas. Dairy processing plants may be located in industrial areas.
(3) Identify important determinants of the distributional patterns of the sampling units. An example for agents who sell fresh milk is the distance from their collection point(s) to the market. For farmers who produce and sell fresh milk, their distribution may be determined by the size of their holding. Small farms (1 to 3 dairy cows) may be located in pert-urban areas whereas larger farms (> 3 dairy cows) may be found in rural areas.
(4) Form clusters of sampling units to cover the dairy shed such that the clusters are representative of the determining factors. For example, form clusters of dairy producers, processors and retailers then sample clusters on the basis of (i) the total number of clusters, (ii) their geographic distribution and (iii) variation of determinants, e.g. distance, type of products handled.
(5) For each sample cluster, develop a list of sampling units from which a sample should be randomly selected. Sample size should be guided by the estimated population, number of units within the cluster, and variation within the population, bearing in mind that the overall sample size should be large enough to permit statistical analysis. To avoid over- or under-representation of particular characteristics, the number of units to be surveyed should be proportional to the distribution within the cluster.
(6) Where considerable variation exists among units to be surveyed within a sample cluster, the sample units should be stratified to account for this variation. For example, if wide variations exist in the size of dairy herd or the type of dairy products handled, the sample should be stratified.
(7) Decide on resource constraints. Although sample size should be sufficiently large to permit statistical analysis, financial, human resource and time constraints must be taken into account prior to sample selection and survey execution. For example, where wholesalers, retail shops and food institutions are found within the same vicinity, interviews could be conducted during the same survey period.
When a priori knowledge of the size of the target population is poor, a random sample selection with a given sampling intensity may be difficult to obtain. It may then be preferable to sample purposively, i.e. sample using a sub-set of the population but whose characteristics are known and meet desired criteria.
To maximize data accuracy at the individual or organization level, efforts should be made to collect marketing information from the individual directly responsible for the acquisition, processing or sale of dairy products. For example, dairy board, supermarket or wholesale shop managers, would be the appropriate sources of information on marketing if a questionnaire were to be administered. Regardless of whether it is a formal or an informal survey, efforts should be made to use experienced enumerators who are familiar with the language and culture of the survey units and who will be permitted access to them.
As a first step to collecting information on the dairy marketing systems, secondary sources should be reviewed and discussions held with key informants. The information provided by key informants broadens the understanding of the marketing system and permits a proper design of the marketing survey instrument(s) and the sampling procedure. The proposed methodology for characterizing the dairy marketing systems anticipates that much of the information specified will require primary data collection involving surveys. Designing and organizing survey is a complex task that requires a variety of techniques and organizational skills. Earlier, four major groups of marketing agents were identified: farmers, traders (wholesalers and retailers including supermarkets, grocery shops, and itinerant traders), processing plants, and facilitating organizations. Characterization of a dairy marketing system in a specific area or milkshed requires that all four types of agents and their linkages are studied. A single survey instrument may not be appropriate or adequate for all four types of agents. However, in Annex 2 a sample questionnaire is proposed which contains the following four sections:
A: General information about a marketing agent
B.: Information about producer-sellers
C: Information about traders
D: Information about processing enterprise.
Each section is designed to generate the minimum data necessary to provide the functional parameters, the performance indicators and test the relevant hypotheses listed in Table 3. For implementation of a specific a separate questionnaire may be prepared for each type of agent by taking a combination of the four sections. For example, sections A and B may be combined to form a questionnaire to survey farmers who produce and sell dairy products, sections A and C may be combined to form a questionnaire to survey all categories of traders, and sections A and D to survey processing plants. The content of a questionnaire may also vary across locations. For example, in question 13 in Section B. butter, cheese and yoghurt are mentioned as products produced by farmers. In a particular location, there may be other and more specific products. Examples are Wara (a soft cheese), Nono (fermented milk), fura de nono (fermented milk with balls of cereal) found in West Africa and ayib (a soft cheese) found in Ethiopia. In this case, these local names should be used. The list of items included in various tables in the example questionnaire should also be changed according to prevailing condition in a location. Only a subset of the items may be relevant for a location. Actual list should be established on the basis of key informant interviews, secondary sources, and further by pretesting the questionnaire.
A formal questionnaire may or may not be needed to study facilitating organizations e.g. a marketing board, because there may be just one or two such organization in a given area. In such a situation, a case study may be appropriate.
The example questionnaire may be adjusted in order to collect data for the relevant hypotheses postulated for specific locations. No single questionnaire is adequate to collect all kinds of information. Information on the conduct of market agents is particularly difficult to illicit through surveys, and close observation and participatory methods may have to be supplemented to collect such information.
As mentioned in section 3.1, the adjusted list of hypotheses should constitute the minimum common set of hypotheses to be tested across locations. Therefore, the data listed against the hypotheses in Table 3 should also constitute the minimum data set for each location. A more systematic listing of the minimum data set, with cross reference to hypotheses is given in Table 4.
Once the survey is complete, the data should be coded, the coding plan documented and then the data should be entered into computer. Most statistical analysis packages such as SAS and SPSS have built-in data entry and management mechanisms. This approach is suitable when a small volume of data is involved. For large samples with many variables, dBase or any other standard data management package is recommended. As far as possible, the latest version of dBase or other package should be used.
Computerized data should be clearly described and documented so that the nature of data can be understood and used not only by those who are directly involved in data collection but also by others who may be interested in them at present or in the future. Properly documented and archived data often prove to be valuable treasure to future researchers. An example coding plan for data to be collected through key informant interviewers (Annex 1) is shown in Annex 3. An important feature of this coding plan is that variable names are chosen in such a way that it appears as a series. Alternatively, each variable could be given a unique name composed of permissible characters and digits but finding separate names becomes difficult when there are many variables. The advantage of using a series type variable name is that it can accommodate any number of variables, and they can be defined in a consecutive manner as the data are recorded in the questionnaire. New variables created out of original data in the questionnaire may be easily added to the series of original variables.
Since the example questionnaire in Annex 1 generated data on less than 100 variables, the names are started with V01. When over 100 variables are involved, the name may be started with V01, but V001 might be better in order to maintain symmetry in names.
A coding plan for the main survey using the example questionnaire in Annex 2 is not shown because, as mentioned earlier, the content and size of the questionnaire will vary depending on the characteristics of a location. The final questionnaire for a location will likely be much shorter with fewer variables than is indicated in the example questionnaire. A coding plan for a reduced questionnaire may be easily constructed based on the illustration in Annex 3.
The type of analysis to be done will be mostly predetermined by the choice of hypotheses and the data collected to test them.
Table 4. Minimum data set to be generated by survey for characterization of a marketing system
|
Parameters to be measured |
Related Hypotheses |
Question No. in the questionnaire |
|
1. Household size and composition |
6 |
10 |
|
2. Education, religion, age, sex of agent, their functions |
3 |
5, 6, 7, 8 |
|
3. Number, type, location of marketing agents |
4, 6 |
3, 4 |
|
4. Type of dairy products produced, consumed, processed and marketed standard non-standard |
1, 7, 3 |
13 |
|
5. Source of products marketed |
3 |
19 |
|
6. Value of each product marketed |
3 |
19 |
|
7. Functions performed by agents |
4 |
13, 14, 19, 20, 27 |
|
8. Type of contracts and links (verbal, written, formal, informal, horizontal, vertical etc.) among agents |
5 |
19, 21, 27 |
|
9. Price by season, type of product |
3, 13 |
14, 19, 21, 27 |
|
10. Means of transportation |
10, 12 |
14, 21,19, 27 |
|
11. Transportation costs |
11, 15, 16 |
20, 19, 14 |
|
12. Processing/packaging costs |
10 |
20, 22 |
|
13. Storage losses and costs |
10, 15, 16, 17 |
24 |
|
14. Size and location of processing plants, capacity and utilization |
10 |
15, 21, 25 |
|
15. Processing technologies used |
10 |
15, 22, 28 |
|
16. Source and terms of credit |
10 |
17 |
|
17. Number of dairy products marketed that meet minimum standard |
2 |
13 |
|
18. Sales obligation, involvement in dev. project, transaction costs |
3 |
17 |
|
19. Association/organization of market agents, vertical links in the marketing chain |
5 |
17 |
|
20. Product delivery terms, nature of contract |
5 |
19, 21 |
|
21. Men, women and children in dairy marketing activities |
6 |
10 |
|
22. Size of dairy enterprise |
9 |
12 |
|
23. Quantities of milk marketed in formal and informal markets |
9 |
14 |
|
24. Number of producers, volume of output marketed, number of consumers, number of traders |
10 |
13 |
Note 1: Data on policy, organizational arrangement, entry barriers, population, income, size of milkshed, tax, subsidy, credit supply etc. may be collected through key informant interviews and from secondary sources (see Annex 1).Note 2: Data for performance measurement are to be derived from the raw data listed in this table. Those derived data are not listed here.
![]()
![]()
![]()