3.1 General overview
3.2 The purchases patterns and the efficiency of the alternative marketing systems for liquid milk
3.3 The purchases patterns and the efficiency of the alternative marketing systems for butter
For the purposes of this study, any Addis Ababa household whose average monthly cash income was at least 250 Ethiopian birr was classified as belonging to High Income Group (HIG); the others were classified as Low Income Group (LIG).
The exploratory survey of the 3,888 Addis Ababa households established that only about 27% of them had acquired some milk for consumption at least once during the week prior to the day they were interviewed. Such milk had been acquired through purchases in 90% of the cases. The rest had been acquired through own-production and gifts. Hence it appears that the proportion of the households who can be described as being milk consumers in Addis Ababa is relatively small. Further, it was established that about 67% of these milk consumers were from the HIG category of households, as defined above, while about 80% of those who had acquired milk through either own-production or gifts were from the LIG category of households.
The survey of the acquisition and consumption patterns for the other dairy products gave the same type of general patterns as for fresh milk, but with some notable features as will be observed hereafter. Butter, cheese and "Ayib" and yoghurt and "Ergo" are other types of dairy products that are commonly consumed in Addis Ababa. Cooking butter, as opposed to table butter or other kinds of butter, is the commonly consumed type of butter. In principle, "cheese" and "Ayib" relate to two distinct types of products: "cheese" refers to the conventional hard cheese, while "Ayib" (an Amharic or Ethiopian ethnic language word) refers to a grainy type of Ethiopian cottage cheese. Ayib was found to be the form of cheese that is most commonly consumed in Ethiopian households. The term "Ergo" in Amharic (Ethiopian ethnic language) generally refers to sour milk, the product that can be referred to as being close to conventional yoghurt. Again, Ergo was the commonly consumed type of yoghurt in Ethiopian households.
The origins of the butter, cheese and Ayib, and yoghurt and Ergo that are consumed in Addis Ababa were found to be as follows:
i) For butter:* 98% was through purchases;
* 1% was through processing from own-produced raw milk;
* 1% was through other origins, such as processing from purchased raw milk or gifts from friends and/or relatives.ii) For cheese/Ayib:
* 92% was through purchases;
* 3% was through processing from own-produced raw milk;
* 2% was through processing from purchased raw milk;
* 3% was through other origins, including gifts from friends and/or relatives.iii) For yoghurt/Ergo:
* 52% was through processing from purchased raw milk;
* 35% was through direct purchases;
* 8% was through processing from own-produced raw milk;
* 5% was through other origins, such as gifts from friends and/or relatives.
The results of the exploratory and initial surveys are summarized in Annex Tables A.1 - A.10 in terms of:
i) the percentage distribution of the Addis Ababa households covered in the study according to their cash-income classes in different zones of the city, milk consumption status, origins of the milk and the modes of milk acquisition;ii) the rankings and the relative importance of the different reasons given by the Addis Ababa households for usually purchasing milk (and other dairy products) from particular sources and locations, according the zones of the city and income classes.
The survey results further suggest that lack of funds to purchase dairy products was the most important reason for non-acquisition of the dairy products for household consumption in Addis Ababa. Own-processing of dairy products, either from own-produced raw milk or from purchased raw milk, was found to be significant only in the case of yoghurt or Ergo.
3.2.1 The identification of alternative milk marketing systems
3.2.2. The relative importance of the alternative milk marketing systems by city zones
3.2.3. The relative efficiency of alternative milk marketing systems
The concept of alternative marketing systems as defined in this study is based on different marketing chains. Such chains were identified through the different types of sources from which the product was directly purchased by consumers. Hence it was through the survey of milk purchasing patterns of consuming households in Addis Ababa that the alternative sources of fresh liquid milk were established. Based on the results of the survey, the following were established to be the major fresh milk marketing systems:
i) direct sales to consumers by producers, which will be designated the DPR system or the system S1;ii) direct sales to consumers by Kebele1 shops and other DDE-designated sales outlets (i.e. outlets other than grocery stores, supermarkets and small private shops or kiosks). This will be designated the KEB system, or the system S2;
iii) direct sales to consumers by itinerant traders who sell milk produced by other people, which will be designated the ITR system, or the system S3;
iv) direct sales to consumers by small private shops and kiosks, which will be designated the KIO system, or the system S4;
v) direct sales to consumers by grocery stores and supermarkets, which will be designated the GRO system, or the system S5.
1 The term "Kebele" is an Amharic (Ethiopian) word and refers to an urban dwellers' association, the smallest administrative unit within an urban area or city in Ethiopia.
Figure 1 illustrates the complexity of the marketing chains which constitute the alternative marketing systems for fresh milk in Addis Ababa. The percentage share of each system in the total amount of milk purchased by the consuming households is shown in brackets. The study did not investigate the details of the intermediate stages in the marketing process.
Figure 1: Alternative marketing chains for liquid milk in Addis Ababa and their estimated percentage market shares (figures in brackets)
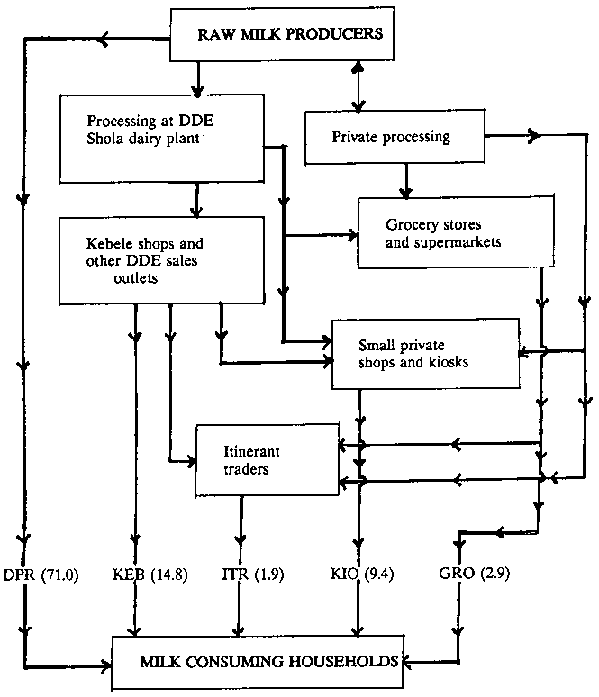
SOURCE: Subsequent survey data.
Table 1 shows the relative importance of the five different marketing systems for fresh milk in terms of their share of purchases by consuming households in the different zones of the city. The total market for fresh liquid milk in this context is defined in volume terms, rather than in terms of the number of customers.
The results presented in Table 1 demonstrate the general dominance of the direct producer-consumer marketing chain, i.e. the system designated as DRP or S1 in the marketing and distribution of fresh milk in Addis Ababa. However, the systems designated as KEB or S2 and KIO or S4 are also important, particularly in the inner and middle zones of the city. As described earlier, the KEB or S2 system relates to the purchases of milk from the Kebele shops and other DDE-designated milk sales outlets, while the KIO or S4 system relates primarily to the purchases of milk from small private shops and kiosks.
The DPR or S1 system comprises three subsystems:
i) S11 subsystem which relates to the purchases of milk directly from producers whose cows are kept in the same Kebeles where the consuming households live;ii) S12 subsystem which relates to the direct purchases of milk from producers whose cows are kept within Addis Ababa but outside the Kebeles of the consuming households;
iii) S13 subsystem relates to the direct purchases of milk from producers whose cows are kept outside Addis Ababa.
The relative dominance of the three marketing subsystems varies between the different zones of the city. The S11 subsystem is relatively more dominant in the PCZ (peripheral zone), and its relative importance declines as one moves from the PCZ into the ICZ (inner zone). The S12 subsystem is relatively more important in the MCZ (middle zone) and ICZ, while the S13 subsystem is relatively unimportant in all the zones of the city.
An analysis of the relative importance of the different marketing systems, and their subsystems where applicable, in terms of the actual quantities of liquid milk that were purchased from each system and subsystem by a given income class in a given zone of the city indicated that most liquid milk in Addis Ababa is sold through the marketing systems DPR or S1 and KEB or S2 as illustrated in Figure 1, regardless of the consumer income class.
Table 1: Relative market shares (volume) of alternative milk marketing systems in different zones of Addis Ababa.
|
Zone of the city and sample size (n = number of purchasing households) |
: % share (volume) in consuming households |
|||||
|
DPR (S1) |
KEB (S2) |
IIR (S3) |
KIO (S4) |
GRO (S5) |
All Systems |
|
|
Inner city zone (ICZ) n = 95 |
46.0 |
31.7 |
3.1 |
15.5 |
3.7 |
100.0 |
|
Middle city zone (MCZ) n = 177 |
67.7 |
16.6 |
2.3 |
8.6 |
4.8 |
100.0 |
|
Peripheral city zone (PCZ) n = 122 |
88.8 |
3.3 |
0.7 |
7.1 |
0.1 |
100.0 |
|
Addis Ababa City n = 394 |
71.0 |
14.8 |
1.9 |
9.4 |
2.9 |
100.0 |
SOURCE: Subsequent survey data: authors' work, 1984/85.
The relative efficiency of the alternative marketing systems for fresh liquid milk in Addis Ababa (i.e. systems S1 to S5) was evaluated by both least cost and other partial efficiency criteria. An index of relative least-cost efficiency can easily be constructed in cases where all systems sell the same quality of milk and those systems that charge the lowest price per litre of milk are the most efficient by the least-cost criterion. But in Addis Ababa, as in many other countries, the milk sold through the different systems is not all of the same quality and it becomes necessary to find some common standard through which different qualities of milk can be compared to each other. In many countries a minimum quality standard for commercial firms selling milk in urban areas is specified in terms of a minimum butterfat content. Such is the case in Kenya. It is true that in Addis Ababa the milk-consuming households do not seem to rank butterfat content as one of the factors which influence them to purchase milk from some particular sources more frequently than from others. Nevertheless the parastatal DDE in Ethiopia aims to sell milk with a minimum butterfat content of between 2.7% and 3.0% and there is no doubt that in many people's judgement the amount of butterfat is important in determining the quality of milk. It appears reasonable, therefore, to use butterfat content as a key standard in terms of which different qualities of milk can be compared to each other. We have also incorporated two other standards, solids-non-fat and total solids, although, as we shall see, doing so makes little difference to the result. These milk quality standards were assessed from liquid milk samples that were collected from the Addis Ababa households during the subsequent survey.
For the purpose of milk quality analysis and the evaluation of efficiency of the different milk marketing systems, the city of Addis Ababa was treated as a uniform zone because it had not been possible to procure statistically sufficient numbers of milk samples for quality analysis from each of the three zones of Addis Ababa which were delineated for use in the study during the course of collecting liquid milk samples. On the basis of MILK PRICE LEVELS, the relative efficiency index (REI) for the different marketing systems for liquid milk was derived as follows:
(i) Q*, defined as the "absolute quality index" by means of which the fresh liquid milk bought from a particular marketing system is "adjusted" to a standard quality, was calculated as:Q* = (BF × SNF)
Where
BF = average percentage butterfat content of the liquid milk from the particular marketing system;
SNF = average percentage solids-non-fat content of the same liquid milk;(ii) PEI, the "quality adjusted" least cost efficiency index for the particular marketing system was calculated as:
PEI = P*/Q*
Where
P* = average price of milk sold through the particular marketing system;(iii) The system which scored the lowest PEI value (in step (ii) above) was judged to be the most least-cost efficient system, and the relative efficiency index (REI) for each of the other marketing systems was obtained by dividing the PEI of the most least-cost efficient system with the EI of each of the other marketing systems, i.e.:
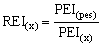
Where:
REI (x) = relative efficiency index for the system x;
PEI (pes) = uality adjusted least-cost efficiency index for the system which isjudged to be the most price efficient;
PEI (x) = quality adjusted least-cost efficiency index for the system x.
The average milk quality indicators, i.e. the butterfat (BF) and solids-non-fat (SNF) contents, for the milk samples which were procured from the different marketing systems for fresh liquid milk in Addis Ababa are presented in Table 2.
Table 2: Average milk solids by source
|
Marketing systems |
Average Percentage Content |
|||
|
BF |
SNF |
Total solids (TS) |
||
|
S1 (DPR) |
S11 |
3.67 |
8.26 |
11.93 |
|
S12 |
3.65 |
7.98 |
11.63 |
|
|
S13 |
4.90 |
9.12 |
14.02 |
|
|
S2 (KEB) |
2.46 |
8.24 |
10.70 |
|
|
S3 (ITR) |
3.75 |
7.90 |
11.65 |
|
|
S4 (KIO) |
2.48 |
7.96 |
10.44 |
|
|
S5 (GRO) |
2.50 |
8.31 |
10.81 |
|
SOURCE: Survey data: authors' work, 1984/85.
The results of milk quality analysis indicated substantial variations of both the BF (butterfat content) and the TS (total milk solids content) by marketing systems (but not by locations) from which the households purchase their milk. The variation of the BF by systems was found to be highly significant (at the 1% significance level, deduced from an F-statistic of 4.53 with (8;131) degrees of freedom). The variation in total milk solids content, however, was significant only at the 7% level (judging from an F-statistic of 1.90 with (8;131) degrees of freedom). The variation of the solids-non-fat content was found not to be statistically significant (deduced from an F-statistic of 0.45 at the (8;131) degrees of freedom), a result which implies that the milk samples from the different systems primarily differ, in terms of quality, in their butterfat contents.
Average retail prices of milk, before adjustment for quality differences, in Addis Ababa were found to vary between different marketing systems from a common low of 76 Ethiopian cents per litre for the system S2 (the system which involves direct sales of milk to consumers by Kebele shops or any other DDE-designated sales outlets) to a high of 100 Ethiopian cents per litre for the system S5 (the system which involves direct sales of milk to consumers by grocery stores and supermarkets). The summary of the P* (average unadjusted retail milk prices) as well as the calculated values of Q* (the absolute quality index for milk) and the P*/Q* ratio (quotient) by system is given in Table 3. The last column of Table 3 also presents the results of the calculation of the REI, the relative efficiency index for each marketing system.
Table 3: Milk prices, quality and least-cost efficiency in alternative milk marketing systems in Addis Ababa, Ethiopia
|
Average by different system |
|||||
|
System of Marketing |
P* = Unadjusted Price in Eth. cents per litre |
Q* = Quality index |
PEI = Efficiency index = P*/Q* index |
REI = Relative efficiency |
|
|
S1 (DPR) |
S11 |
90 |
30.31 |
2.97 |
0.54 |
|
S12 |
88 |
29.13 |
3.02 |
0.53 |
|
|
S13 |
71 |
44.69 |
1.59 |
1.00 |
|
|
S2 (KEB) |
76 |
20.27 |
3.75 |
0.42 |
|
|
S3 (ITR) |
90 |
26.93 |
3.04 |
0.52 |
|
|
S4 (KIO) |
87 |
19.74 |
4.41 |
0.36 |
|
|
S5 (GRO) |
100 |
20.78 |
4.81 |
0.31 |
|
SOURCE: Subsequent survey data: authors' work, 1984/85.
An examination of the indices of least-cost efficiency (PEI) of the different marketing system for liquid milk presented in Table 3 shows that the marketing subsystem S13 (direct sales to consuming households by producers whose cows are kept outside Addis Ababa) provides milk of the highest absolute quality value per litre in the City of Addis Ababa. Subsystem S13 is thus judged to be the most least cost-efficient milk delivery system, and the relative efficiency of each of the other milk marketing system is deduced from the efficiency of the S13 by dividing the PEI of the S13 with the PEI of each individual system. The results of such calculations are shown in the last column of Table 3. The results indicate that the particular (S13) subsystem which provided the cheapest milk in terms of the unadjusted price per litre also provided the cheapest milk in terms of the "quality adjusted" least cost efficiency index, the PEI. However, this relationship does not apply for the milk provided by the other systems, i.e. the ranking of the systems on the basis of price levels does not always correspond to the ranking of the systems on the basis of what has been defined as quality adjusted least-cost efficiency index in this report.
The above indices of relative efficiency are derived from a "least-cost" efficiency criterion. These indices suggest that the marketing systems which entail direct sales of fresh liquid milk to the Addis Ababa consumers by intra-urban and pert-urban producers of milk (i.e. the subsystems S11, S12 and S13, which are grouped into S1) are relatively more efficient than the other systems in terms of a least-cost efficiency criterion. The next most efficient system is S3, the marketing system which entails direct sales of fresh liquid milk to the consuming households by the itinerant traders who sell milk produced by other people. The systems which entail direct sales of fresh liquid milk from either the grocery stores, supermarkets, small private shops or kiosks appear to be the least efficient by this criterion. The level of the average prices charged to different income groups for milk flowing through alternative systems was also investigated. The variation of the average prices of milk between sources and between income classes was found to be highly significant in the inner (ICZ) and middle (MCZ) zones of the city, with the F-statistic values of 5.16 at (8;164) degrees of freedom for the MCZ and 5.75 at (10;83) degrees of freedom for the ICZ. However, this variation was not significant in the peripheral (PCZ) zone of the city (F-value of 0.54 at (6;115) degrees of freedom). Table 4 presents the average prices of milk paid by the different income classes for the milk sold through the alternative milk marketing systems in the city of Addis Ababa.
Table 4: Average prices (cents per litre) of fresh liquid milk by marketing systems, income classes and zones in Addis Ababa
|
|
Average prices of fresh liquid milk by zone and income class |
||||||||
|
Inner zone |
Middle zone |
Peripheral zone |
All zones |
||||||
|
Milk marketing systems |
LIG* |
HIG* |
LIG* |
HIG* |
LIG* |
HIG* |
LIG* |
HIG* |
|
|
S1 (DPR) |
S11 |
95 |
91 |
85 |
91 |
86 |
92 |
88 |
91 |
|
S12 |
90 |
87 |
84 |
87 |
86 |
84 |
86 |
86 |
|
|
S13 |
67 |
n/a |
60 |
n/a |
86 |
n/a |
69 |
n/a |
|
|
S2 (KEB) |
76 |
n/a |
73 |
n/a |
83 |
90 |
77 |
90 |
|
|
S3 (ITR) |
82 |
n/a |
90 |
n/a |
80 |
n/a |
85 |
n/a |
|
|
S4 (KIO) |
86 |
n/a |
88 |
85 |
87 |
81 |
87 |
n/a |
|
|
S5 (GRO) |
100 |
n/a |
80 |
n/a |
n/a |
n/a |
87 |
88 |
|
|
All systems |
85 |
89 |
80 |
89 |
85 |
87 |
83 |
88 |
|
|
Sample size |
54 |
41 |
99 |
78 |
58 |
64 |
211 |
183 |
|
LIG* = low income class of households.
HIG* = high income class of households.
n/a = not available, since no relevant respondent in this class.SOURCE: Subsequent survey data: authors' work, 1984/85.
Even though the results presented in Table 4 generally cannot be used to assess if there is a systematic relationship between the prices charged for milk by different marketing systems and the income class of the consumers on a city zone basis, particularly because of the many missing cases the general trend is for the higher income groups of households in Addis Ababa to pay slightly higher prices (by about 6%) for their liquid milk. This may indicate that the poorer consumers are more sensitive to milk price levels. One could thus conjecture that there is some potential to introduce fresh liquid milk of differing qualities and sell it at appropriately determined prices to different classes of consumers in Addis Ababa. Such an introduction would probably cater for the needs of different income classes of consumers. The Indian dairy industry offers a good example of a dairy marketing system which has attempted to cater for the needs of different income classes of consumers by offering the slightly more costly "toned" milk (of about 3.0% butterfat content) to cater primarily for richer consumer groups and the slightly cheaper "double-toned" milk (of about 1.5 % butterfat content) to cater primarily for the poor consumer groups.
The degree of responsiveness of different marketing systems to consumers' demands is another frequently-used partial efficiency criterion. The relative responsiveness of different marketing systems can partly be measured by the range of services they offer to consumers and is partly reflected in the extent to which consumers choose to patronise them with their regular custom.
Different groups of consumers will, in most cases, differ in their views with regard to what they consider a marketing system should offer. The range of services that the alternative marketing systems for liquid milk in Addis Ababa offer to consumers was established by asking the consumers to state why they purchased milk regularly from particular sources and also by asking them to single out the most important reason out of the various reasons that they stated. Table 5 indicates the relative importance of the different reasons in terms of the percentage of the consuming households of different income classes in different city zones who quoted each of the indicated reasons as being the major factor that influences their choice of the types of sources from which to purchase milk. The differences (in reasons indicated) between income groups within a particular city zone were not found to be statistically significant.
Table 5 also gives an indication of the relative importance of the different reasons that were cited by households for usually purchasing milk from particular systems on the basis of the zone of the city in which the households are located, and for Addis Ababa as a whole. Some of the factors quoted by the households as being the main reasons for their choice of particular types of systems when purchasing milk are easily quantifiable. Such factors constitute a number of partial efficiency criteria and can be used to construct indices which evaluate alternative marketing systems particularly in respect of their responsiveness to consumer demands as represented by these factors. Unfortunately, it is not possible to quantify the factor "convenience when collecting" - which was by far the single most frequent factor cited by households as being the main reason for the choice of a particular marketing system. Therefore, it has not been possible to treat this factor as a "partial efficiency criterion" in the same way as the others in the subsequent evaluation.
Table 5: Major reasons for choice of marketing system of milk, by zone and household income class in Addis Ababa
|
Main reason for choice of system of marketing of fresh liquid milk |
% of households quoting indicted reason by city zone and income class |
|||||||
|
Inner zone |
Middle zone |
Peripheral zone |
All zones |
|||||
|
Low |
High |
Low |
High |
Low |
High |
Low |
High |
|
|
(i) Convenience when collecting: |
32.1 |
28.8 |
22.0 |
30.6 |
33.3 |
21.5 |
27.4 |
27.2 |
|
(ii) Availability of milk at source when needed: |
21.4 |
10.2 |
15.3 |
12.0 |
6.7 |
13.9 |
14.5 |
12.2 |
|
(iii) Regularity of milk supply: |
10.7 |
16.9 |
11.9 |
15.7 |
10.0 |
5.1 |
11.1 |
12.6 |
|
(iv) Hygiene and cleanliness: |
14.3 |
11.9 |
20.3 |
22.2 |
36.7 |
27.8 |
23.1 |
21.5 |
|
(v) Good level of prices: |
14.3 |
11.9 |
15.3 |
7.4 |
0.0 |
10.1 |
11.1 |
9.3 |
|
(vi) Level of butterfat content: |
0.0 |
5.1 |
0.0 |
0.9 |
0.0 |
2.5 |
0.0 |
2.8 |
|
(vii) Taste of milk: |
0.0 |
5.1 |
0.0 |
1.9 |
0.0 |
2.5 |
0.0 |
2.8 |
|
(viii) Freshness of milk: |
0.0 |
6.8 |
10.2 |
0.9 |
3.3 |
7.6 |
6.0 |
4.5 |
|
(ix) Home delivery service: |
0.0 |
1.7 |
3.4 |
5.6 |
0.0 |
3.8 |
1.7 |
4.1 |
|
(x) Packaging of milk: |
3.6 |
0.0 |
1.7 |
0.9 |
0.0 |
0.0 |
1.7 |
0.4 |
|
(xi) Other reasons |
3.6 |
1.7 |
0.0 |
1.9 |
10.0 |
1.5 |
3.4 |
2.8 |
|
All reasons |
100.0 |
100.0 |
100.0 |
100.0 |
100.0 |
100.0 |
100.0 |
100.0 |
|
Sample size |
28 |
59 |
59 |
108 |
30 |
79 |
117 |
246 |
SOURCE: Initial survey data: authors' work, 1984/85.
Tables 6, 7 and 8 present a summary of the performance of alternative marketing systems in the inner, middle and peripheral zones of Addis Ababa respectively in terms of selected partial efficiency criteria. These efficiency criteria reflect the systems' responsiveness to consumer demand as expressed by the consumers' preferences in terms of the reasons they gave for allocating their market demand to particular marketing systems, as represented by the particular retail sources from which the consuming households purchased their milk. The selected partial efficiency criteria are price, butterfat content, total solids in milk and degree of unreliability in supply. From the consumers' point of view, price should be as low as possible, while the butterfat content should be high and the degree of unreliability should be low. Consumers did not state "solids-non-fat" as a reason for choice, but it has been included here simply because the data became available as a by-product of the analysis of butterfat content.
On the basis of the levels of the different criteria for evaluating the performance of marketing systems which are presented in Tables 6, 7 and 8, the marketing systems designated as S1 and S3 may be said to be the most efficient in all the three zones of the City of Addis Ababa from the "degree-of-reliability" criterion. The two systems never fail to provide liquid milk when needed by the households. However, from the "least-cost" criterion, the performance of the different marketing systems appears to be relatively variable (as between different zones) but the system designated as S2 may be said to be relatively more efficient by this criterion. This evaluation of the efficiency of alternative marketing systems for liquid milk on the basis of single attributes simply underscores the importance of the fact that the rating of market performance for different marketing systems will vary depending on the criterion used in the assessment of that market performance.
We can look at the same issue from a different angle. The results presented in Tables 6-8 show that the ranking of performance of individual marketing systems differs, within a particular zone, according to the particular partial efficiency criterion being used. In the inner city zone, for example (see Table 6), the S2 system (direct sales by Kebele shops and DDE outlets) has the best performance on price but scores worst on reliability and badly on butterfat content. It would, therefore, be useful to have some way of synthesizing the performance of alternative marketing systems in terms of diverse criteria into a simple measure of efficiency. However, as pointed out earlier, all-embracing optimising procedures, and their attendant efficiency criteria, have a poor record of practicability. Hence it will suffice to draw conclusions based on the partial efficiency criteria.
Table 6: Performance of alternative milk marketing systems in the inner city zone of Addis Ababa in respect of selected partial efficiency criteria
|
Partial efficiency criterion |
Marketing system |
||||
|
S1 |
S2 |
S3 |
S4 |
S5 |
|
|
(DPR) |
(KEB) |
(ITR) |
(KIO) |
(GRO) |
|
|
Mean price (Ethiopian cents per litre) |
87.12 |
75.53 |
82.33 |
85.85 |
100.00c |
|
(9.97) |
(9.25) |
(4.04) |
(6.21) |
(0.00) |
|
|
Mean butterfat (%) |
3.87 |
2.87 |
3.30c |
n/e |
2.50c |
|
(092) |
(0.15) |
(0.00) |
-.- |
(0.00) |
|
|
Mean total solids (%) |
12.36 |
12.69 |
11.30c |
n/e |
10.81c |
|
(1.21) |
(0.75) |
(0.00) |
-.- |
(0.00) |
|
|
Degree of unreliability+ |
0.0 |
1.0 |
0.0 |
0.3 |
0.0 |
n/e system not used or absent in the zone.
c reported only on one occasion by one consumer.
+ Degree of unreliability = the % of purchase occasions when this marketing system was not used because no milk was available.Figures in the parenthesis are standard deviations. A total of 94 observations were made covering all systems.
SOURCE: Authors' work, 1984/85.
Table 7: Performance of alternative milk marketing systems in the middle city zone of Addis Ababa in respect of selected partial efficiency criteria.
|
Partial efficiency criterion |
Marketing system |
||||
|
S1 |
S2 |
S3 |
S4 |
S5 |
|
|
(DPR) |
(KEB) |
(ITR) |
(KIO) |
(GRO) |
|
|
Mean price (Ethiopian cents per litre) |
86.51 |
73.31 |
90.00 |
88.15 |
80.17 |
|
(14.70) |
(7.05) |
(20.00) |
(11.95) |
(25.17) |
|
|
Mean butterfat (%) |
3.47 |
2.32 |
4.20c |
2.20 |
n/e |
|
(1.05) |
(0.59) |
(0.00) |
(0.96) |
-.- |
|
|
Mean total solids (%) |
11.40 |
10.04 |
12.00c |
9.79 |
n/e |
|
(1.71) |
(1.95) |
(0.00) |
(1.40) |
-.- |
|
|
Degree of unreliability+ |
0.0 |
0.8 |
0.0 |
0.8 |
0.2 |
+ Degree of unreliability = the % of purchase occasions when this marketing system was not used because no milk was available.
n/e system not used or absent in the zone.
c reported only on one occasion by one consumer.Figures in the parentheses are standard deviations. (A total of 173 observations were made covering all systems.)
SOURCE: Initial and subsequent surveys data: authors' work, 1984/85.
Table 8: Performance of alternative milk marketing systems in the peripheral city zone of Addis Ababa in respect of selected partial efficiency criteria.
|
Partial efficiency criterion |
Marketing System |
||||
|
S1 |
S2 |
S3 |
S4 |
S5 |
|
|
(DPR) |
(KEB) |
(ITR) |
(KIO) |
(GRO) |
|
|
Mean price (Ethiopian cents per litre) |
87.83 |
83.61 |
80.00 |
86.99 |
n/e |
|
(11.15) |
(22.23) |
(28.28) |
(4.75) |
-.- |
|
|
Mean butterfat (%) |
3.85 |
2.60c |
n/e |
2.77 |
n/e |
|
(1.03) |
(0.00) |
-.- |
(0.23) |
-.- |
|
|
Mean total solids (%) |
12.19 |
11.26c |
n/e |
11.11 |
n/e |
|
(1.49) |
(0.00) |
-.- |
(0.42) |
-.- |
|
|
Degree of unreliability+ |
0.0 |
0.7 |
0.0 |
0.9 |
0.1 |
+ Degree of unreliability = the % of purchase occasions when this marketing system was not used because no milk was available.
n/e system not used or absent in the zone.
c reported only on one occasion by one consumer.Figures in the parentheses are standard deviations. (A total of 122 observations were made covering all systems.)
SOURCE: Initial and subsequent surveys data: authors' work, 1984/85.
The relative efficiency of different marketing systems from the "consumer demand-responsiveness" criterion can also be approached in another direct and simple way. Assume that the consuming households have complete freedom to choose from which marketing system (i.e. source) to purchase milk. Also assume that their pattern of actual choices accurately reflects the extent to which different marketing systems do meet their demands. Call this general criterion the "popularity" criterion. Then it is possible to recognize three sub-criteria within this general "popularity" criterion:
· "popularity" as evidenced by the proportion of households who cite a given marketing system as being their "usual" source;· "popularity" as evidenced by the actually measured "frequency of use" (i.e. number of purchase occasions) of a given marketing system;
· "popularity" as evidenced by the "volume" of milk flowing through a particular marketing system (see Table 1).
Based on the above concepts, popularity rankings were developed on the basis of one of the three sub-criteria. Table 9 presents, for all the three zones of Addis Ababa, the relative rankings of the various marketing systems (as represented by the retail sources) in terms of the "least-cost" ("lowest price") criterion and the "popularity" criterion.
Table 9: Rankings of alternative milk marketing systems in terms of two major criteria in different zones of Addis Ababa.
|
Alternative marketing system |
Inner city zone |
Middle city zone |
Peripheral city zone |
|||
|
Least cost |
Popularity |
Least cost |
Pupularity |
Least cost |
Popularity |
|
|
Ranks |
Ranks |
Ranks |
Ranks |
Ranks |
Ranks |
|
|
S1 (DPR) |
4 |
1 |
3 |
1 |
4 |
1 |
|
S2 (KEB) |
1 |
2 |
1 |
2 |
2 |
3 |
|
S3 (ITR) |
2 |
5 |
5 |
5 |
1 |
4 |
|
S4 (KIO) |
3 |
3 |
4 |
3 |
3 |
2 |
|
S5 (GRO) |
5 |
4 |
2 |
4 |
n/e |
5 |
Least cost ranks derived from Tables 6-8 and popularity ranks from Table 1.
n/e Not estimated due to lack of complete data.SOURCE: Authors' work 1984/85.
In Table 9, the performance of the five milk marketing systems in each zone was directly compared in terms of two main criteria, least cost (lowest price), and popularity as evidenced by the volume of milk flowing through each system. The ranking of the five systems differs substantially according to the main criterion considered, with the ranking given by the "least cost" criterion differing quite significantly from the other. There are differences in ranking on the basis of the same criterion between zones, but these differences are not very marked. In terms of the "popularity" criterion, the S1 system (direct sales form producers to consumers) appears to be the most efficient in Addis Ababa as a whole. The S1 system does not perform well on the basis of the least-cost criterion by which it is always inferior to the S2 (Kebele/DDE outlets) marketing system.
3.3.1 The identification of the butter marketing systems
3.3.2 The relative importance of the alternative butter marketing systems
3.3.3 The relative efficiency of the alternative marketing systems
On the basis of the final retail outlets for butter, eight major alternative butter marketing systems were identified:
i) MER; a system that involves direct purchases of butter from traders in the main city market, the Mercato;ii) OMK; a system that involves purchases of butter from traders in other markets;
iii) GRO; a system that involves purchases from grocery stores and supermarkets;
iv) IAP; a system that involves purchases from producers whose cows are within Addis Ababa;
v) XAP; a system that involves purchases from producers whose cows are outside Addis Ababa;
vi) ITR; a system that involves purchases from itinerant traders;
vii) KEB; a system that involves purchases from Kebele shops and other DDE-designated butter sales outlets;
viii) KIO; a system that involves purchases from small private shops or kiosks and any other sources.
The results from the subsequent survey indicated that sales by grocery stores and supermarkets (GRO) and Kebele shops and other DDE-designated sales outlets (KEB) are important only in the case of the sales of table butter. Since cooking butter is the most important form of butter consumed in Addis Ababa, the rest of this chapter is devoted to the analysis of the marketing systems for cooking butter, and the term "butter" will be used to refer to "cooking butter".
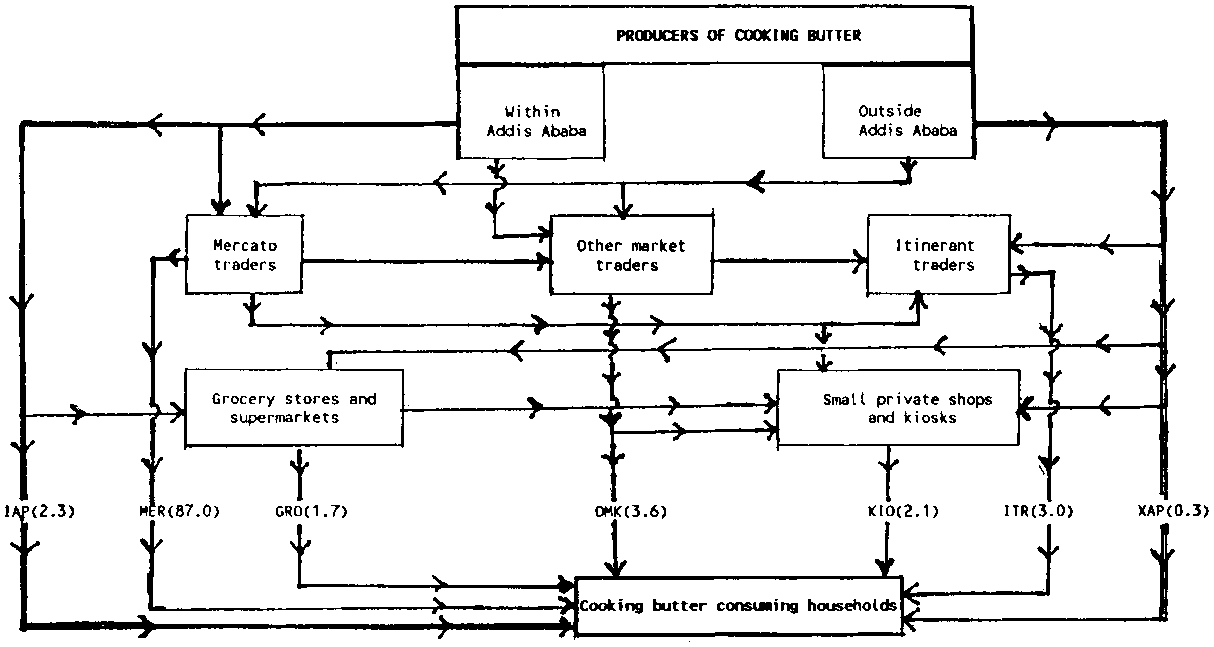
The estimate of the quantities of cooking butter flowing through different marketing chains indicated that the Producer ® Mercato trader ® Consumer chain, i.e. the marketing system MER, is the most important. Figure 2 gives a schematic representation of the different marketing systems for butter in Addis Ababa and illustrates their complexity, together with the estimated quantities of cooking butter flowing through the different systems in terms of the percentage of the total quantity purchased through a particular marketing chain. These estimates are given in brackets next to the marketing systems to which they relate. They are indicators of the relative share of the total market of each marketing system, where the total market is defined only on the basis of the estimated amount of cooking butter purchased by the consuming households in the city on a given day of the week. The marketing system KEB does not appear on Figure 2 as it does not handle cooking butter.
The very large proportion of total cooking butter sales (about 87%) by traders in the Mercato suggests that the marketing of cooking butter in Addis Ababa is highly centralised in space. It makes little sense, therefore, to analyse the variation in the relative importance of the different marketing chains from one zone of the city to another. After MER, the next most important are the systems OMK, i.e. other market sales, and ITR, i.e. sales by itinerant traders. By definition, itinerant traders are butter merchants who hawk their product around, seeking out customers usually in the residential areas, i.e. they do not operate at any particular markets or business premises. Direct sales of cooking butter by producers whose cows are outside Addis Ababa (i.e. sales through the system XAP) are almost negligible. Table 10 gives a breakdown of the total quantities of cooking butter procured by the sample households through the different marketing systems in a week. The quantities of purchased cooking butter shown in Table 10 are the ones used as the basis for the estimation of the relative market shares of the different marketing systems for cooking butter, which are given in brackets in Figure 2.
It should be remembered, however, that the sample on which Figure 2 was based was a stratified one, selected by procedures primarily aimed at obtaining a sample that was representative of the purchasers of milk. The sample obtained in this way may thus not be very representative of purchasers of butter, but it may be taken as being indicative of the general purchases pattern for butter.
An analysis of income groups among the households buying butter in Addis Ababa indicated that the majority of them were in the high income class; only 24.0% were from the low income group, and of these the majority of them were from the middle and peripheral zones of the city, accounting for 18.9% of the purchases. Table 10 shows the proportion of cooking butter purchased by the sample households of different income classes.
Table 10: Quantity of cooking butter purchased by sample households in Addis Ababa during one week by source and share by income class
|
Butter marketing system |
Total amount of butter purchased by households(kg)* |
% purchased by |
|
|
Low income group |
High income group |
||
|
MER |
210.5 |
18.6 |
81.4 |
|
OMK |
8.7 |
51.7 |
48.3 |
|
GRO |
4.2 |
- |
100.0 |
|
IAP |
5.5 |
54.5 |
45.5 |
|
XAP |
0.8 |
100.0 |
- |
|
ITR |
7.3 |
13.7 |
86.3 |
|
KIO |
5.0 |
- |
100.0 |
|
Total |
242.0 |
19.3 |
80.7 |
* 115 households out of the total sample of 482 households interviewed purchased cooking butter at least once in the week prior to the interview in the subsequent survey.SOURCE: Subsequent survey data: authors' work, 1984/85.
As in the case of milk, the butter consumers were also asked to give the reasons which caused them Usually to buy butter from particular sources. Their answers to this question were assumed to reveal those consumer preferences felt strongly enough to influence their market demand, and which could then be quantified to establish partial efficiency criteria so that relative performance could be evaluated. As will be seen, far fewer quantifiable indices of performance were available for butter than for milk.
A comparison of the relative frequency with which the different reasons influencing the choice of the usual louder sources were cited indicated that reliability and regularity of supply were the most important factors. Table 11 shows the main factors influencing the choice of source. The importance of the availability of the product when needed, the regularity of supply, and convenience, primarily in terms of the accessibility of the source, may be seen clearly, and this relationship is true in all city zones. It should be noted, however, that not all of these households had actually purchased any butter at least once during the week prior to the interview during the subsequent survey. This is because butter is often purchased in large consignments which last much longer than a week.
Table 11: Major reasons influencing the choice of usual source of butter by households in different zones of Addis Ababa
|
Main reason for choice of usual retail butter outlet |
% of replies by zone |
||
|
ICZ |
MCZ |
PCZ |
|
|
(i) Reasonable price level |
3.0 |
4.8 |
5.2 |
|
(ii) Hygiene and cleanliness |
8.0 |
18.5 |
16.4 |
|
(iii) Taste of butter |
6.0 |
0.5 |
0.7 |
|
(iv) Freshness of butter |
2.0 |
4.8 |
4.5 |
|
(v) Regularity of supply |
27.0 |
23.3 |
17.9 |
|
(vi) Convenience (accessibility) |
19.0 |
13.2 |
9.0 |
|
(vii) Only source having the product when household needs some |
30.0 |
24.9 |
34.9 |
|
(viii) Any other reason |
5.0 |
10.1 |
11.9 |
|
Zonal sample size (n) |
100.0 |
100.0 |
100.0 |
SOURCE: Initial survey data: authors' work, 1984/85.
A check during the subsequent survey of whether the households had purchased any butter from their "usual source" as established from the initial enquiry indicated that all low income households had done so, and so had all the high income households in both the inner and the peripheral zones of the city, but that the Figure was only 90% for the high income households in the middle zone. The main reasons for the change of source was related to convenience and availability. Some households claimed that their "usual sources" had not had any butter, while others stated that butter had been bought elsewhere by household members whilst out on business. In view of the smallness of the sample of households who had purchased butter at least once during the week prior to the interview, and because only a small proportion of these in the middle zone of the city had bought some butter at sources other than their "usual source", it was not considered worthwhile to compare the efficiency of the different marketing systems on the basis of their degree of reliability. Comparative analysis will thus focus on the price levels associated with different marketing systems for consumers of different income groups and on the extent to which such systems meet other consumer priorities.
Other things being equal, consumers normally prefer to purchase from those marketing systems that offer the same quality of butter at the lowest price. Low income group paid 11.72 birr per kg as against 11.19 birr paid by high income group. Table 12 shows the mean consumer prices of cooking butter paid by consumers of different income classes and different zones.
The analysis of variance (ANOVA) tests for the statistical significance of the variation of the prices paid by different classes of consumers for cooking butter sold through different marketing systems indicated that:
i) the variation was not statistically significant between zones for the low income consumers (the F-statistic obtained was 0.67 with (1;6) degrees of freedom);ii) the variation was statistically significant at the 1% level for the differences in prices between zones for the high income class of consumers (the F-statistic obtained was 6.69 with (1;9) degrees of freedom).
The usefulness of ANOVA-tests depends upon the sample size; thus the smallness of the sample of low income consumers (n = 33) as opposed to the size of the sample of high income consumers (n = 77) suggests that the result of the F-statistic for the low income consumers should be interpreted cautiously.
The many blanks in Table 12 (indicated by n/e) generally reflect the fact that there are few alternative or competitive marketing systems through which cooking butter is distributed in most zones of the city. The preponderance of system MER in all zones was demonstrated by the relative shares of the different marketing systems shown in Figure 2, and by the data given in Table 10. There are some options, however, particularly in the middle and peripheral zones of the city and the frequency of use of a few systems in particular zones by consumers of different income classes appears to be related to the services or the attributes which they associate with the different marketing systems. The systems OMK (direct sales of cooking butter by traders at other markets) and IAP (direct sales of cooking butter by intra-urban producers) are shown to be the next most used systems, but their market shares are small.
Table 12: Average prices of cooking butter sold through different marketing systems by household income group and zone of Addis Ababa
|
Butter marketing system |
Average price (birr per kg) by zone and income class |
|||||
|
ICZ |
MCZ |
PCZ |
||||
|
LIG |
HIG |
LIG |
HIG |
LIG |
HIG |
|
|
MER |
12.00 |
11.61 |
11.25 |
11.90 |
11.59 |
11.73 |
|
OMK |
n/e |
n/e |
12.00 |
11.17 |
11.50 |
13.33 |
|
GRO |
n/e |
n/e |
n/e |
12.50 |
n/e |
n/e |
|
IAP |
n/e |
10.00 |
12.00 |
12.00 |
12.00 |
12.00 |
|
XAP |
n/e |
n/e |
n/e |
n/e |
11.33 |
n/e |
|
ITR |
n/e |
n/e |
11.00 |
12.00 |
n/e |
10.00 |
|
KEB |
n/e |
n/e |
n/e |
n/e |
n/e |
n/e |
|
KIO |
n/e |
n/e |
n/e |
11.00 |
n/e |
10.00 |
|
All systems |
12.00 |
10.81 |
11.56 |
11.76 |
11.61 |
11.01 |
|
Sample size (n) |
1 |
19 |
20 |
37 |
12 |
21 |
SOURCE: Authors' work, 1984/85.
SOURCE: Subsequent survey data. For KEY see para 5.1.1
A thorough and objective comparison of the price levels for the different marketing systems for cooking butter across and even within the city zones is difficult. In quite a number of cases, the mean prices presented in Table 12 are based on only a few observations (see the sizes of the samples of income class strata). Hence only very general or tentative conclusions can be drawn about the relative efficiency of the different marketing systems for butter on the basis of the least-cost (lowest mean price) criterion.
Regardless of the statistical significance (or nonsignificance) of differences in mean consumer prices, the minor variations in price between different marketing systems for consumers of the same income class and zone may still be important to the consumer, even though few of them rank it as an important criterion for choice of source. It is valid, therefore, to rank marketing systems on the basis of the differences in the mean consumer prices for the products which they deliver as a basis for efficiency comparison.
Assuming that cooking butter is a homogeneous product of the same quality, then the relative efficiency of the systems can be evaluated from the ranking of the different marketing systems on the basis of the mean price level for each system. The relative ranking of the systems serving the low income consumers is shown in Table 13.
Since the ranks given in Table 13 are in declining order of merit, the solitary number 1 of MER in the inner city zone simply reflects lack of options or the choice by low-income consumers not to use any other sources in this zone. In the middle city zone, the system ITR (cooking butter sales by itinerant traders) is the best of the four systems actually used by low income consumers, from the least-cost criterion, while in the peripheral zone it is the GRO system (cooking butter sales by grocery stores and supermarkets). No one system is dominant in all zones by this criterion.
Table 13: Least-cost performance of the alternative butter marketing systems used by low income households in Addis Ababa.
|
Alternative marketing system |
Ranking in different city zones |
||
|
ICZ |
MCZ |
PCZ |
|
|
MER |
1 |
2 |
3 |
|
OMK |
n/e |
3= |
2 |
|
IAR |
n/e |
3= |
4 |
|
XAP |
n/e |
n/e |
1 |
|
ITR |
n/e |
1 |
n/e |
Note: n/e implies that the system is not used by this class of consumers in the given zone.
SOURCE: Ranks derived (in declining order of merit) from Table 12.
Table 14 shows the ranking, on the basis of the least-cost criterion, of the systems serving the high income consumers in the different zones of the city.
Table 14: Least-cost performance of the alternative butter marketing systems used by high income households in Addis Ababa.
|
Alternative marketing system |
Ranking in different city zones |
||
|
ICZ |
MCZ |
PCZ |
|
|
MER |
2 |
3 |
3 |
|
OMK |
n/e |
2 |
5 |
|
GRO |
n/e |
6 |
n/a* |
|
IAP |
1 |
4= |
4 |
|
XAP |
n/e |
n/e |
n/e |
|
ITR |
n/e |
4= |
1= |
|
KEB |
n/e |
n/e |
n/e |
|
KIO |
n/e |
1 |
1= |
Notes:
(1) n/e implies that the system is not used in the particular zone by the given class.
(2) n/a* implies that the system is used but the price was not obtained.SOURCE: Rank derived (in the declining order of merit) from Table 12.
The results given in Table 14 indicate that only two marketing systems are used by high income consumers in the inner city zone, and of these systems, IAP (sales by intra-urban producers) is preferable, by the least-cost criterion, to the MER system (sales by traders at Mercato). High income consumers in the middle city zone, and also in the peripheral zone, patronise a large number of marketing systems. In the middle city zone, the KIO system (sales primarily by small private shops and kiosks) is best; in the peripheral zone, KIO and ITR (itinerant traders) are preferable to the other three systems used.
A comparison of the relative efficiency of the different marketing systems is obviously difficult because some systems are not in use in different zones by the same class of consumers. For instance, only the MER system is in use by low-income consumers and MER and IAR by the high-income consumers in all the three zones of the city. No general pattern of system preference across the zones on the basis of their mean price levels comes out of the analysis. It appears that different types of marketing systems are suitable for different sets of circumstances, such as income group and location of household in relation to outlet points. Since the Mercato outlets are dominant in terms of market share (see Figure 2 and Table 10), the relative ranking of the other systems is not important, since they handle only small amounts of butter.
The level of consumer prices associated with sales volume is only one of the general performance criteria. Price differences may arise purely because there are some differences in the services offered to consumers. Hence the overall evaluation of relative market efficiency should include the services element.
Such an evaluation can be made on the assumption that services rendered arise in response to consumer demand and that consumers are free to allocate their custom to whichever marketing system best serves their demands (i.e. those needs for which they are prepared to pay). Thus, the pattern of the actual choices may reflect the responsiveness of the marketing systems to those needs. A popularity criterion can, therefore, be established and an index drawn up using the data shown in Table 15.
The results presented in Table 15 generally indicate that the system MER, i.e. Mercato sales, is dominant as the most popular source in all zones and classes, followed by OMK, i.e. other market sales. Table 16 gives a comparative performance evaluation based on least cost (LC) and popularity (POP) criteria.
Table 15: Relative consumer share of alternative butter marketing systems by zone and income class in Addis Ababa (a popularity index)
|
Zone and income classes |
% of households using indicated system |
||||||||||
|
|
MER |
OMK |
GRO |
IAP |
XAP |
ITR |
KEB |
KIO |
Total |
Sample size n* |
|
|
Inner city |
LIG |
100.0 |
n/e |
n/e |
n/e |
n/e |
n/e |
n/e |
n/e |
100.0 |
3 |
|
HIG |
70.6 |
n/e |
23.5 |
n/e |
n/e |
n/e |
n/e |
5.9 |
100.0 |
17 |
|
|
Middle city zone |
LIG |
40.0 |
40.0 |
n/e |
n/e |
n/e |
n/e |
n/e |
20.0 |
100.0 |
27 |
|
HIG |
63.3 |
16.7 |
13.3 |
n/e |
n/e |
n/e |
n/e |
3.3 |
100.0 |
30 |
|
|
Peripheral city zone |
LIG |
71.4 |
28.6 |
n/e |
n/e |
n/e |
n/e |
n/e |
n/e |
100.0 |
7 |
|
HIG |
76.5 |
17.6 |
n/e |
n/e |
n/e |
n/e |
n/e |
5.9 |
100.0 |
17 |
|
Note:(i) n* = Number of households who had bought butter in the previous week. Note that this able is derived from the initial survey; and the n* of this Table can, therefore, be different from the n* of Table 12, which is based on the subsequent survey. Total sample interviewed was 482, of whom LIG were 151.
(ii) n/e implies that the system is not frequently used in the particular zone by the particular class of consumers.
(iii) The different marketing systems are as defined in paragraph 5.1.1.
SOURCE: Initial survey data Authors' work 1984/85.
Table 16: Ranking comparisons for the butter marketing systems in Addis Ababa according to least-cost and popularity criteria.
|
Alternative marketing system |
RANK BY CRITERION, ZONE AND INCOME CLASS |
|||||||||||
|
ICZ |
MCZ |
PCZ |
||||||||||
| LIG |
HIG |
LIG |
HIG |
LIG |
HIG |
|||||||
|
LC |
POP |
LC |
POP |
LC |
POP |
LC |
POP |
LC |
POP |
LC |
POP |
|
|
MER |
1 |
1 |
2 |
1 |
2 |
1 |
3 |
1 |
3 |
1 |
3 |
1 |
|
OMK |
n/e |
n/e |
n/e |
n/e |
3 |
1 |
2 |
2 |
2 |
2 |
25 |
2 |
|
GRO |
n/e |
n/e |
n/e |
2 |
n/e |
n/e |
6 |
3 |
n/e |
n/e |
n/e |
n/e |
|
IAP |
n/e |
n/e |
1 |
n/e |
3 |
n/e |
4 |
n/e |
4 |
n/e |
4 |
n/e |
|
XAP |
n/e |
n/e |
n/e |
n/e |
n/e |
n/e |
4 |
1 |
n/e |
n/e |
n/e |
n/e |
|
ITR |
n/e |
n/e |
n/e |
n/e |
1 |
n/e |
4 |
n/e |
n/e |
n/e |
1 |
n/e |
|
KEB |
n/e |
n/e |
n/e |
n/e |
n/e |
n/e |
n/e |
n/e |
n/e |
n/e |
n/ |
n/e |
|
KIO |
n/e |
n/e |
n/e |
3 |
n/e |
3 |
1 |
4 |
n/e |
n/e |
1 |
3 |
Note: The numbers in each column indicate the particular marketing system's rank-order in terms of the specified criterion, income class and zone.n/e implies that the system is not used in the particular zone by the given class.
LIG Low income group.
HIG High income group.
LC Least-cost (Lowest mean price) criterion.
POP Popularity criterion, i.e. relative share in terms of % of customers usually using this sourceSOURCE: Tables 12-15 data: Authors' work, 1984/85.
Table 16 results indicate that the performance of a particular marketing system will depend on the type of criterion used in its evaluation. The rankings of the alternative marketing systems for cooking butter in terms of the two partial efficiency criteria, namely the least-cost (lowest mean price) criterion, for which the evidence was presented in Tables 12-14 and the popularity criterion whose evidence is presented in Table 15, confirm that even though the MER (Mercato Traders) is universally the most popular system, it is usually not, however, the cheapest. Nevertheless, there is very little consistent pattern in cheapness, and it is not surprising that cheapness does not coincide with popularity. Amongst the main reasons cited for using one source rather than another, as shown in Table 11, price considerations occupy a very modest position, with consumers paying far more attention to issues of regularity of supply, convenience (accessibility) and availability. This lack of concern about price needs to be considered in the context of the rather narrow spread of prices revealed by the survey. Had the spread of prices been wider, it is probable that consumers would have been more interested in the price criterion relative to others. The fact that butter can be purchased and stored for a considerable period means that it can be purchased in bulk. Consumers are not reluctant to go occasionally to the Mercato for supplies, and a substantial part of Mercato's comparative advantage probably lies in the fact that consumers can go from trader to trader there, checking on quality and price, with confidence that they will always find as much as they need. This is not the case with the alternative sources.