![]()
![]()
![]()
The greatest threat to life on land is the danger of dehydration (Schmidt-Nielsen, 1975). Most livestock have to drink at least every other day to be productive, and every few days to survive. The provision of water is therefore of prime importance in all animal production systems.
The overall water cost of animal production is rarely calculated, but a rough estimate can be made using a number of assumptions. For example, the mean body water turnover of a Boran steer (Large East African Zebu) was found to be 140 ml.l-1.d-1, and its water pool between 65 and 70% (King, 1979). If such an animal is marketed at 4 years, weighing 400 kg, then its total water use would be in the region of 28 t. If one also takes into account the water required to grow the forage eaten by the herbivore, which is between 150 and 250 l. kg-1 DM of grass, then this figure would increase considerably. McMillan (1965) estimated that the total amount of water required to produce 1 kg of steak was 110 t, and to produce 1 kg of wool was 1000 t. Such information may seem more appropriate to the Guinness Book of Records, but it does serve to emphasise a recurrent theme throughout this and the other research reports in this series on water and livestock. The theme is that one cannot look at animal water use in isolation from the general metabolism of the animal, or water development to the exclusion of the overall production system for which it is required. The ramifications of research on water and livestock are numerous, and it is difficult to know where to draw the line.
The problems of providing water for livestock vary with different species and breeds of livestock, and the ecological zones in which they occur. It is therefore important to establish the relative importance of different animals and their distribution across the continent.
The area of interest to ILCA is sub-Saharan Africa, whose southern limit is the border of the Republic of South Africa. The distribution of livestock by country within sub-Saharan Africa is given in Table 1. The exact numbers vary between authors; for example, Watson et al (1977) give higher figures for the Sudan than those in the table. Nevertheless, by relying mainly on one authority, FAO (1977), it is hoped that the bias will be in the same direction, namely an underestimate. There are also a number of omissions in the table, but the species on which no information is given are probably unimportant in the countries concerned. The final two columns of Table 1 express the biomass of livestock by country on a metabolic weight basis, so that the relative importance of national herds made up of different mixes of species can be compared as a percentage of the total livestock biomass in sub-Saharan Africa. It can be seen that 4 of the 38 countries account for more than half the livestock biomass, namely Ethiopia 21 %, Sudan 13%, Nigeria 9%, and Tanzania 8%. The addition of a further 3, Madagascar, Kenya and Somalia with 5% each, accounts for two thirds of the livestock biomass. On a regional basis, eastern Africa and the Horn contain 55%, francophone and West Africa 30%, central and southern Africa 10%, and Madagascar 5% of the total livestock biomass.
The use of metabolic weight for comparing the nutritional demands of livestock has its drawbacks. For example, desert animals have lower metabolic rates than animals from temperate regions (Schmidt-Nielsen, 1972) even if they are smaller in size, as is the Bedouin goat compared with the Negev mountain goat (Shkolnik et al, 1972). Also, dwarf West African livestock may have lower maintenance requirements than predicted from the exponent of 0.75, because they may reduce their endogenous heat production in response to a hot, humid environment. Nevertheless, metabolic weight seems more appropriate than a 'numbers' approach which overemphasises the importance of smallstock, or the conversion of numbers to livestock units (LUs). The problem with LUs is that there is a twofold difference in size between breeds of the same species in different regions of the continent; thus different countries use LUs of different weights. Dahl and Hjort (1976) list eight different units, with ratios of smallstock to cattle which vary from 2:1 to 12:1.
Table 1. Livestock numbers and biomass per country in sub-Saharan Africa, 1976.
|
Country |
Livestock numbers ('000 head) |
Biomass |
||||||||
|
Donkeys |
Horses |
Mules |
Camels |
Cattle |
Goats |
Pigs |
Sheep |
Million kg0.75 |
% of total |
|
|
Angola |
5 |
1 |
0 |
0 |
3000 |
910 |
360 |
205 |
155 |
1.7 |
|
Benin |
1 |
6 |
0 |
0 |
800 |
840 |
365 |
850 |
59 |
0.6 |
|
Botswana |
40 |
9 |
2 |
? |
2200 |
1050 |
19 |
425 |
118 |
1.3 |
|
Burundi |
0 |
0 |
0 |
0 |
800 |
653 |
32 |
311 |
46 |
0.5 |
|
Cameroon |
64 |
59 |
? |
0 |
2655 |
1633 |
412 |
2105 |
170 |
1.8 |
|
Central Afr. Rep. |
1 |
0 |
0 |
0 |
610 |
566 |
62 |
76 |
35 |
0.4 |
|
Chad |
300 |
145 |
? |
310 |
3658 |
2424 |
6 |
2424 |
258 |
2.8 |
|
Congo |
0 |
0 |
0 |
0 |
50 |
101 |
44 |
52 |
4 |
0.0 |
|
Djibouti |
3 |
0 |
0 |
25 |
18 |
580 |
? |
98 |
9 |
0.1 |
|
Equatorial Guinea |
? |
? |
? |
0 |
4 |
7 |
8 |
31 |
1 |
0.0 |
|
Ethiopia |
3860 |
1510 |
1420 |
960 |
25963 |
17064 |
17 |
23065 |
1958 |
21.1 |
|
Gabon |
0 |
0 |
0 |
0 |
5 |
64 |
5 |
59 |
1 |
0.0 |
|
Gambia |
4 |
0 |
0 |
0 |
310 |
94 |
8 |
95 |
16 |
0.2 |
|
Ghana |
25 |
4 |
0 |
0 |
1100 |
2000 |
400 |
1800 |
94 |
1.0 |
|
Guinea |
3 |
1 |
0 |
0 |
1550 |
385 |
35 |
420 |
80 |
0.9 |
|
Guinea Bissau |
3 |
0 |
0 |
0 |
258 |
180 |
176 |
70 |
17 |
0.2 |
|
Ivory Coast |
1 |
1 |
0 |
0 |
600 |
1000 |
210 |
1000 |
50 |
0.5 |
|
Kenya |
150 |
2 |
0 |
564 |
7500 |
4100 |
67 |
3611 |
461 |
5.0 |
|
Liberia |
0 |
0 |
0 |
0 |
35 |
175 |
93 |
176 |
6 |
0.1 |
|
Madagascar |
1 |
2 |
0 |
0 |
9842 |
1300 |
680 |
700 |
483 |
5.2 |
|
Malawi |
? |
? |
0 |
0 |
700 |
739 |
189 |
88 |
43 |
0.5 |
|
Mali |
400 |
150 |
? |
178 |
4080 |
3929 |
25 |
4219 |
303 |
3.3 |
|
Mozambique |
20 |
? |
? |
0 |
1420 |
570 |
183 |
132 |
76 |
0.8 |
|
Namibia |
63 |
42 |
5 |
? |
2850 |
2000 |
33 |
5000 |
201 |
2.2 |
|
Niger |
350 |
200 |
? |
260 |
2760 |
5100 |
27 |
2300 |
243 |
2.6 |
|
Nigeria |
700 |
250 |
? |
17 |
11300 |
23000 |
900 |
7900 |
871 |
9.3 |
|
Rwanda |
? |
0 |
0 |
0 |
717 |
570 |
75 |
252 |
42 |
0.5 |
|
Senegal |
196 |
226 |
? |
25 |
2380 |
873 |
160 |
1689 |
162 |
1.8 |
|
Sierra Leone |
0 |
0 |
0 |
0 |
305 |
179 |
36 |
68 |
17 |
0.2 |
|
Somalia |
22 |
1 |
21 |
2000 |
2600 |
8000 |
8 |
7000 |
413 |
4.5 |
|
Sudan |
672 |
20 |
1 |
2827 |
15395 |
10105 |
7 |
15262 |
1186 |
12.7 |
|
Tanzania |
162 |
? |
0 |
0 |
14362 |
4602 |
24 |
2900 |
738 |
8.0 |
|
Togo |
2 |
3 |
0 |
0 |
235 |
630 |
270 |
750 |
28 |
0.3 |
|
Uganda |
16 |
0 |
0 |
? |
4900 |
2150 |
190 |
1100 |
260 |
2.8 |
|
Upper Volta |
180 |
100 |
? |
5 |
1900 |
2300 |
150 |
1300 |
137 |
1.5 |
|
Zaire |
0 |
1 |
0 |
0 |
1144 |
2256 |
627 |
711 |
91 |
1.0 |
|
Zambia |
1 |
0 |
0 |
0 |
2300 |
283 |
36 |
50 |
110 |
1.2 |
|
Zimbabwe |
93 |
10 |
1 |
0 |
6100 |
2050 |
200 |
770 |
315 |
3.4 |
Source: Numbers derived from FAO (1977), and zeros from ILCA (unpublished observations).
There is a strong correlation between metabolic rate and body water turnover; a lower metabolism uses less water for the transfer of nutrients and for evaporative cooling because it generates less heat. Thus the metabolic rate and water turnover are higher in young and highly productive animals, and lower in older and less productive animals (Macfarlane et al, 1966a). The rate at which mammals use water is slightly faster than the rate at which they use energy because water is used in cooling as well as metabolism. Water turnover is best expressed in relation to the size of the body water pool rather than the bodyweight, since the body contains varying amounts of fat and bone. In desert ruminants, turnover has been found to vary with the size of the body water pool to the power of 0.82 (Macfarlane and Howard, 1972). There is more scope for divergence from the mean exponent for water turnover than for metabolism, because water conservation and non-evaporative mechanisms for heat dissipation are much more highly developed in some species than in others.
Nevertheless, an approximate idea of the relative demands of the different species of livestock in sub-Saharan Africa for forage and water may be obtained from their metabolic biomass and the exponent relating body water turnover to pool size (Table 2). The foregoing calculations indicate that of the available forage and water resources cattle take nearly 70%, sheep and goats 10% each, camels and equines 5% each, and pigs 1%. Cattle are thus seven times as important as any other species on a continental basis, and the zebu is therefore the main focus of this report.
Table 2. Relative demand for water and forage of different species of livestock in sub-Saharan Africa.
|
|
Metabolic biomass (kg0.75) |
Functional biopoola (l0.82) |
||||
|
Species |
Number (×106) |
Mean weight (kg) |
(×106) |
(% of total) |
(×106) |
(% of total) |
|
Donkeys |
7.2 |
125 |
269 |
2.9 |
281 |
2.9 |
|
Horses |
2.7 |
250 |
172 |
1.8 |
189 |
1.9 |
|
Mules |
1.5 |
188 |
74 |
0.8 |
79 |
0.8 |
|
Camels |
7.2 |
312 |
533 |
5.7 |
594 |
6.1 |
|
Cattle |
136.4 |
165 |
6 280 |
66.7 |
6 701 |
68.5 |
|
Goats |
104.5 |
20 |
988 |
10.5 |
909 |
9.3 |
|
Pigs |
6.2 |
40 |
99 |
1.0 |
96 |
1.0 |
|
Sheep |
89.1 |
25 |
996 |
10.6 |
932 |
9.5 |
|
Total |
354.8 |
|
9 411 |
100.0 |
9 781 |
100.0 |
a Body water pool (1) taken as 70% of liveweight (kg).
Source: Weights from ILCA (1979a); Wilson (1978b), and J.M. King (unpublished).
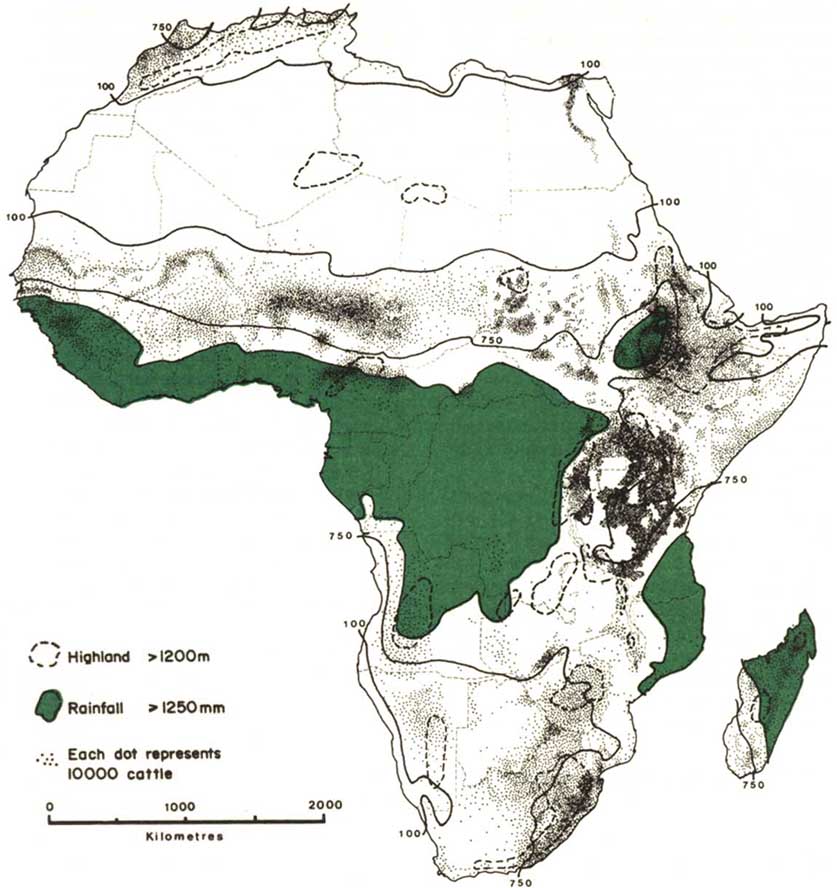
The relation of livestock to the water resources of Africa may be inferred from Figure 1, in which the highland contour (1200 m a.s.l.) and some rainfall isohyets have been superimposed on the distribution of cattle. The distribution of other breeds of livestock in relation to cattle is as follows: camels, donkeys, desert goats and sheep occupy the arid flank, intermediate breeds of smallstock and equines occur with cattle, and pigs and small or dwarf varieties of sheep and goats occupy the humid flank. The isohyets in Figure 1 are those for: 100 mm, which is the limit for cattle distribution except in the presence of irrigation; 750 mm, demarcating the edge of the dry Sahelian zone; and 1250 mm for the humid end of the Sahelo-Sudanian zone. The rainfall in most of Africa does not exceed 1250 mm and, in those regions, values for the Penman estimate of annual potential evaporation vary from about 1200 mm in the highlands to 3100 mm at sea level (Wood-head, 1968). Computation of the index of water available for plant growth in East African rangeland (Woodhead, 1970) indicates a shortage of water for 2 to 9 months of the year depending on the altitude, the amount of precipitation and whether the rains are unimodal or bimodal. Similar relations for rangeland production and rainfall have been produced by Le Houérou and Hoste (1977) for the whole Sahelo-Sudanian zone. The more humid areas of West, central and East Africa are of limited value for livestock production because of the tsetse fly (Ford, 1971). Trypanotolerant cattle do occur in the tsetse belt (ILCA, 1979a) but they represent only about 5% of the cattle population of sub-Saharan Africa.
The number of countries in sub-Saharan Africa in which there is an annual shortage of water and grazing for livestock, and the possibility of a severe drought, is 27 out of a total of 38. Admittedly, 10 of these countries have highland areas in which the majority of the national herd are kept - for example, 80% of the livestock of Ethiopia and Kenya (ILCA, 1977; Chemonics and Hawkins, 1977). Other countries, such as Mali, Sudan and Chad, have extensive river and lake floodplains. Nevertheless, after allowance has been made for the water resources in each country, which are considered in more detail by Classen et al (in press), it is probably true to say that 50% of the livestock of sub-Saharan Africa occur in areas where there is a shortage of water and forage at some time during the year.
There is thus a sizeable livestock population at risk during the dry season, of the order of 175 million head. These animals are not raised under commercial ranching conditions of the kind found in the arid areas of the more industrialized countries, such as Australia or the USA. They are kept to provide the daily subsistence of people living frequently on agriculturally marginal lands, peripheral to centres of power, assistance and investment, and with few options open to them in the face of adverse environmental conditions.
The size of the human population largely dependent on these livestock can be estimated using the following assumptions, based on information provided by the Kenya Maasai and substantiated by Dahl and Hjort (1976): one twelfth of the cattle herd is lactating at any one time; the average daily yield of milk for human consumption is 1.5 l per lactating cow in the wet season; this amount supplies the milk component of the diet of an average member of the household, which is about two thirds of a person's dietary calorific intake. Even if only half the number of cattle given in Table 2 occur in areas where water and forage are seasonally limited, the cattle population concerned is of the order of 68 million head. Because wealthy cattle owners need additional labour and also attract more dependents, it is reasonable to suppose that the human population is somewhat larger than the milk supply will allow on the basis of Dahl and Hjort's assumptions. Thus one may assume that 5 to 6 million people are dependent on these animals for their survival, or a much larger number for part of their livelihood. The estimate of the total human population in the dry lands of sub-Saharan Africa who base their livelihood on animal production is 17 million people. Of course the whole continent is not usually affected by drought at the same time, and 'only' 100 000 to 200 000 people died when they lost about 80% of their livestock in the Sahel drought (UN, 1977). Nevertheless, the slender resources of the pastoral production system are already being exploited to the limit in many regions. For example, a Rendille tribesman in northern Kenya, weighing over 70 kg at the start of the season, may expect to have lost 10 kg by the end of it; if he drops to less than 58 kg he will be in very poor health (H.J. Schwarz, unpublished). There is only a small margin of safety left in the system, and any further degradation of the rangelands will result in drought conditions over much larger areas of Africa during normal years.
What are the trends in livestock numbers and management in the semi-arid rangelands of sub-Saharan Africa? The growth in numbers between the early 1960s and the mid-1970s was about 20% (Table 3). Not all this growth occurred in the semi-arid areas, in fact in parts of East Africa (D. Western, unpublished) and presumably the Sahel, herds which were severely depleted by the droughts in the 1960s and 1970s may only now have recovered to their original numbers. However the cattle numbers in many arid and semiarid parts of Africa in the mid-1970s were still estimated by Bourn (1978) to be above the optimum large herbivore biomass suggested by Coe et al (1976).
The outlook for livestock management, given generally scarce range resources, is hardly more encouraging. It is now belatedly realized that some traditional pastoral systems had achieved a well balanced ecological adaptation to their environment, maintained by a complex social structure which is closely related to the regulation of access to a limited water resource (Helland, 1980). The provision of development aid, particularly water and veterinary services, can have a very disruptive effect on such systems.
It is ironic that this realization should occur at a time when traditional livestock systems are disintegrating in the face of new technologies. It is impossible to put the clock back, but lessons must be learnt from the experiences of the past few decades. For a start, we should try to understand the production systems with which we are interfering. From the animal science point of view, this means looking more closely at the indigenous livestock. The pastoralist is primarily concerned with risk reduction strategies, given the limited resources available to him and the likelihood that they will become scarcer in the future (unless there is a dramatic breakthrough in such areas as tropical legumes and population control). For the moment the tribal herdsman achieves productivity through the survival of his stock and its rapid powers of recuperation, and by an increase in animal numbers rather than by high individual animal performance. Consequently, the introduction of temperate or locally 'improved' breeds with their higher demands for water and good quality forage may be inappropriate at present.
Table 3. Recent population numbers and trends of different species of livestock in sub-Saharan Africa.
|
Species |
Million head |
Population changes |
||||
|
1961-65 |
1974 |
1975 |
1976 |
Million head |
% |
|
|
Donkeys |
7.31 |
7.04 |
7.11 |
7.19 |
- 0.12 |
- 2 |
|
Horses |
2.31 |
2.61 |
2.68 |
2.74 |
+ 0.43 |
+ 19 |
|
Mules |
1.35 |
1.44 |
1.44 |
1.45 |
+ 0.10 |
+ 7 |
|
Camels |
6.79 |
6.38 |
6.91 |
7.17 |
+ 0.38 |
+ 6 |
|
Cattle |
106.25 |
129.78 |
132.59 |
136.40 |
+ 30.15 |
+ 28 |
|
Goats |
90.94 |
99.50 |
102.46 |
104.46 |
+ 13.52 |
+ 15 |
|
Pigs |
3.73 |
5.83 |
6.02 |
6.22 |
+ 2.49 |
+ 67 |
|
Sheep |
73.49 |
82.64 |
85.97 |
89.11 |
+ 15.62 |
+ 21 |
|
Total |
292.17 |
335.22 |
345.18 |
354.69 |
+ 62.57 |
+ 21 |
Source: FAO (1977).
Table 4. The relative importance of different animal products in sub-Saharan Africa.
|
|
Agricultural rolea |
|||||||
|
Species |
% of total biomass (kg0.75) |
Milk |
Meat |
By products |
Draught |
Pack |
Riding |
Blood |
|
Cattle |
67 |
++++ |
+++ |
++ |
+++ |
+ |
+ |
+ |
|
Goats |
11 |
+ |
+++ |
++ |
|
|
|
|
|
Sheep |
9 |
+ |
+++ |
++ |
|
|
|
|
|
Camels |
6 |
++++ |
++ |
++ |
++ |
+++ |
++ |
+ |
|
Donkeys |
3 |
|
|
|
++ |
+++ |
++ |
|
|
Horses |
2 |
|
|
|
++ |
++ |
+++ |
|
|
Pigs |
1 |
|
++ |
++ |
|
|
|
|
|
Mules |
1 |
|
|
|
++ |
+++ |
+++ |
|
a + = positive role.
Source: Table 2 and J.M. King (unpublished).
The agricultural role of the different species of livestock in sub-Saharan Africa, together with the relative importance of the different animal products, is shown in Table 4. As already indicated, the dominant animal is the zebu cow, which is a multi-purpose animal which must supply the household with milk. The average amount of milk taken per cow is about 90 kg per annum, whereas calf production is in the region of 150 kg (ILCA, 1979a). Camels take over the role of cattle in the drier areas, producing a similar weight of calf per annum but with more milk (1460 kg) being taken for human consumption (section 5.2.2). The percentage of the cattle herd kept for power varies from 0% in many pastoral communities to between 30 and 50% of the herd in the dryland farms of the Sahel and Botswana, and the highland farms of Ethiopia (Reed et al, 1974; ILCA, 1978; ILCA, 1979c). A figure of 15% for camels in Southern Darfur is given by Wilson (1978a). Smallstock are kept primarily for meat, although byproducts such as hides, skins for water bags, and wool may make an important contribution to the household economy. Pigs and small and dwarf breeds of ruminant livestock occur in the more humid zones where water is not a major constraint to production. They will therefore receive little attention in this report. The other species, with the exception of the horse and mule which make up only a small proportion of the total livestock population, will be considered in some detail.
The emphasis of this report is on livestock water and energy turnover in the dry season under the present range management conditions in Africa, and those predicted for the immediate future (chapter 5). The implications and applications of this information to management, development and research will be discussed in chapters 6 and 7. However, before embarking on the more practical aspects of the problems of animal water needs in relation to climate and forage, a considerable part of the report has been devoted to general physiological principles (chapters 2, 3 and 4). These chapters on body water, water balance and factors affecting water turnover describe some of the components of a water and energy model. The examples of physiological mechanisms are not confined to conventional livestock if the mechanisms are better understood or developed in other species, especially African game animals.
The reason for this description of fundamental physiology is that, once the animal scientist has grasped the underlying principles, he should be able to model his own field situation if this differs from the examples given. However, it is equally appropriate for the more casual reader to turn from this introduction to chapter 5 onwards, and treat the intervening sections as reference material.
![]()
![]()
![]()