![]()
![]()
![]()
9.7.1 Beef products
9.7.2 Dairy products
Marketing organisations and control
Marketing beef in Alphabeta has been subject to extensive state control since independence. Control is through the Meat Marketing Commission (MMC) and the Cattle Marketing Division (CMD) of the Ministry of Agriculture. Through the MMC, the Government controls slaughter for export and urban markets. Through the CMD it owns and operates all primary market outlets, stock routes, holding grounds and quarantine facilities. The CMD is active in marketing stock from the arid range areas and in maintaining a system of floor prices for cattle marketed in these areas.
The Government's principal objectives in the controlled marketing of beef products are: to generate a flow of improved grades of meat for urban and export markets; reduce the cost of living for the urban consumer; and limit the spread of disease, particularly foot-and-mouth, in order to improve export prospects.
The MMC operates two large abattoirs and licenses an additional 16 private or council abattoirs to operate within urban areas.
Beef marketing policy
Beef prices are controlled at producer, wholesale and retail levels but prices for smallstock are not controlled. Producer prices for beef have remained well below export parity levels despite periodic increases announced by the MMC in recent years. This has four important effects:
· illegal trading and slaughtering operations
· increase in urban demand for high and low grade beef
· increase in rural demand for low grade beef
· static production in prime quality beef from commercial and other ranches.
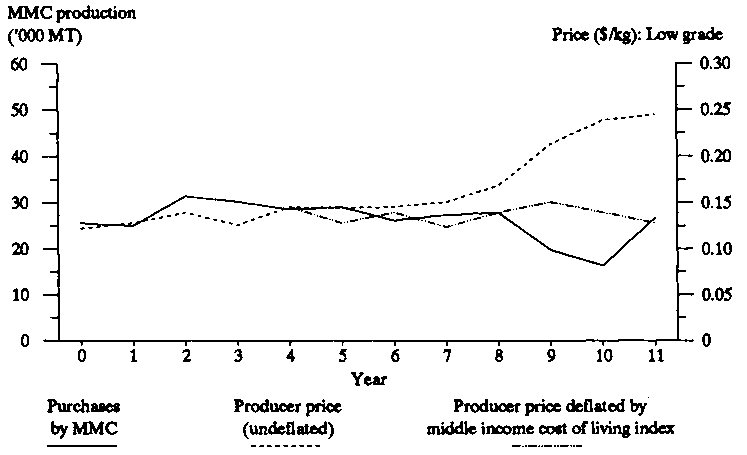
Illegal trading and slaughtering within, and adjacent to, urban areas have effectively eroded MMC's monopoly of the urban market and resulted in declining amounts and proportions being sold through official channels (Figure 9.20). As a result, MMC's slaughtering capacities have remained under-utilised.
The pricing system adopted has also contributed to an increase in urban demand for high and low grade beef (Table 9.20). Beef prices have, in fact, declined in real terms (Table 9.21) and relative to prices paid for other commodities (Table 9.20). On the other hand, average urban incomes have increased in real terms, particularly for the upper and middle income groups, as a result of wage agreements.
Table 9.20. Urban demand and retail price indices for beef compared with cost of living indices (Year 4 = 100).
|
Urban demand1 |
Indices of price and cost of living (food) | |||||
|
Year |
Per capita |
Total |
High grade beef price |
Middle income |
Low grade beef price |
Low income |
|
4 |
20.0 |
15.1 |
100 |
100 |
100 |
100 |
|
5 |
18.0 |
14.3 |
109 |
103 |
101 |
103 |
|
6 |
19.0 |
15.8 |
101 |
111 |
111 |
112 |
|
7 |
20.5 |
18.0 |
101 |
115 |
111 |
113 |
|
8 |
23.0 |
21.2 |
113 |
126 |
121 |
126 |
|
9 |
24.5 |
23.7 |
116 |
150 |
121 |
155 |
|
10 |
26.0 |
26.4 |
123 |
179 |
140 |
186 |
|
11 |
26.0 |
27.7 |
139 |
188 |
140 |
195 |
1 Main urban centres only.
Table 9.21. Urban beef retail prices in constant and current dollar terms for low and high grade cuts.
|
Year |
Current prices (A$/kg) |
Constant prices (A$/kg)1 |
||
|
Low grade in bone |
High grade boneless |
Low grade in bone |
High grade boneless |
|
|
4 |
0.26 |
0.54 |
0.26 |
0.54 |
|
5 |
0.27 |
0.59 |
0.26 |
0.57 |
|
6 |
0.29 |
0.55 |
0.26 |
0.50 |
|
7 |
0.29 |
0.55 |
0.25 |
0.48 |
|
8 |
0.32 |
0.61 |
0.25 |
0.48 |
|
9 |
0.32 |
0.63 |
0.21 |
0.42 |
|
10 |
0.36 |
0.66 |
0.19 |
0.37 |
|
11 |
0.37 |
0.75 |
0.19 |
0.40 |
1 Deflated by the middle income urban cost of living index (year 6=100).
Figure 9.2. Meat Marketing Commission: Official beef purchases and producer prices (CDW).
Barring changes in preferences, beef prices and prices of substitutes (e.g. mutton and milk), the demand for beef will increase with increases in incomes and population according to the following formula:
D = p+ng
where:
D = percentage change in demand
p = the population growth rate
g = the growth in real per capita incomes
n = the income elasticity of demand for beef.
Studies of beef demand in Alphabeta's urban centres have found the following elasticities:
|
Income elasticity of demand for beef (urban): |
1.00 |
|
Price elasticity of demand for beef (urban): |
-1.20 |
Estimates of cross price elasticities of demand for mutton and milk were not made. However, these are certainly positive (i.e. mutton and milk are substitutes).
Given the 2% annual real increase in urban per capita incomes and the estimated 5% annual increase in urban population, urban beef demand has been increasing by 7% (5 + 1 x 2) annually. Falling real beef prices and high prices for substitutes have caused additional demand.
Less is known about beef demand (as distinct from consumption) in rural areas. However, apart from beef and meat products consumed on farm, there is a rural demand for purchased beef, particularly in the medium-to-high potential regions of the country. The actual amounts sold in these areas are, however, not known. Various estimates of income and price elasticities of demand for beef in rural areas have been made but these can only be treated as approximations. One such estimate is as follows:
|
Income elasticity of demand for beef (rural): |
1.0-1.20 |
|
Price elasticity of demand for beef (rural): |
-1.30 |
In addition, it has been estimated that the average per capita rural consumption of beef is between 5-8 kg/year. This average conceals substantial variation within and between ecological regions. This is dependent on such factors as income level, household size and structure, consumption habits, seasonal conditions and prices of other food commodities. Consumption per caput of purchased beef has remained static for some time. With rising rural populations, this implies that the demand for low quality beef in rural areas has increased at the rate of population increase (i.e. 4%/year). As a result of this increased demand, inferior quality stock are being marketed in increasing numbers in rural areas. This reduces the stock available for finishing at group, individual and co-operatively owned ranches arid, thus, affects the supply of beef to urban areas.
Government pricing policies have also affected the production of prime quality beef from commercial and other ranches. The MMC price to the producer has consistently been kept below export parity levels, and price differentials between different grades have been comparatively narrow (Table 9.22).
Because of rising input costs coupled with relatively low prices for beef compared with other enterprise alternatives, there has been little incentive for the production of prime quality beef. This is reflected in the statistics on chilled or frozen beef exports in Table 9.7. The quantity of beef exported in these categories has remained relatively static for the past eight years and the proportion of superior grades delivered to the MMC has also remained comparatively unchanged during the same period (Table 9.23). Since commercial ranches account for approximately 50% of official MMC sales for slaughter, the inference is that over half the sales from the commercial ranching sector must have been of standard or poorer grade cattle.
Table 9.22. Beef producer prices grade differentials (CDW).1
|
Year |
Current prices (A$/kg) |
Constant prices (A$/kg) |
||
|
GAQ2 |
FAQ3 |
3rd Grade |
4th Grade |
|
|
4 |
0.170 |
97 |
81 |
70 |
|
5 |
0.175 |
95 |
78 |
68 |
|
6 |
0.203 |
93 |
70 |
61 |
|
7 |
0.222 |
92 |
68 |
59 |
|
8 |
0.239 |
93 |
73 |
63 |
|
9 |
0.265 |
94 |
78 |
67 |
|
10 |
0.299 |
93 |
79 |
69 |
|
11 |
0.334 |
97 |
72 |
63 |
1 CDW = cold dressed weight.
2 GAQ = good average quality.
3 FAQ = fair average quality.
Table 9.23. Proportion of deliveries in different grades delivered to MMC (%).
|
|
Year 4 |
Year 11 | |
|
Good average quality |
|
| |
|
|
Prime |
0.03 |
0.02 |
|
|
Choice |
7.4 |
6.7 |
|
|
FAQ1 |
15.0 |
16.1 |
|
3rd Grade |
|
| |
|
|
Standard |
25.0 |
25.2 |
|
|
Commercial |
48.1 |
47.6 |
|
4th Grade |
|
| |
|
|
Manufacturing |
3.97 |
4.38 |
1 FAQ = fair average quality.
Beef marketing efficiency (MMC)
Information on meat processing costs incurred by the MMC over time demonstrates serious inefficiencies within the formal marketing structure for beef products. The following evidence supports this statement:
· Between years one and six, MMC's total costs rose by 31% compared with the Wage Earners' CPI which rose by 13% and the implicit GDP deflator of Manufacturing and Repairs which rose by 22% during the same period.· Between years 7 and 11, total MMC costs increased by 139% compared with a corresponding GDP deflator growth of 38% and a CPI growth of 63%.
· When costs are compared with licensed private slaughtering operations in urban areas, it can be seen that the latter operate on a margin of 5 cents/kg CDW compared with an MMC margin of 7.5 cents/kg CDW (i.e. 50% higher). Private operators can therefore afford to offer a higher price to the producer and/or offer a lower price to the consumer. This is one explanation of the diversion of urban supplies from the MMC in recent years. However, larger producers of high grade export quality beef continue to sell through the MMC largely because they prefer to operate through established and regular marketing channels.
Cattle marketing
Little is actually known about supply-price response relationships in cattle marketing from the traditional sector (particularly the pastoral and agropastoral subsectors). Only a small proportion of stock sold from these areas go through official channels. The major portion is sold to rural butcheries and traders or to other rural households. However, the following general comments on the supply response of traditional cattle owners, based on studies within and outside Africa, can be made:
· There is conflicting evidence within Africa on short-term price-supply relationships. Surveys conducted in Sudan argue that the price elasticity of supply in the short-term is positive. On the other hand, time series studies done in Swaziland and Zimbabwe indicate that the response to price changes is negative. Another time series study in Botswana shows a positive short-run relationship and only one study in Swaziland has shown a long-run negative supply response between the cattle offtake rate and price.· A negative short-term price-supply response relationship has also been observed for beef ranches in North and South America. Producers in these countries may withhold sales (in anticipation of a long-term price rise) in order to maximise long-run profits. Steer sales, for example, may be withheld to increase body weight and thereby increase the average price received on sale. Cows designated for culling may likewise be withheld from sale in an attempt to increase herd size through additional carvings.
· One explanation for the observed negative supply response relationship for African cattle owners is that cattle are held as a store of wealth and are required for consumption and production purposes. Owners will therefore be reluctant to sell, but if forced to do so to meet cash needs, will sell the minimum number of cattle. A real price increase for cattle may therefore result in an overall decline in the offtake rate, since cash needs can be met by the sale of fewer cattle. Although they are difficult to discern, price-supply relationships for African herders are of critical significance to livestock development policy.
Marketing organisation and control
The processing and urban sale of milk is controlled by the National Dairy Co-operative (NDC) which normally handles an estimated 25% of total milk production and 96% of all milk passing through commercial channels. The NDC is a commercial company; it is also a producer co-operative. Membership has grown since independence, largely resulting from expansion of the small-scale sector. There are now 294 registered co-operative societies, 3100 individual members and approximately 2500 temporary member suppliers. Retail prices for all goods marketed through the NDC and prices it pays to farmers are controlled by the government.
Important trends in raw milk deliveries to NDC and milk demand patterns over a period of 11 years have been as follows:
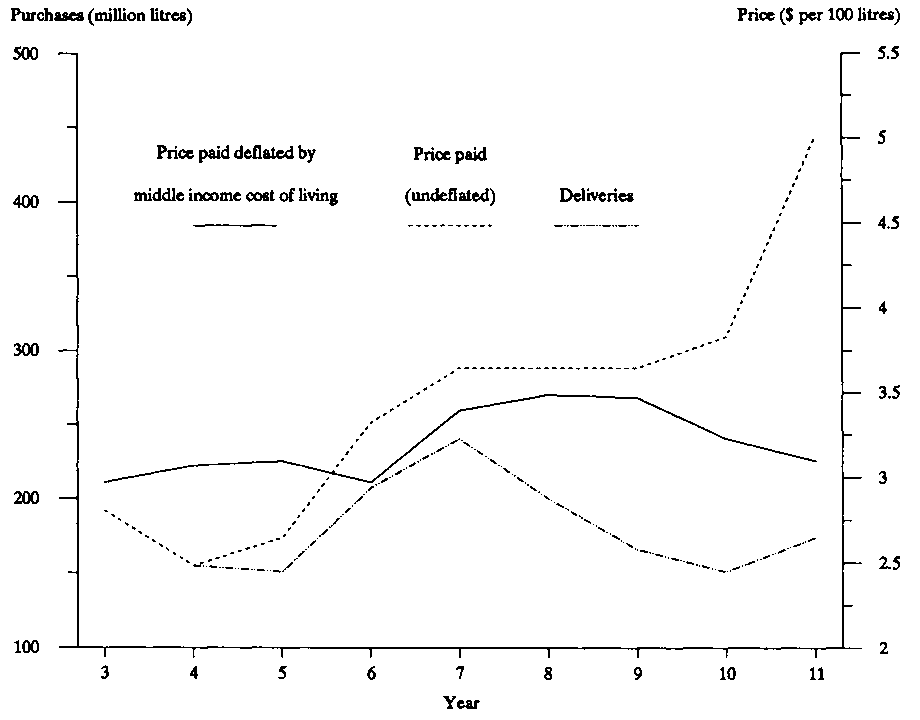
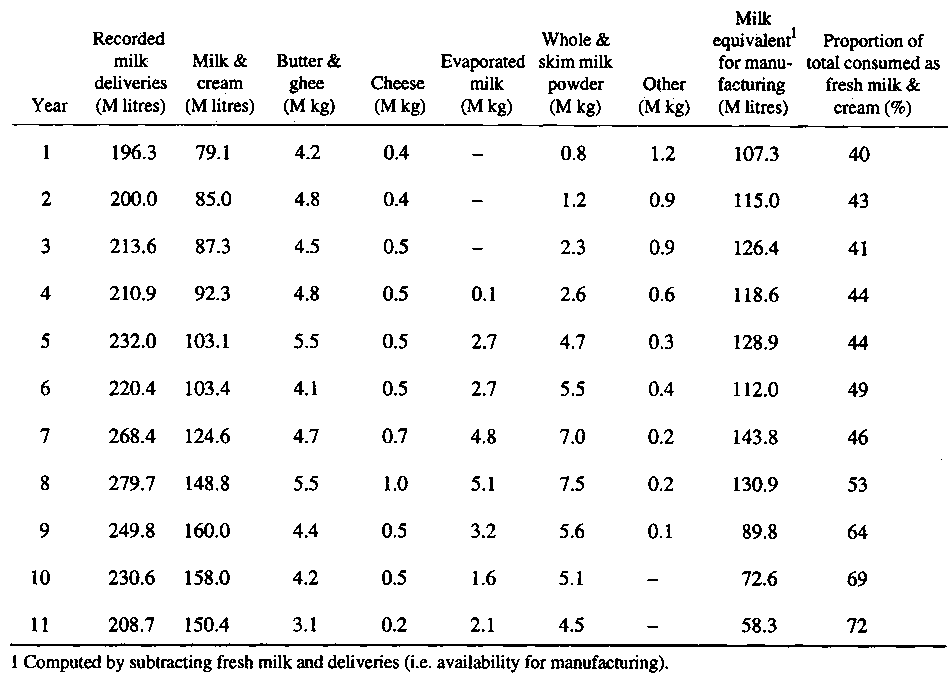
· NDC liquid milk sales have steadily increased since independence but deliveries have recently declined despite an eight year upward trend in producer prices (Figure 9.3).· There has been a rising demand for liquid milk in urban areas (Table 9.24). The proportion of total deliveries by NDC consumed as fresh milk and cream has thus risen from 40% in year one to 72% in year 11. This has reduced the amount available for manufacturing purposes. With rising population and urban income levels, this trend is likely to continue, reducing the amount available for manufactured export products (Table 9.1). The pattern of overall demand for milk is unknown however, because informal sales in the rural sector account for a substantial proportion of the milk sold.
Milk pricing systems
Milk production in Alphabeta is highly seasonal, and difficulties have arisen in maintaining supplies during the off-season when urban shortages become a problem. In an attempt to iron out such seasonal fluctuations, NDC initially used a differential pricing system. Under this system, premiums were paid to large-scale producers who maintained supply levels throughout the year, and lower prices were paid to seasonal producers who reduced their supplies during the off-season (December-March). Milk produced in remote areas was only accepted in the form of butter fat to reduce the NDC's transport commitments.
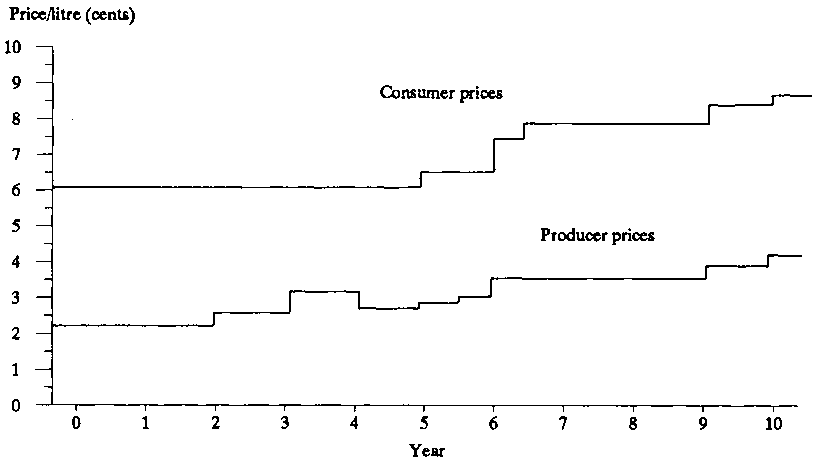
Figure 9.3. Milk purchases and prices paid by NDC.
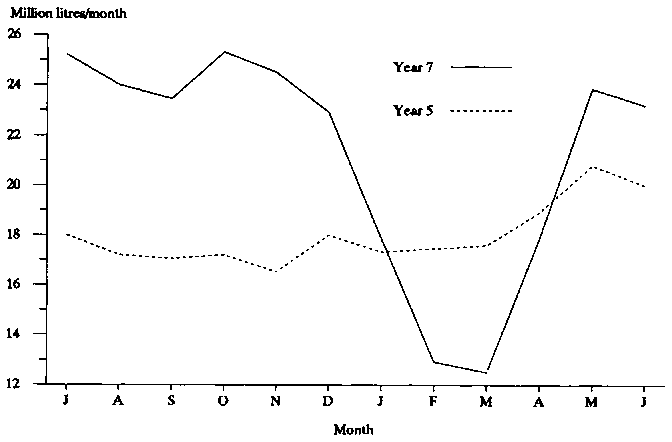
However, political pressure in year five forced the government to abolish this differential pricing system and to announce a uniform price for all milk, irrespective of season or distance from manufacturing facilities. This price was equivalent to the premium price paid to large-scale producers under previous pricing arrangements. In effect, all small-scale producers benefited from a price rise of 45%. Figure 9.4 demonstrates the impact of the price increase on seasonal supplies to the NDC before and after the policy.
With the availability of grade dairy stock in medium-to-high potential areas of the country, smallholders responded to the new pricing system by increasing production. But, limited dry season supplies were diverted to higher priced (informal) local markets in rural areas, and surpluses during the flush period (normally April-October) were sent to the NDC.
The NDC was then faced with a serious over-supply problem during the flush period, and the requirement that it purchase all supplies offered at the established price strained its financial resources. Moreover, to cope with seasonal gluts in supply, additional manufacturing capacities were needed and built, but these were under-utilised during the off-season.
Table 9.24. Deliveries of raw milk to and production by NDC.
The pricing system adopted in year five also encouraged production from remote areas, effectively concealing the transport costs involved in supplying milk to consumers. As a result, the NDC's marketing costs increased and were passed on to consumers (Figure 9.5). Consumers were taxed in other ways. The consumer pricing system adopted by the NDC is based on using profits generated from liquid milk sales to subsidise the sale of manufactured products. Whole milk which requires minimal processing (cartons or bottles) is sold at more than double its purchase price (Figure 9.5). In contrast, processed products are sold at prices which do not cover the costs of purchase, transport and processing. Surpluses of manufactured products intended for the export market are therefore subsidised by the Government's price policy. Furthermore, as consumption of liquid milk has increased, the production of manufactured goods has declined (Table 9.24), resulting in excess capacity in NDC's processing plants. This, in turn, has raised the cost per unit of manufactured goods, increasing the subsidy required on these items.
Factors behind rising urban milk demand and decreasing NDC deliveries.
Since year seven, the CPI for milk has remained relatively stable compared with increases for all other important urban food commodities (Table 9.25) and this partially accounts for the rise in urban milk demand from year seven onwards (Table 9.24).
Despite recent price increases for whole milk, supplies marketed through the NDC have declined (Figure 9.3 and Table 9.24). The following reasons have been given:
· Input prices for the dairy sector increased more rapidly than producer prices during this period. Oil price increases directly affected prices of inputs such as chemical fertilisers and insecticides. Therefore, the real price paid to the producer declined.· At the same time, output prices for competing farm enterprises increased relative to milk. This was particularly the case for coffee and maize, which are produced as cash crops in the high potential zones of the country where dairying is also practiced on an intensive basis. Resources
(labour and land) were therefore transferred out of dairying into cash cropping. The rise in maize prices also increased concentrate costs (refer to Table 9.26 for a comparison of price indices for maize, milk and coffee).· Rising prices for these crops increased rural incomes for cash croppers in these areas and this, given a high income elasticity of demand for milk in rural areas, probably resulted in a diversion of supplies from the NDC (Table 9.24).
Figure 9.4. Seasonality of milk supplies to NDC (years 5, 7).
Table 9.25. Index of consumer prices for milk compared to other food items (Year 7=100).
|
Year |
Milk |
Maize meal |
Wheat flour |
Low grade beef |
Sugar |
Rice |
|
7 |
100 |
100 |
100 |
100 |
100 |
100 |
|
8 |
100 |
100 |
100 |
110 |
130 |
100 |
|
9 |
100 |
129 |
148 |
110 |
130 |
130 |
|
10 |
100 |
165 |
189 |
110 |
189 |
139 |
|
11 |
119 |
165 |
189 |
127 |
243 |
182 |
The farm-gate price for whole liquid milk paid to the producer is significantly less than the border price per unit at the official exchange rate. Adjustments for overvaluation of the local currency widen this gap even more (Table 9.27).
Table 9.26. Index of producer prices for coffee, maize and whole liquid milk (year 4 = 100).
|
Year |
Coffee |
Maize |
Milk |
Milk: Maize |
Milk: Coffee |
|
4 |
100 |
100 |
100 |
100 |
100 |
|
5 |
119 |
100 |
100 |
102 |
86 |
|
6 |
101 |
121 |
133 |
110 |
132 |
|
7 |
124 |
141 |
148 |
105 |
119 |
|
8 |
146 |
141 |
148 |
105 |
101 |
|
9 |
160 |
168 |
148 |
88 |
93 |
|
10 |
170 |
253 |
163 |
64 |
96 |
|
11 |
410 |
278 |
202 |
73 |
50 |
Figure 9.5. Consumer and producer price differentials for whole liquid milk* (years 1-10).
Table 9.27. Ratios of liquid whole milk producer prices to border prices.
|
Year |
Unadjusted official exchange rate |
Adjusted shadow exchange rate |
|
5 |
0.38 |
0.30 |
|
6 |
0.64 |
0.51 |
|
7 |
0.71 |
0.57 |
|
8 |
0.73 |
0.56 |
|
9 |
0.71 |
0.55 |
|
10 |
0.58 |
0.48 |
|
11 |
0.66 |
0.53 |
Response to price changes
Estimates of the short-term (less than one year) supply response of the small-scale dairy sector are not available, but the evidence cited in the previous section suggests that it is elastic. In the short term, when production cannot easily be augmented or reduced, supply changes will mostly result from changes in home consumption. Peasant dairy producers consume milk produced on farm. Given that local markets are saturated, increases in milk prices relative to other products will normally result in increased sales to the NDC and reduced levels of home consumption. With a reduced price, however, sales to the NDC are less attractive and more milk is retained for home consumption. Households' ability to adapt milk supplies to changing economic circumstances also means that supplies to the NDC may be irregular. In the medium term, adjustments to a long-term milk price rise may be made by increasing or decreasing the size of grade dairy herds. The effectiveness of this strategy will be limited by the availability of grade dairy animals from the large-scale sector.
In rural areas, the price and income elasticity of demand for milk is high and comparable to beef. Rural per caput consumption has been estimated at approximately 50 litres/year. This will vary with levels of cattle ownership, cultural practices, age structure of the household and seasonal conditions. The vast bulk of milk is consumed on farm and never sold, so that it is estimated that only 25% of the total ever reaches the market.
In conclusion, rising urban and rural demand for whole milk is eroding surpluses available for production of manufactured products and exports. Such a trend is obvious from Tables 9.1 and 9.24. This, in itself, is not too problematic but trends in production and consumption also indicate that local production may soon be inadequate to meet local demand. Alphabeta would then be forced to import milk and other dairy products. Recent proposals to introduce free school milk will only add to this need.
|
Important points (9.7) Beef products · Beef marketing in Alphabeta is subject to extensive state control. · Through the MMC, government controls slaughter for the urban and export market and through the CMD it controls the domestic marketing of stock. · Two main characteristics of the beef pricing policy are: beef producer prices have remained well below export parity levels, and beef prices have declined in real terms and relative to. prices paid for other commodities. · The marketing and pricing policies pursued by the Government have resulted in: 0 illegal trading - increased urban demand for beef 6 static export trade Dairy products · The processing and urban sale of milk is controlled by the NDC. · The NDC handles 25% of total milk production and 96% of all milk passing through commercial channels. · Urban demand for milk is rising. · Political pressure forced the government to abolish the differential pricing system and to adopt a uniform pricing system for all milk products. · The policy revision placed NDC in financial difficulties and a serious over-supply problem. Consumer prices also increased. · Other consequences of the revised policy are: subsidisation of the price of manufactured dairy products and increased cost per unit of manufactured products. · Rising urban and rural demand for whole milk is likely to reduce the export of manufactured products and increase their import. Economic inferences · Government attempts to control prices are seldom ultimately successful, especially if controls are not in line with underlying demand and supply conditions, Controls on consumer prices lead to shortages and illegal markets. Most consumers pay more. for controlled items in terms of time spent in obtaining the items, bribes or premiums and inflated black market prices-if they can find the items at all. The effect is often worse than if no controls had been in existence in the first place. Ceiling prices for producers cause them to abandon production and substitute an uncontrolled output, sell on the black market where returns are higher or smuggle their output across the border. These outcomes were observed in Alphabeta's meat and milk markets. · A properly functioning price system should convey information about relative resource scarcities to consumers and producers. This helps ensure efficient resource utilisation as items in comparative abundance (and relatively cheap) are used, and items in comparative scarcity (and relatively expensive) are conserved. As was the case in Alphabeta, when relative prices change, consumers will substitute other items in consumption and producers will shift to other output. The differential milk pricing system in Alphabeta helped with this. When it was abandoned, milk processing and marketing resources were less efficiently used. In addition to resource allocation, prices that accurately reflect resource scarcity will often stimulate technological innovations to overcome it. · A price system will only operate to allocate goods and resources efficiently if it does not contain gross distortions. In addition to government controls on prices or outputs, these distortions may be due to monopsony or monopoly factors, inadequate market information, high transaction or and unforseeable risk. In all of these instances, there may be a legitimate role for government to play in ameliorating or eliminating the distortions. The key is finding the proper balance lack of regulation and excessive regulation. In most African countries, including, Alphabeta, the balance has tipped towards excessive, regulation. · Marketing entails costs. These costs involve transport and storage charges, costs of acquiring market information, financing charges and risk premiums. The presence of a large number of middlemen is not sufficient evidence to conclude that marketing charges are excessive. Under African conditions, with poor infrastructure and high risk, marketing costs are often intrinsically high. It is better to look at the degree of competition amongst middlemen, · Changes in the amount of an item demanded are affected principally by changes in its price. Changes in income, the price of substitutes and complements, and changing tastes and customs may also affect demand. Planning and projections of future supply requirements must try to account for these factors. |
![]()
![]()
![]()