14.1. Introduction
14.2. CGIAR Medium-Term Planning Process
14.3. Setting the Context for TAC's Recommendations on Core Resource Allocation
14.4. Priority Setting and Factors Relevant to Resource Allocation
14.5. The Allocation Process
14.6. The Resource Allocation Methodology
14.7. 1998 Core Supply Considerations
14.8. Recommendations of 1998 Resource Allocations
14.9. Implementation and Execution of the Medium-Term Resource Allocation Process - The MTP Process
14.10. Centres' 1993 Programmes and Budgets
14.11. Conclusion
The priority analysis contained in Chapters 1-13 had four objectives. The first was to review future needs and to suggest the role the CGIAR should play. The second was to determine, within the domain of CGIAR activities, what should be the relative distribution of CGIAR activities (Chapter 12). The third was to discuss the implications of changing needs and priorities for CGIAR strategies and structure (Chapter 13). The fourth was to provide a basis for formally linking priorities to the allocation of financial resources to CGIAR institutions over the next five years' planning period. The linkage between priorities and resource allocation, in the context of strategies and structure, proceeded in two steps. First, relative priorities by activity, production sector, region and commodities were translated into resource allocation targets at the System level. In the second step an indicative core resource envelope was proposed for each of the CGIAR Centres. This indicative envelope will provide the beginning point for the next phase in programme development for the CGIAR, namely centres' preparation of medium-term plans (MTPs). The envelopes contain a target with a 10% range around it, so as to give centres some flexibility in preparing detailed programmes in the context of System priorities.
14.2.1. First Round of MTPS - 1987-89
14.2.2. Second Round of MTPs - 1992-93
The CGIAR resource allocation process has evolved over time. Initially, centres' programmes and budgets were prepared annually, complemented with multiyear projections, and were reviewed by TAC and approved by the Group. Centre programmes and budgets were based on centres' strategic plans. Starting in 1987, centres prepared five-year MTPs broadly based on CGIAR priorities as proposed by TAC and endorsed by the Group, as well as on their long term strategic plans. At ICW'90, the Group reviewed a report ("Review of the Resource Allocation Process", ICW/90/33) which examined the experience with the five-year allocation process. The Group endorsed its recommendations. One recommendation suggested a more transparent linkage between System priorities and centres' operational programmes; another recommendation urged the introduction of constrained supply considerations in a so far largely demand-driven resource allocation process. The completion by TAC of the CGIAR priorities, strategies and structure, and resource allocation analysis offers an opportunity to improve further on the linkage between System priorities and centre resource allocation in the framework of the development of new MTPs by centres.
Using TAC's 1986 priorities paper as a reference, the construction of centre MTPs became the mechanism to translate System's priorities into operational programmes. Since the development of centre MTPs was, from a core resource point of view, open-ended, centres were able to present the full potential of their core programmes and activities in an environment of unconstrained core supply. However, the initial round of MTPs had two major limitations.
Firstly, the review and approval of centre MTPs was phased over a three-year period, causing the MTP time horizon of individual centres to vary from 1988-92 to 1990-94. This reduced the scope for a comprehensive monitoring of the achievement of System priorities resulting from the implementation of individual centre MTPs.
Secondly, the sum of centres' core resource requirements was substantially in excess of actual core funding during the implementation of the MTPs. Consequently, each year centre core requirements needed to be adjusted downward mechanically which generated increasing discrepancies between approved MTP programmes and centres' actual operational programme levels.
Consistent with the recommendations of the review report and in order to ensure the operational character of the System priorities and strategies, the CGIAR has requested TAC to extend its priority analysis to include indicative allocations of limited core resources to CGIAR Centres consistent with the System priorities TAC proposes.
In the framework of the second round of MTPs, the linkages between the System priorities, prospective System resource availability and centre MTPs will be more systemic and made more explicit. Developing such linkage through an iterative and interactive process, involving TAC, the CGIAR membership and the centres, will result in providing all parties concerned a better insight into the connections between System priorities and centres' operational programmes.
The consolidation of all centre final MTPs with a uniform time horizon (1994-98) into a System five-year plan should contribute to an improved implementation of the System priorities, and provide as well an adequate monitoring tool at the System level.
Finally, drawn against an assumption of limited core supply for the System as a whole, centre MTPs will thus be constrained in their core resource requirements. This should enhance the relevance and credibility of individual and collective MTPs for CGIAR donors, who may use them as effective inputs in their own process of allocating resources to the System and to individual centres.
14.3.1. Resource Allocation Methodology
14.3.2. Time Horizon
14.3.3. Availability of Core Funds
14.3.4. Character of Recommendations on Resource Allocations
In order to respond to the CGIAR request regarding the allocation of resources consistent with its recommendations on priorities and strategies, TAC reviewed a number of options with regard to the methodology to follow, the time horizon in which to formulate allocation recommendations, and assumptions on availability of core resources.
In order to arrive at 1998 resource envelopes which are consistent with the System priorities, there were conceptually two alternative approaches. The first possible approach would consist of designing an ideal 1998 CGIAR System, with programmes and an implementing structure of institutions that would be the most cost-effective/efficient to implement the priorities in all their dimensions - i.e. by category of activity, by production sector and commodity, and by region based on TAC's analysis of the agroecological zones each region comprises. The alternative approach would consist in considering the current state of affairs (i.e. current programmes, institutional set up and resource allocation) and modifying it to ensure that the System priorities are gradually but effectively approached in the medium term.
The first alternative would have allowed the explicit recognition of expected research products - whether or not currently pursued - and in a way that is not biased by existing structural arrangements, or by current cost structures and differentials. Though intellectually attractive and most appropriate for strategic planning, this alternative was judged to be less adequate for resource allocation: its end-product would appear artificial in that it would not bear a direct relationship with current allocation realities; and, in any case, it would have required a translation into the existing structure, i.e. the existing centres which would need to develop their programmes and budgets. In addition, this approach would have required the compilation of assumptions on research costs which may not necessarily reflect current structural and institutional realities. Finally, it would have required the use of common standards of research outputs, a complex task for a multifaceted institution like the CGIAR.
The second alternative - which has been selected - is by its very nature quite practical. It begins by taking the current situation as the point of departure. It is evolutionary, rather than revolutionary, by indicating how, and how fast, modifications have to be made in the current array of programmes and entities to meet the medium/long- and medium-term priorities. It underscores the productivity as well as the value of the existing institutions, and nurtures the existing positive factors in the donor-centre and centre-centre relationships which underpin the CGIAR System. This approach entails the risk of constraining the resource allocation process to what exists now in terms of programmes and organizational entities. Thus it runs the risk of appearing to be unable to handle innovations or radical changes, some of them possibly already contemplated or implemented by centres. This limitation inherent in the chosen alternative is, however, largely offset by the strategic approach followed in the priority setting exercise. On the other hand, this constraint implies the explicit and pragmatic consideration of the implications of evolving from an existing to a different, desired situation.
In principle, there are two obvious options for setting a time horizon for the resource allocation. A first option is to retain the time horizon used by TAC for the priority setting, i.e. 20 years or the year 2010. A second option is the timeframe of the CGIAR funding cycle, i.e. one year. For the purpose of operational planning, the 20-year horizon was considered too long and the one-year horizon too short.
Consequently, an intermediate five-year time perspective was retained. This horizon is reasonably appropriate for operational planning and implementation of programme changes, as well as for the funding decision process and the implementation of changes in resource allocations, which may be called for by the medium-term resource allocation process.
The five-year horizon offers a reasonable degree of flexibility, always necessary in planning, provided a mechanism can be put in place to correct discrepancies between planning assumptions and reality (e.g. with regard to funding). Also needed is the possibility of intermediate reassessments of five-year plans to take into account externalities (e.g. fundamental changes in operating cost structures) or other circumstances which could not be foreseen at the time of the priority setting and the development of MTPs (e.g. new research opportunities).
In principle, the assumption with regard to the future level of core funding could be open ended in an environment in which the demand for resources should drive the supply of funds. However, past experience has demonstrated that this assumption is not tenable. Therefore, a supply-driven approach needs to be adopted which will inevitably constrain the demand side. This, however, raises the other issue that constrained plans represent potentially a disincentive for growth of the supply beyond the level assumed. In order to balance the two sides of the equation, several assumptions with regard to future supply of core resources were examined in conjunction with the CGIAR Secretariat: growth in constant dollar terms; constant supply in nominal dollar terms or some growth in nominal dollar terms only, both of which would imply a significant reduction of the supply in real terms; or, finally, a combination of maintenance of supply in constant dollars with real growth in selective areas.
Based on donor indications so far, the global real growth assumption seems optimistic. Also, there are no indications that the Group intends, over the medium term, to decrease its support in real terms (though fluctuations from year to year are to be expected). Thus, the no-real-growth assumption in long standing activities combined with selective real growth, for forestry and fishery activities in particular, was retained as the most reasonable.
This rather conservative planning assumption will be tempered, on the one hand, by centre plans incorporating, for TAC's and the Group's consideration, a description of their MTP at a level 10% higher than assumed by the indicative resource envelope; and, on the other hand, by the mechanism which will reconcile annually reasonable differences between assumed funding and actual supply on the basis of the priority framework.
Any recommendation on resource allocation to centres, derived from Systemwide priority considerations, would have to be considered tentative, until the Group has had an opportunity to review the implications of TAC's proposals, and the centres have tested their feasibility through the preparation of MTP proposals.
Consequently, TAC's recommendations on centres' resource allocation should be considered indicative. Their purpose is to provide a consistent basis for preparing centre MTPs for presentation to TAC and the Group. TAC will make firm recommendations on resource allocations, for approval at ICW'93, on the basis of centres' MTP proposals.
14.4.1. TAC's Focus on the Core Programme
14.4.2. Priority Setting Methodology
14.4.3. 1991 Distribution of CGIAR Core Resources
14.4.4. Results from Priority Setting
In its priority setting exercise, TAC focused on the core activities and programmes as they represent the essence of the CGIAR as a collective System; in contrast, the complementary activities and programmes, by their very nature, are prone to specific understandings and arrangements between individual donors and centres. In the priority exercise, TAC contemplates a time horizon of about 20 years (i.e. the year 2010), while it considers the medium-term frame - i.e. the next five years, up to 1998 -as an intermediary, operational stage by which directional changes towards achieving the medium/long-term priorities should begin to be implemented.
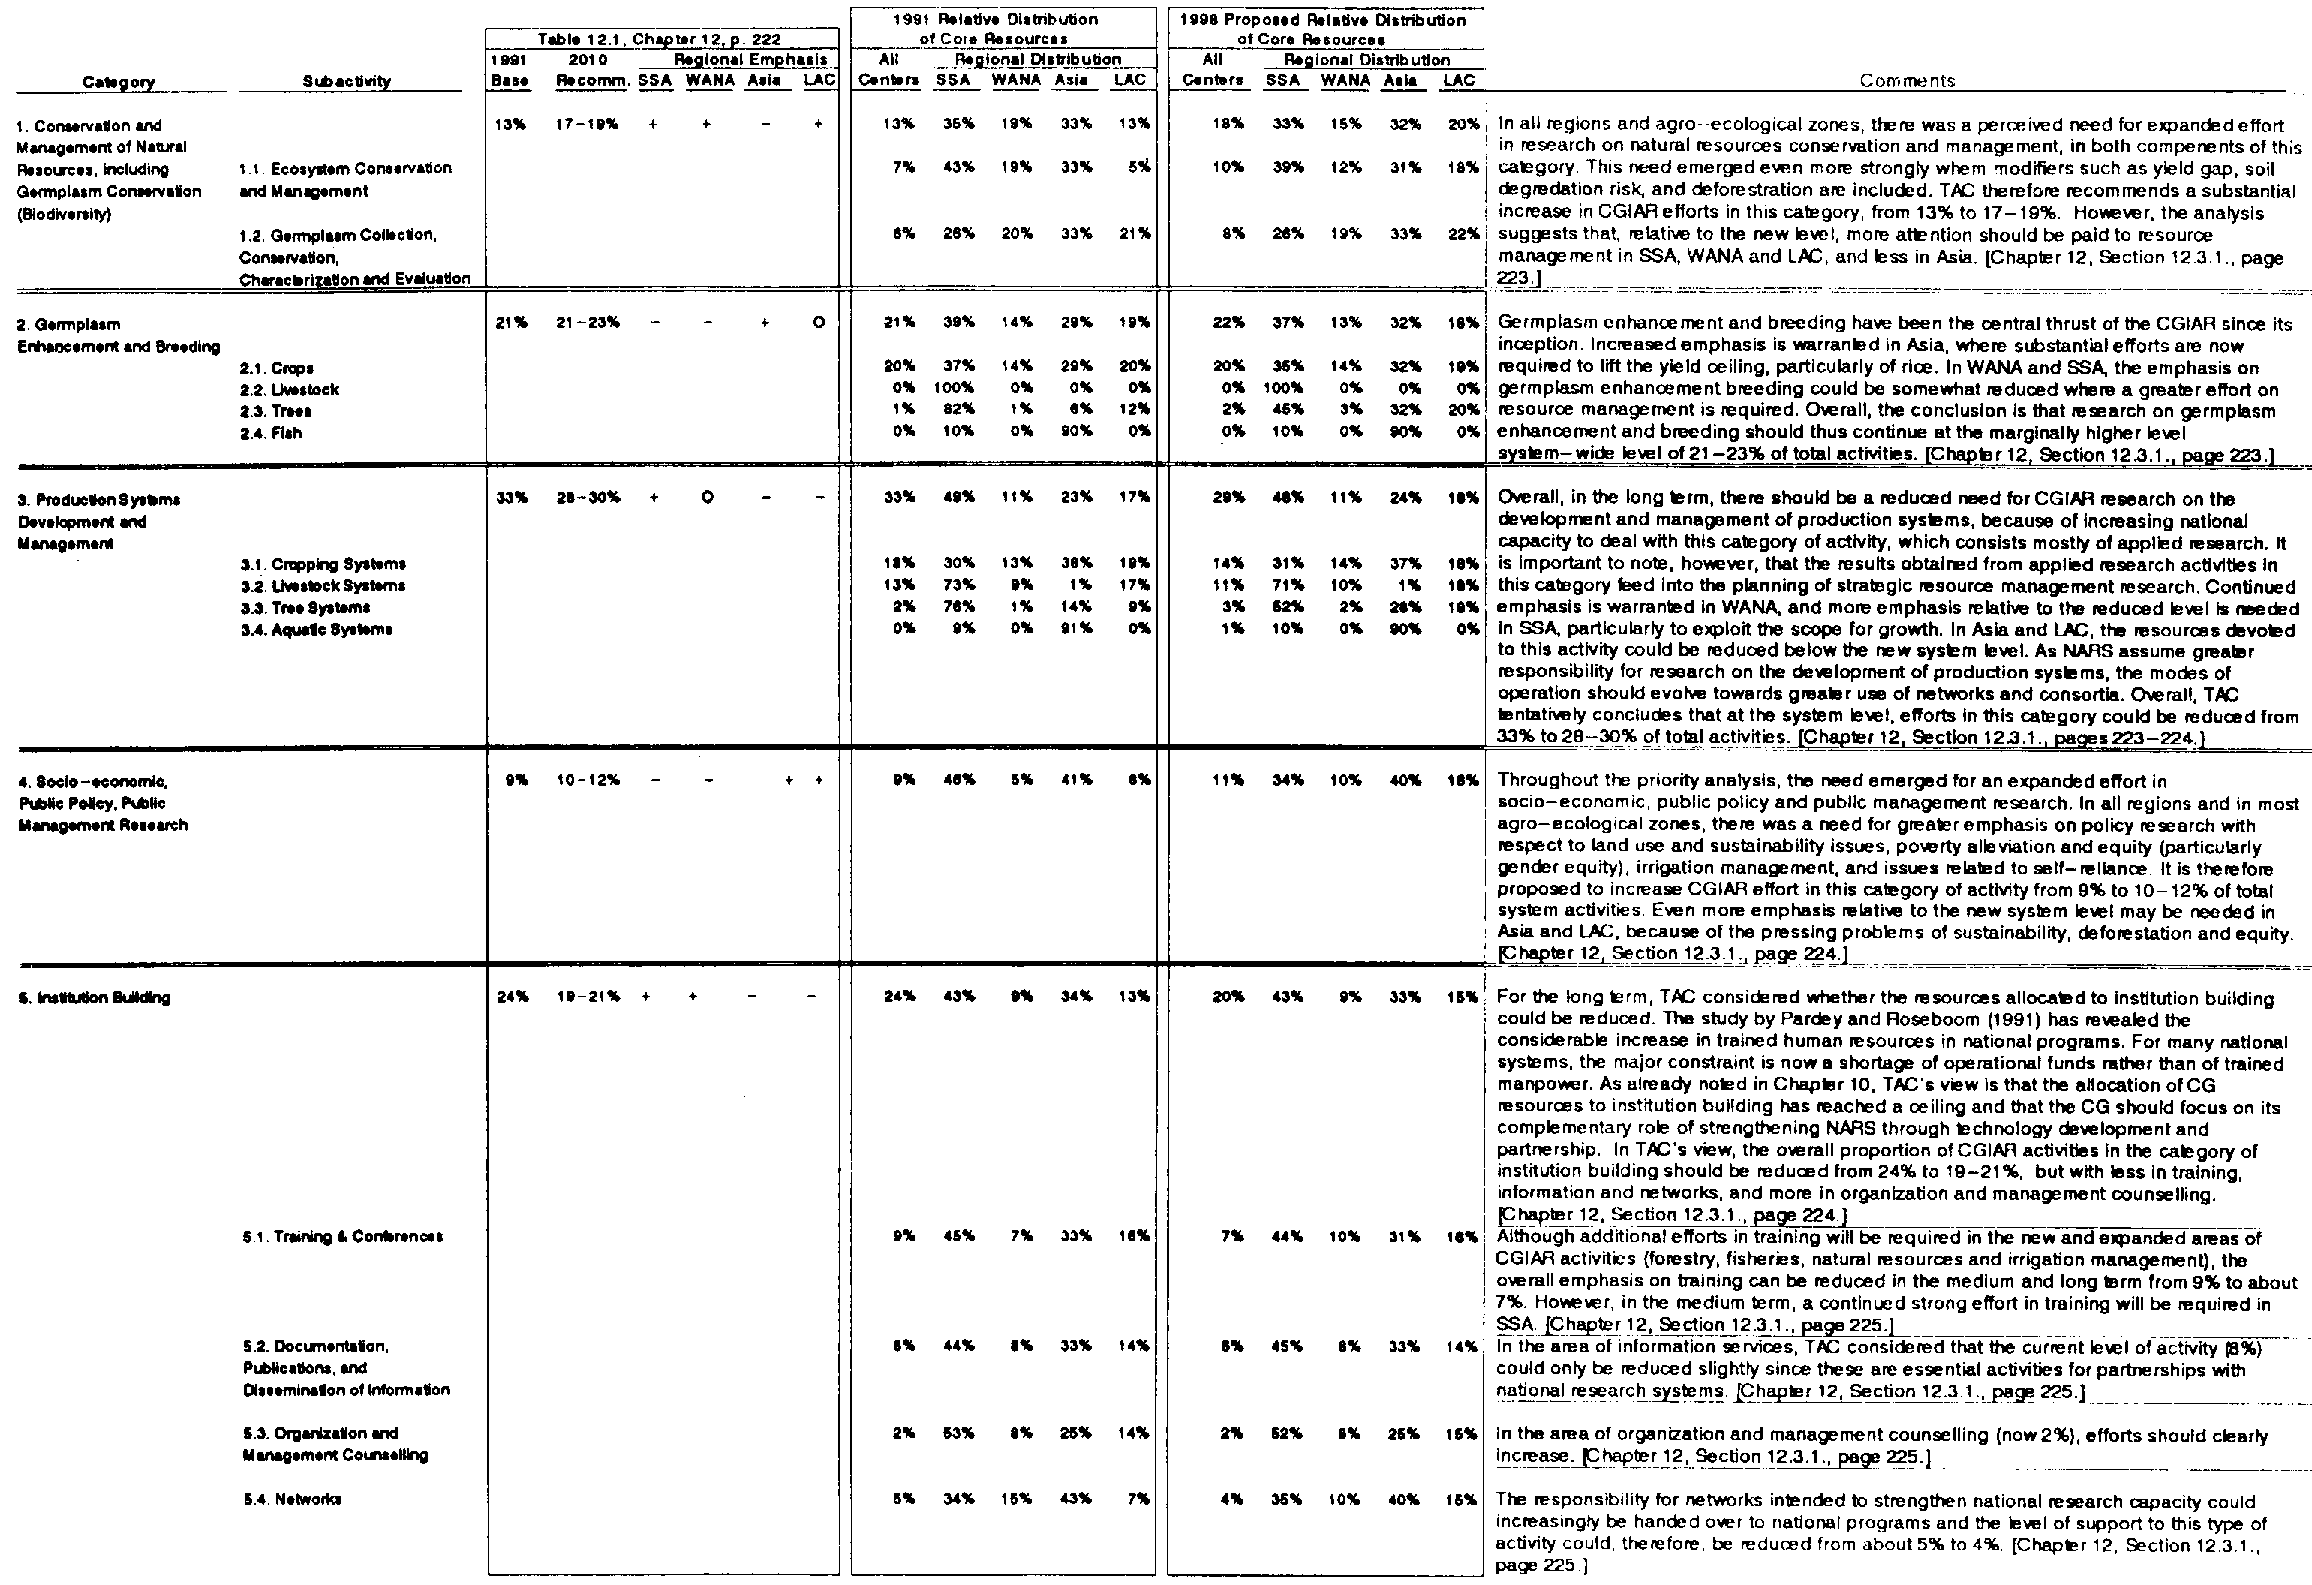
In assessing priorities of CGIAR core programmes and activities, TAC has been using a number of elements which, in their final description, are directly relevant to the resource allocation. As described in Chapter 12, TAC analyzed CGIAR priorities in a multidimensional fashion. Sequentially - and eventually in an integrated way - it analyzed and set priorities among the five major categories of CGIAR activities (Table 12.1), indicating, for each region, the relative magnitude of the change in direction for each category of activity. On the basis of an analytical assessment of the regionally defined agroecological zones, TAC analyzed and proposed priorities among the four geographical regions as commonly used in the CGIAR context (Table 12.2). Finally, TAC examined and assigned relative importance to commodities and production sectors dealt with by the CGIAR (Tables 12.3 and 12.4).
For the medium/long-term priority statements to become effective for implementation and thus achievement, they needed to be translated into operational terms. This required that they be expressed in terms of intermediate targets for 1998, whereby a relative allocation was to be assigned to each of the priority parameters indicating the desired rate of progress towards achieving the ultimate goal, i.e. the recommended relative allocations by 2010. For setting that intermediary stage, TAC put side by side its recommendations on medium/long-term priorities, both in relative quantitative terms and the descriptive rationale underlying them, and the current relative distribution of resources between the priority parameters.
Table 14.1 indicates the 1991 relative allocation of core resources among the priority parameters.
Table 14.1. CGIAR Estimated 1991 Core Resources Distribution (in %) 1/
1/ Percentages may not add to 100 due to computer rounding.
|
I. By Region: | |
|
SS Africa |
43% |
|
WANA |
13% |
|
Asia |
29% |
|
LAC |
15% |
|
II. By Category of Activity: |
||
|
1. Conservation/Management Natural Resources |
13% |
|
|
|
1.1 Ecosystem Conservation |
7% |
|
1.2 Germplasm Coll./Conserv. |
6% |
|
|
2. Germplasm Enhancement/Breeding |
21% |
|
|
|
2.1 Crops |
20% |
|
2.2 Livestock |
0% |
|
|
2.3 Trees |
1% |
|
|
2.4 Fish |
0% |
|
|
3. Production Systems Development/Management |
33% |
|
|
|
3.1 Cropping Systems |
18% |
|
3.2 Livestock systems |
13% |
|
|
3.3 Tree Systems |
2% |
|
|
3.4 Aquatic systems |
0% |
|
|
4. Socio-econ./Public Policy/Public Management Research |
9% |
|
|
5. Institution Building |
24% |
|
|
|
5.1 Training/Conf. |
9% |
|
5.2 Doc./Pub./Dis. Info. |
8% |
|
|
5.3 Org./Mngmnt. Counsel. |
2% |
|
|
5.4 Networks |
5% |
|
|
III. By Category of Activity and Region |
||
|
1. Conservation/Management Natural Resources |
13% |
|
|
|
SS Africa |
35% |
|
WANA |
19% |
|
|
Asia |
33% |
|
|
LAC |
13% |
|
|
2. Germplasm Enhancement/Breeding |
21% |
|
|
|
SS Africa |
39% |
|
WANA |
14% |
|
|
Asia |
29% |
|
|
LAC |
19% |
|
|
3. Production Systems Development/Management |
33% |
|
|
|
SSS Africa |
49% |
|
WANA |
11% |
|
|
Asia |
23% |
|
|
LAC |
17% |
|
|
4. Socio-econ./Public Policy/Public Management Research |
9% |
|
|
|
SS Africa |
46% |
|
WANA |
5% |
|
|
Asia |
41% |
|
|
LAC |
8% |
|
|
5. Institution Building |
24% |
|
|
|
SS Africa |
43% |
|
WANA |
9% |
|
|
Asia |
34% |
|
|
LAC |
13% |
|
By category of activity, about 13% of core resources were devoted to natural resources conservation and management (category 1), distributed evenly among its two components. Through research on crops and the other production sectors, 54% of the core resources were used for germplasm enhancement and breeding (category 2) -representing 22 % of total core resources - and for production systems development and management (category 3), which used 33% of all core resources. About 9% of core resources went to socioeconomic, public policy and public management research (category 4), and 24% to institution building (category 5); of the total of category 5, about 8% was used for organization and management counselling, and about one third of the remainder for institution building oriented networks.
In terms of regional distribution, 43 % of core resource were allocated to activities in Sub-saharan Africa, 29% to activities in Asia, and 13% and 15% respectively to activities in West Asia-North Africa and Latin America and Caribbean.
14.4.4.1. Categories of activity
14.4.4.2. Production sectors and commodities
14.4.4.3. Regional distribution
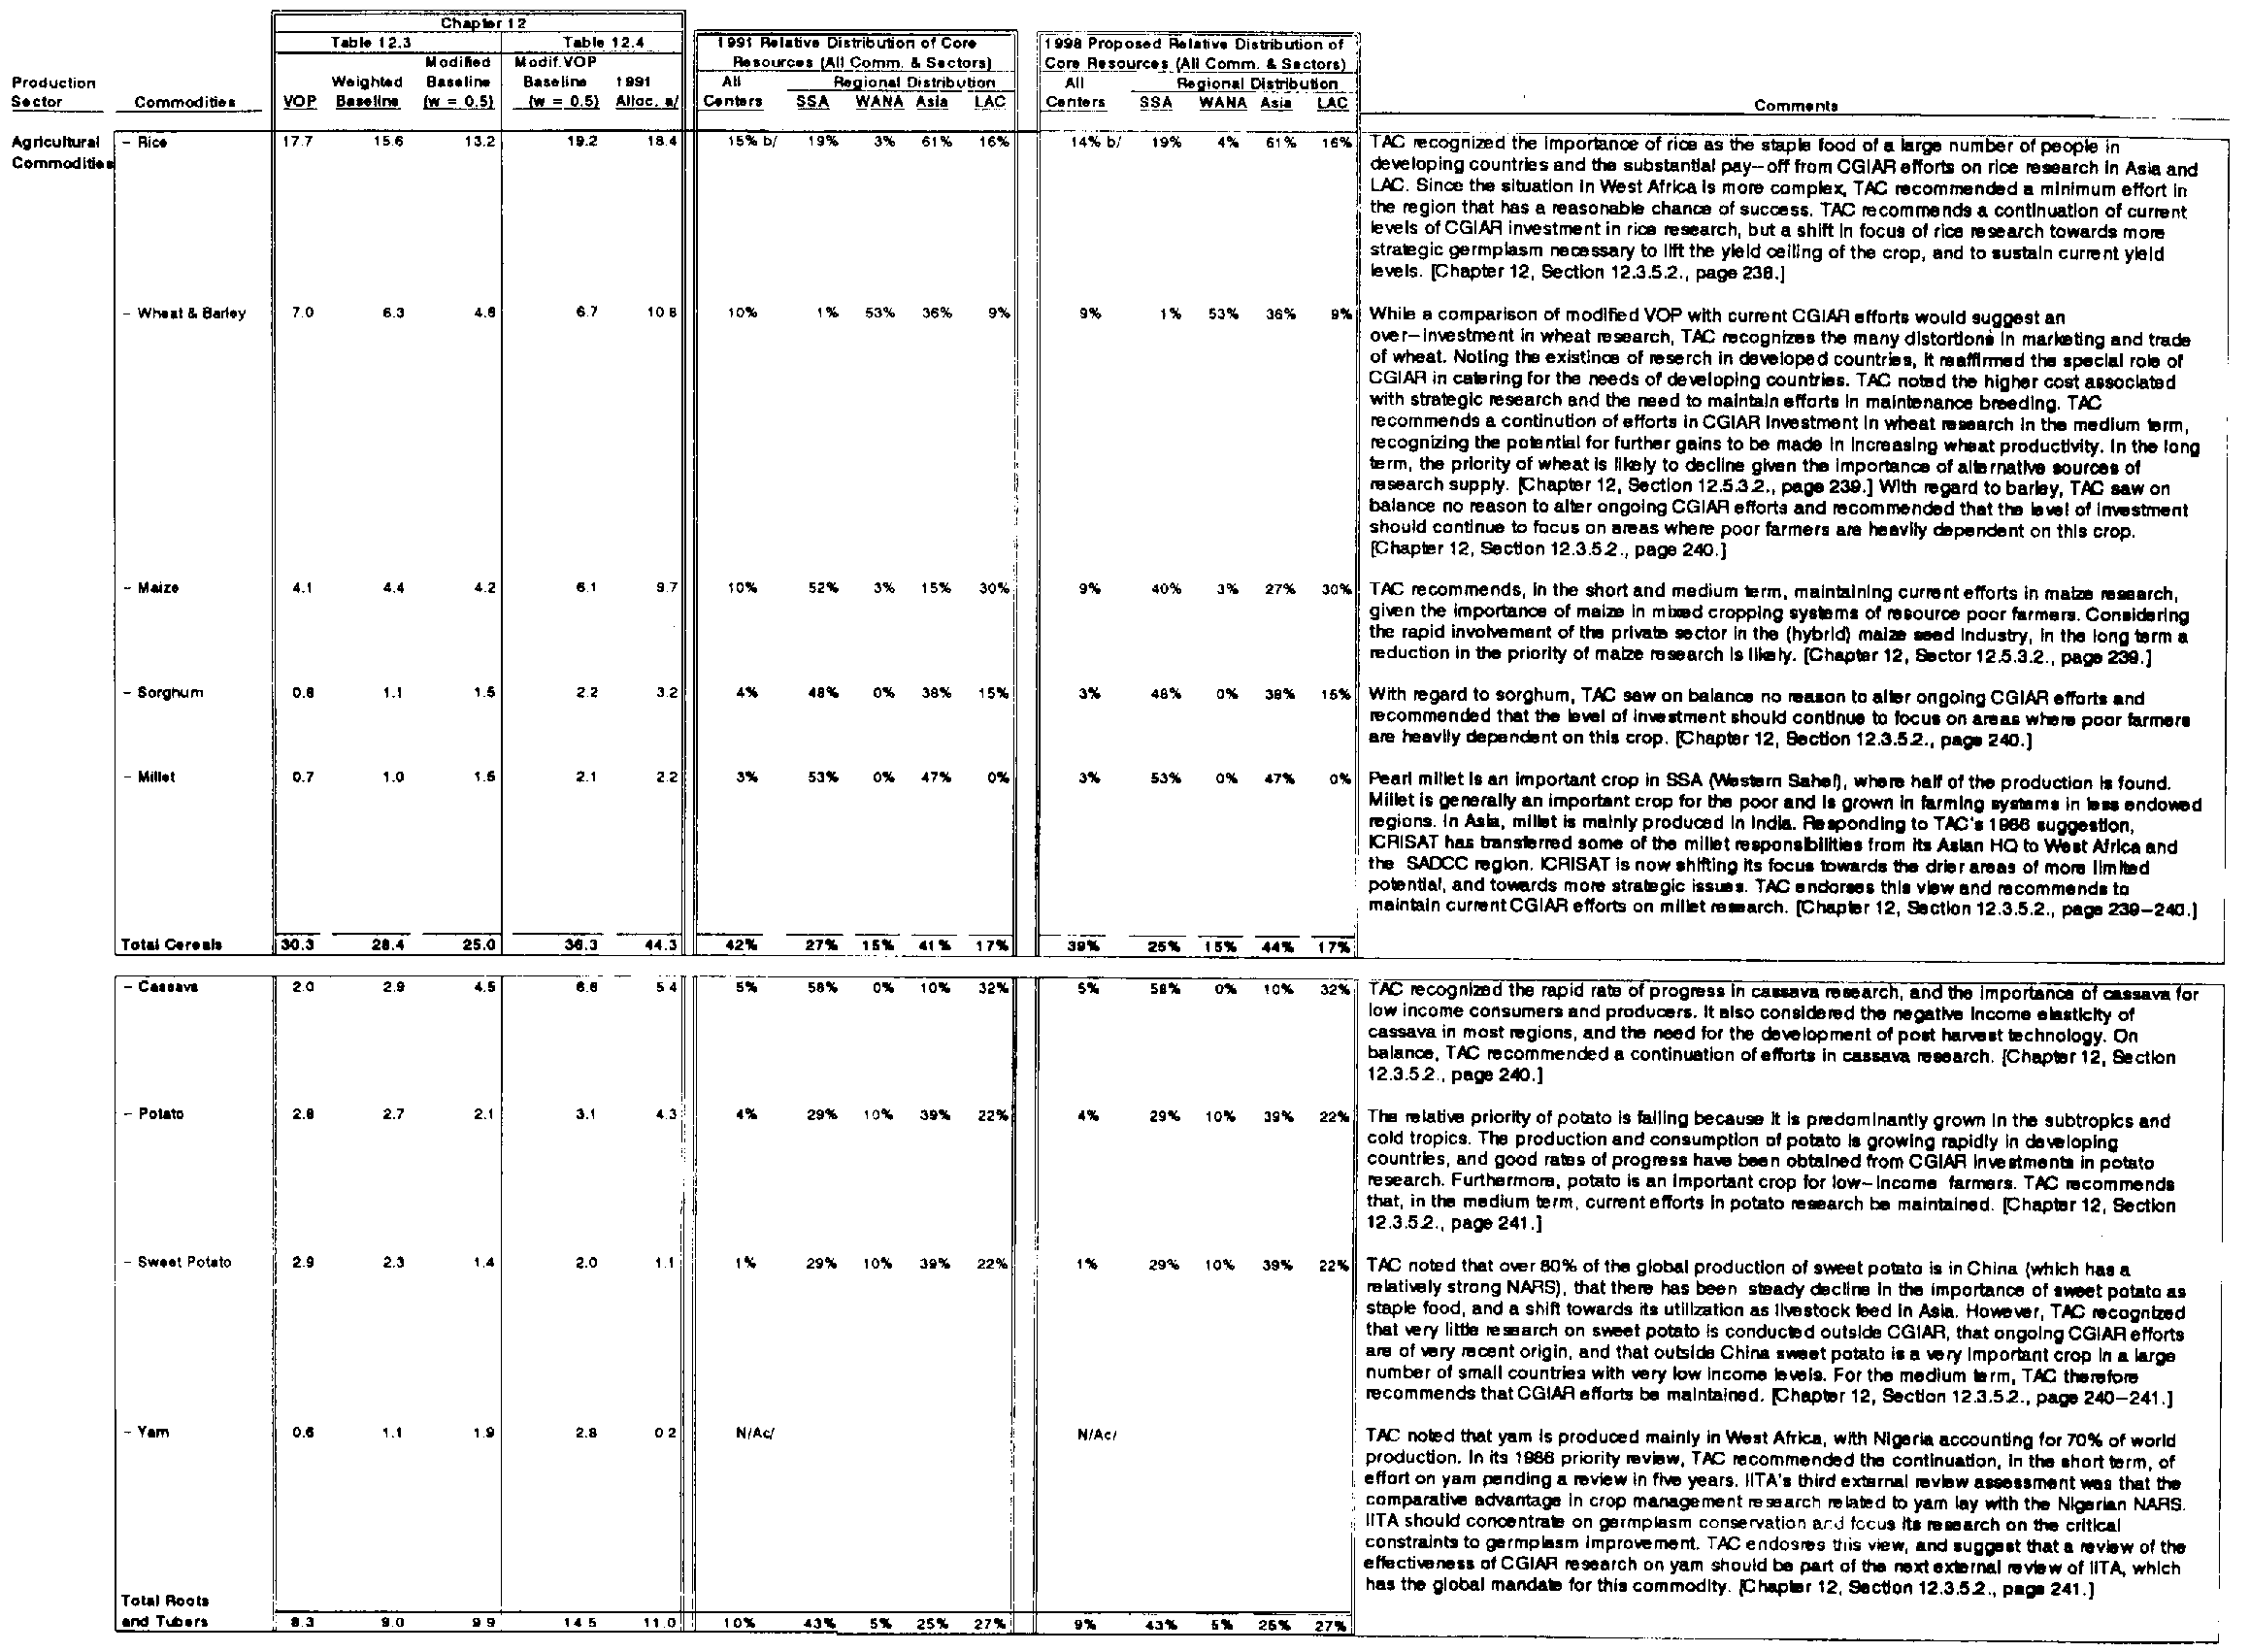
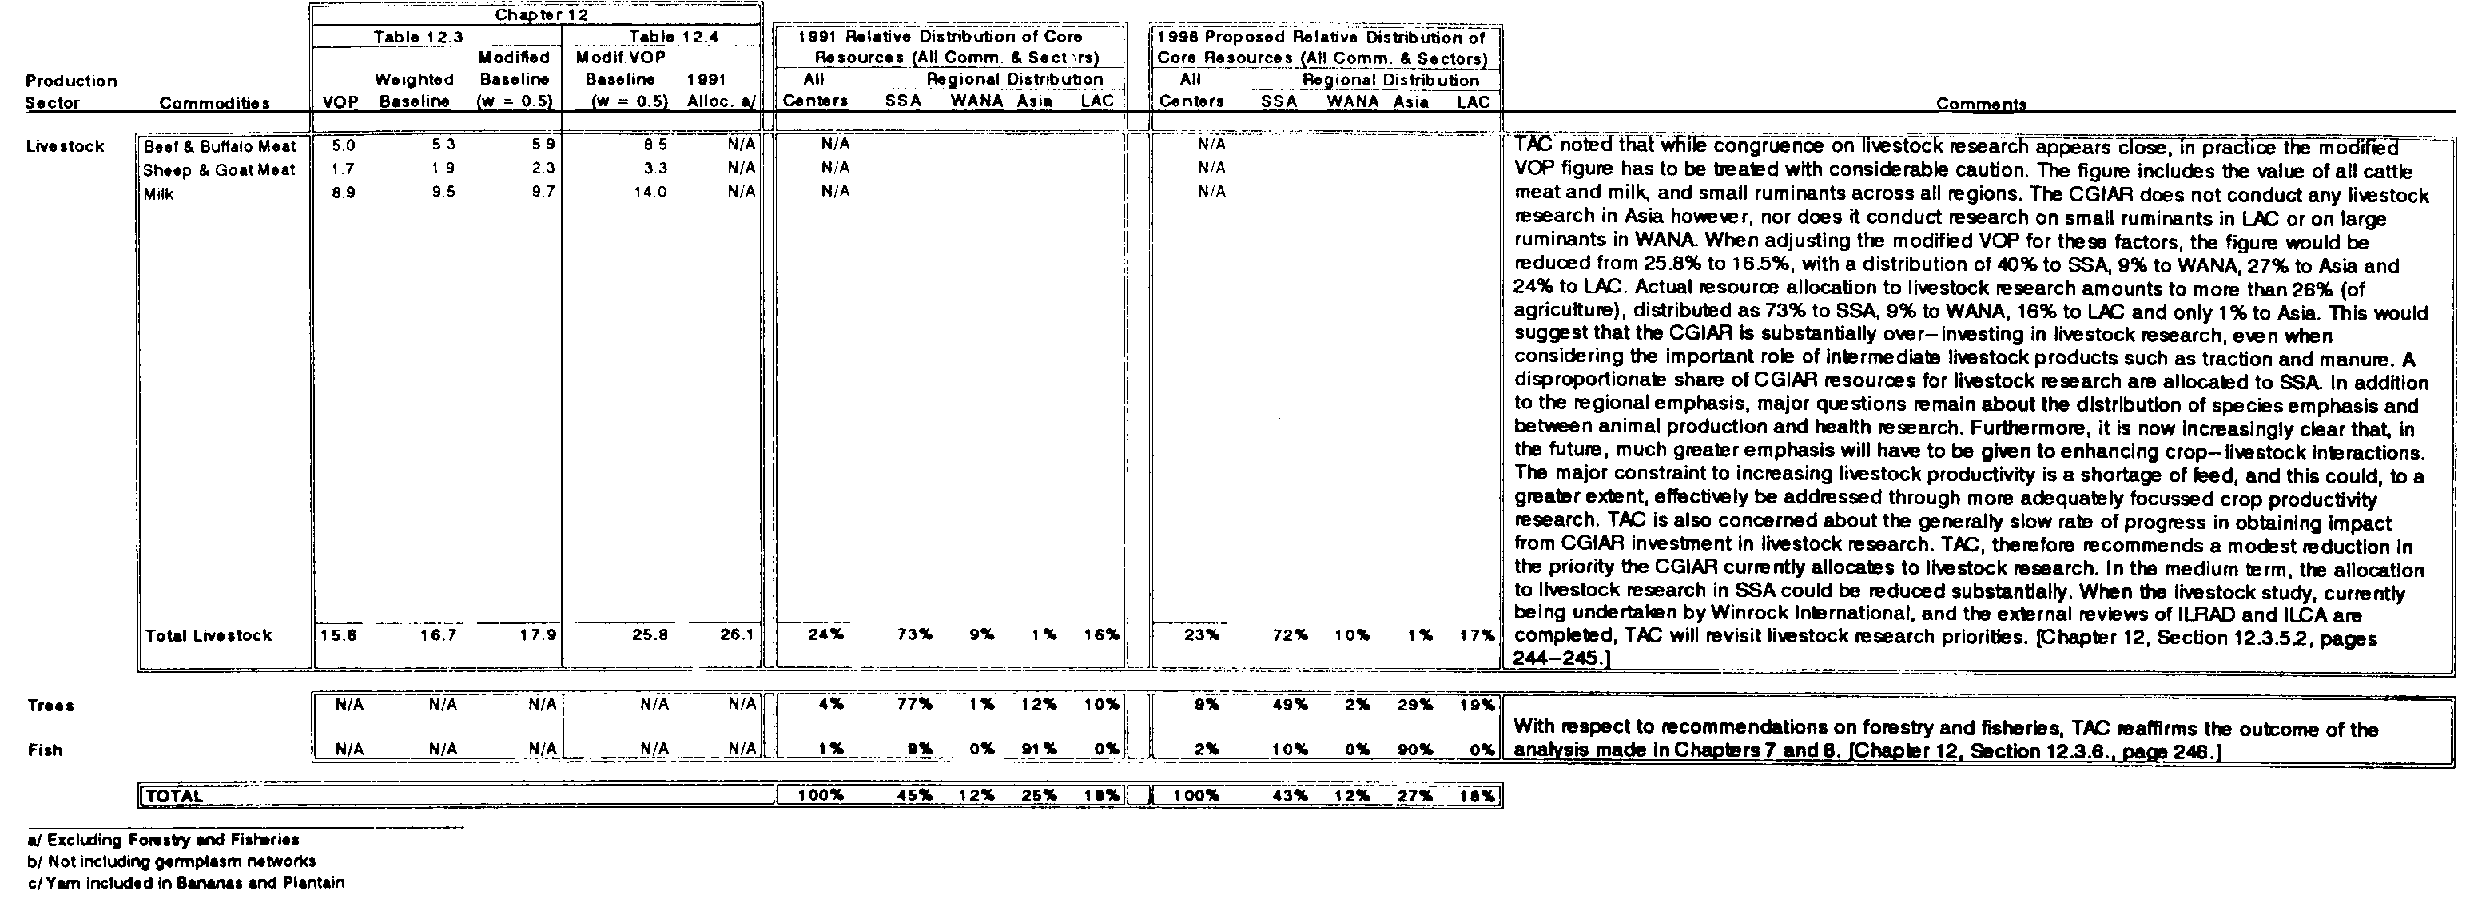
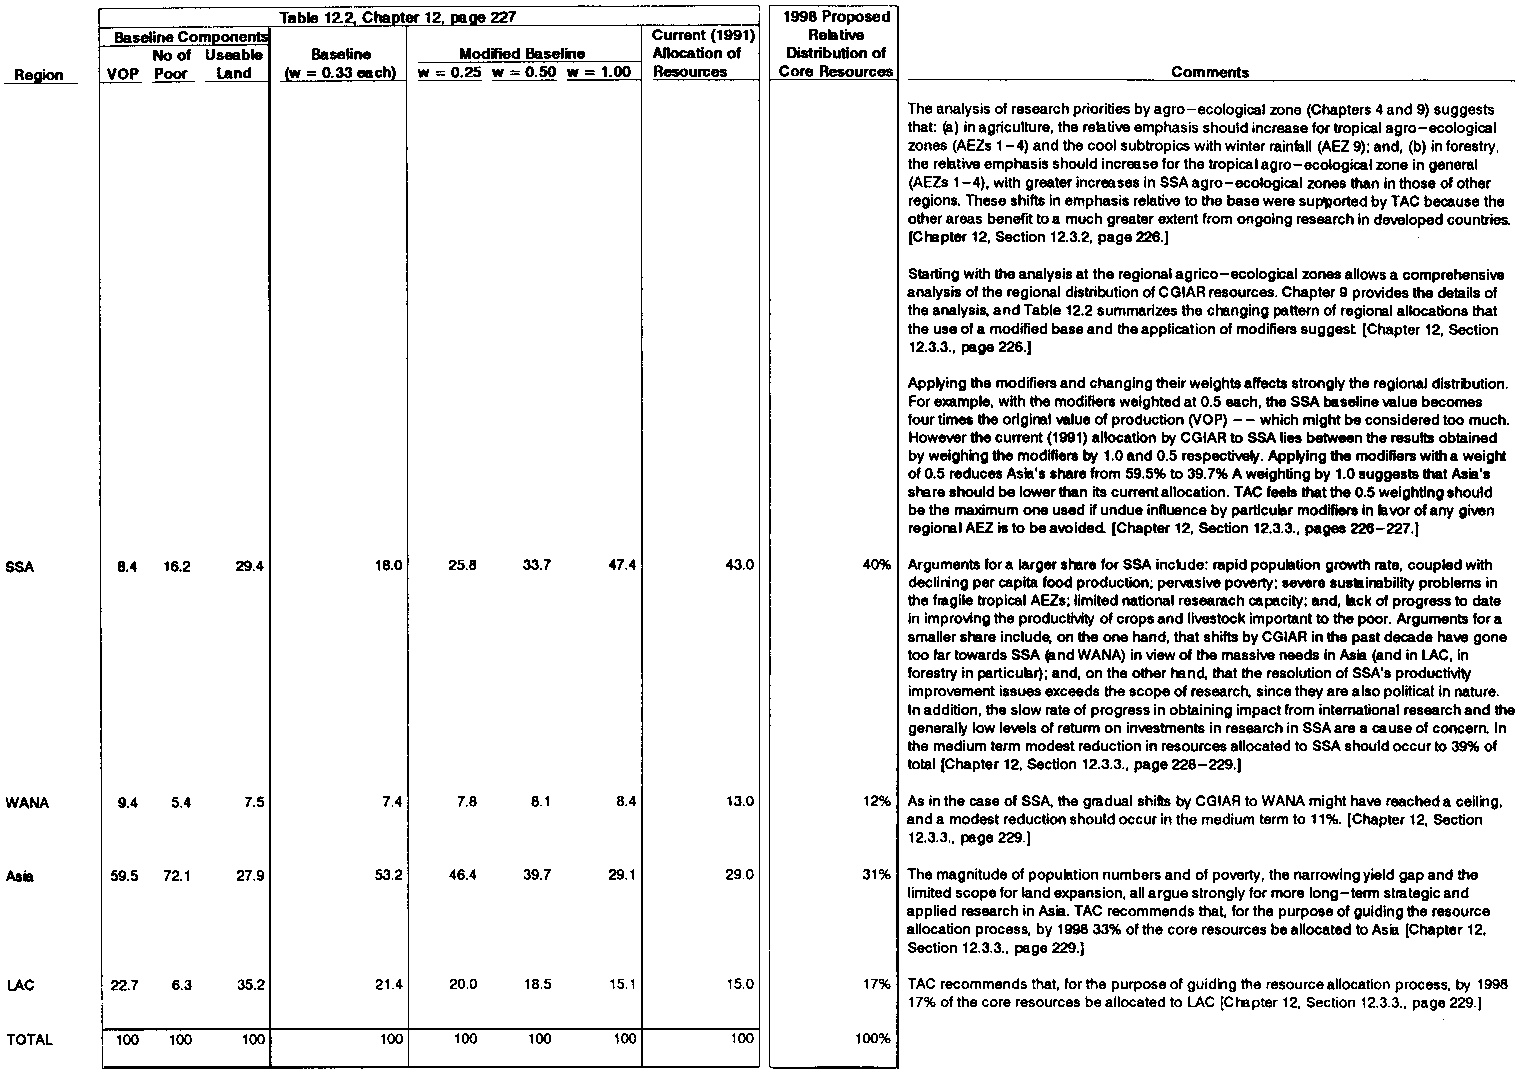
Tables 14.2A through C combine for each of the priority parameters (categories of activity, and commodities and production sectors, and regions) TAC's assessments on relative priorities for 2010 and the current (1991) relative distribution of core resources.
TAC's formulation of an intermediate, relative distribution for each of the priority parameters required a complex and iterative process. Iterations were necessary to assure a satisfactory degree of compatibility between the different priority parameters -which so far had been dealt with as independent variables - and to ensure the feasibility of the change in direction and the magnitude thereof from the centres' and the Group's point of view.
As Table 14.2A indicates, TAC's recommendations with regard to the 1998 distribution of core resources among the five categories of activity is consistent with its statements in Chapter 12.
Natural Resources Conservation and Management (category 1) is projected to increase significantly in both absolute and relative terms by 1998, rising from 13% of total in 1991 to 18% by 1998. All regions are expected to benefit from the increased efforts, but mostly LAC (from a low base) and least WANA.
Germplasm Enhancement and Breeding (category 2) is projected to increase marginally in absolute terms and in relative terms, from 21% in 1991 to 22% of total in 1998. The projected increase will mainly benefit Asia.
Production Systems Development and Management (category 3) is projected to decrease in absolute terms and in relative terms, with its share of total declining from 33% in 1991 to 29% in 1998. All four regions will experience a decrease in efforts in this category of activity but the decrease will be relatively more pronounced in the Asia region.
Socioeconomic, Public Policy and Public Management Research (category 4) is projected to increase to represent 11% of total by 1998, up from 9% in 1991. LAC and WANA are expected to be the principal beneficiaries at the expense of the remaining regions which in the past have benefited from a strong concentration of CGIAR efforts in this type of activity.
Institution Building (category 5) as a whole is projected to decrease in both absolute and relative terms, from 24% of total in 1991 to 20% in 1998. All four regions would be affected by the decrease but in varying degrees: SSA and LAC less than average, while Asia and WANA more or close to the average. The reduction is projected in three components of this category (training, information and documentation, and institution-building oriented networks), while organization and management counselling (category 5.3) is projected to increase significantly over 1991 levels, benefiting all four regions.
Table 14.2.A: TAC's Decision Rules - - Relative Allocation by Category of Activity (in Percentages)
The combined outcome of the relative allocations to categories 2 and 3 is a result of recommendations made by TAC for the different commodities and production sectors.
TAC considered that there was no compelling rationale for changing the existing distribution between the four production sectors. On the other hand, TAC firmly believes that the System's expansion in forestry and fisheries should not be funded at the expense of agricultural crops and livestock.
As shown in Table 14.2B, assuming incremental core funding for forestry and fisheries doubles the relative allocations to these sectors by 1998 over the comparable 1991 level. Under that assumption, the 1998 proposed allocations for agricultural crops and livestock drop in relative terms to 66% and 23% respectively; these levels are however identical to the 1991 comparable levels of 70% and 24%, when the increment for forestry and fisheries is excluded.
It should be noted, however, that TAC's decision to reduce the relative share of the combined categories 2 and 3 resulted in reducing the global allocation available for commodities and production sectors; thus the maintenance of shares of each of the sectors actually represents a decline in absolute terms compared to 1991 levels.
Within the agricultural crops, while generally recommending a shift of efforts from production systems research (category 3) to germplasm enhancement and breeding (category 2) no major changes are proposed in the relative share of most crops compared with 1991. The cereals maintain their relative share, with a marginal shift from SSA towards Asia. The roots and tubers maintain their relative share as well as the regional distribution. The food legumes, as a group, decline as a relative share, and a shift occurs from Asia and LAC towards SSA and WANA; this results from reductions in emphasis in phaseolus bean and pigeonpea research, while soybean and groundnut research would receive greater attention.
Table 14.2.C: TAC's Decision Rules - - Relative Allocation by Region (in percentages) - cont.
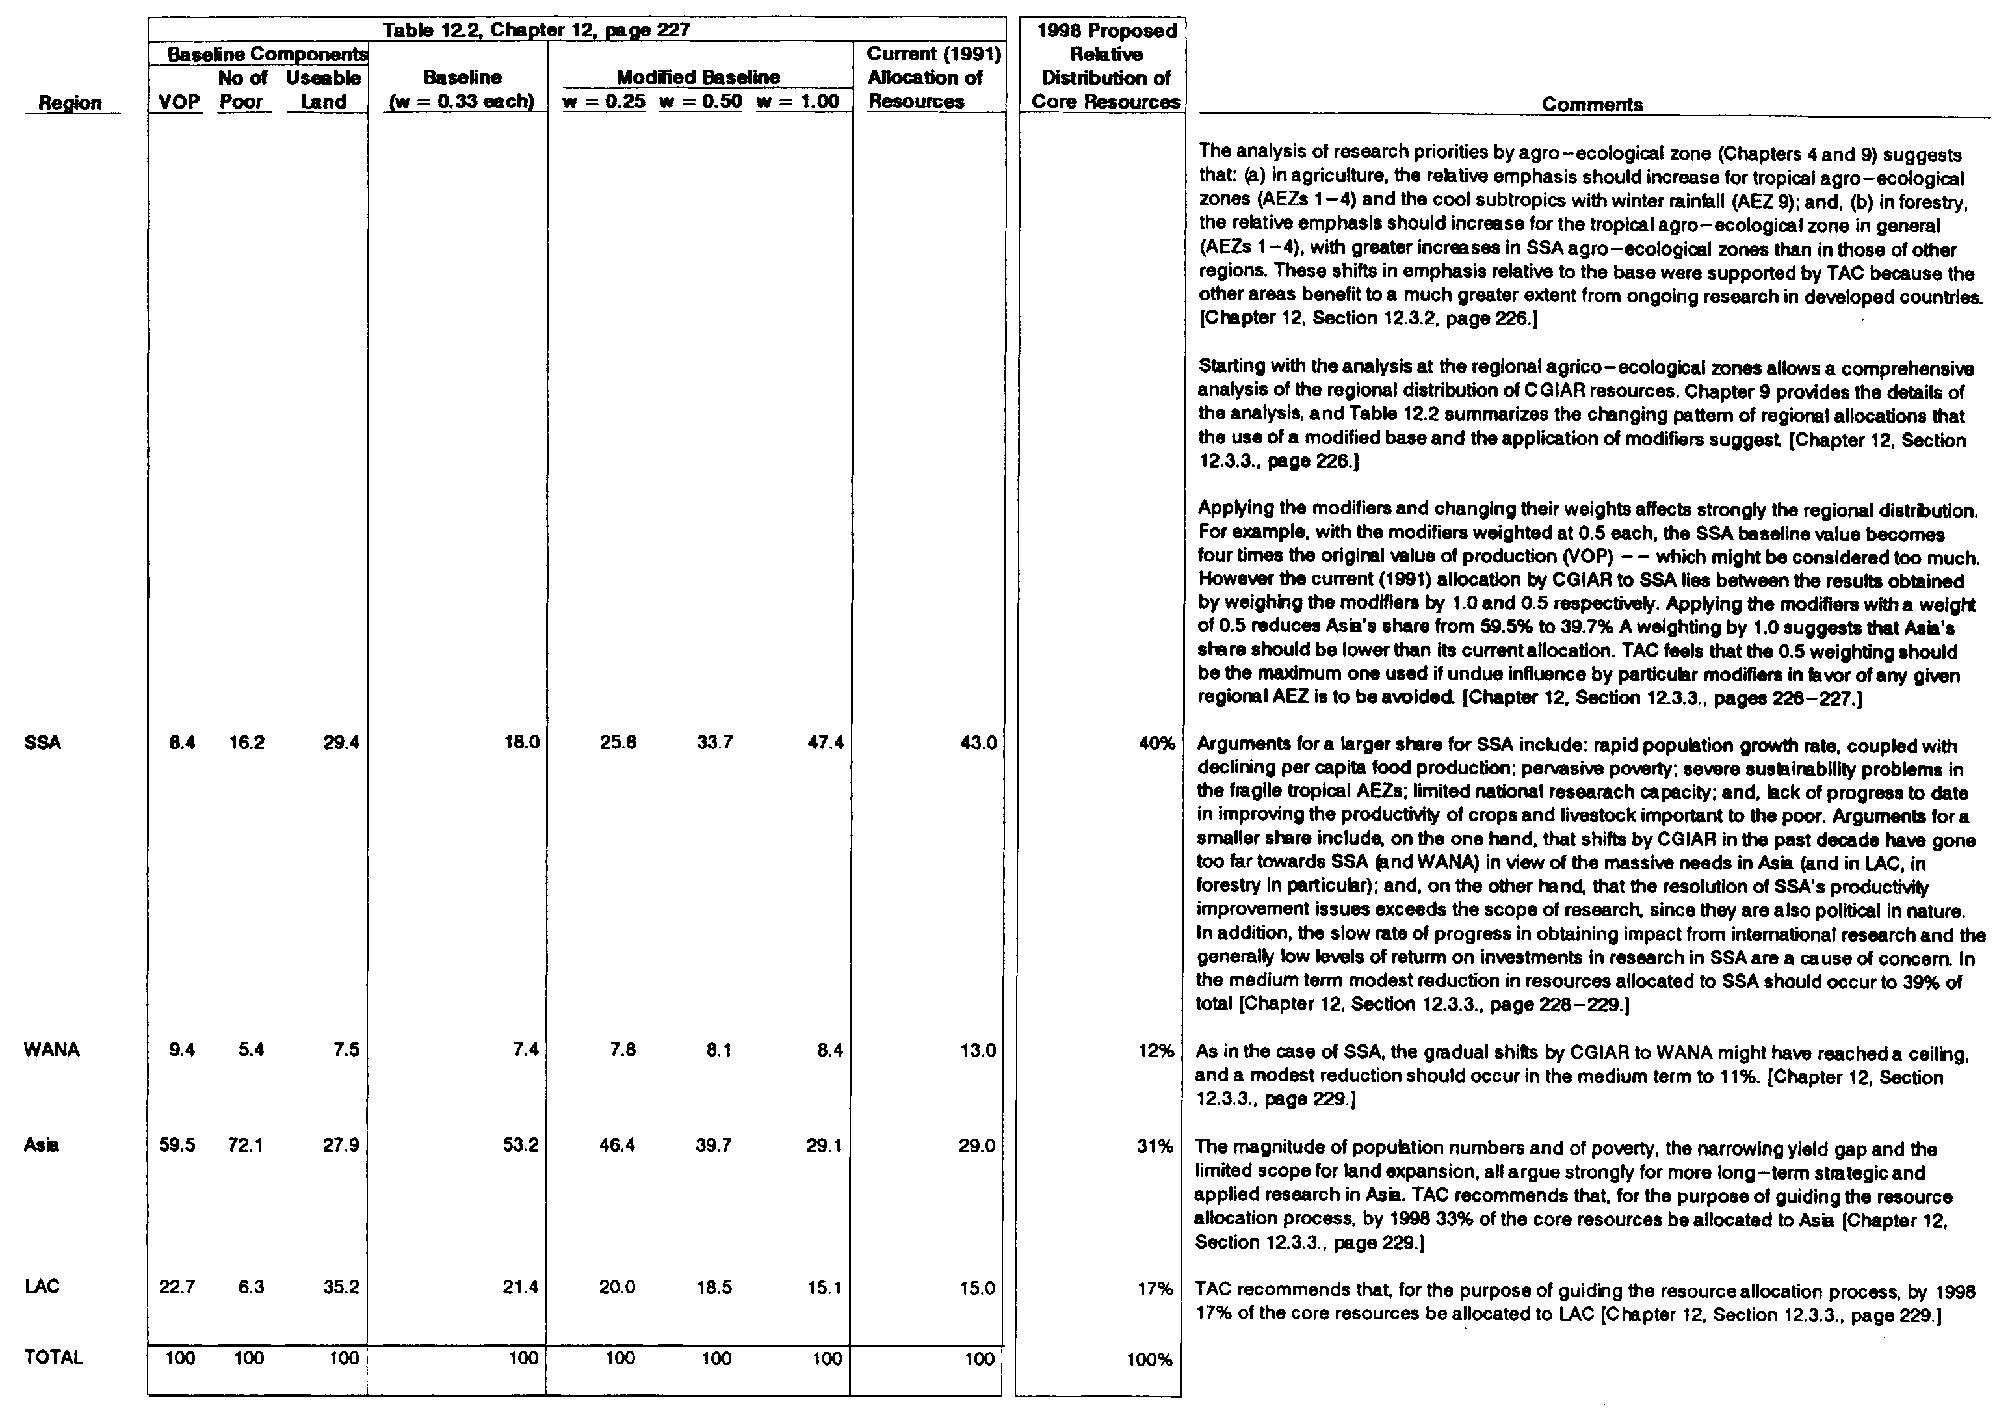
TAC's allocation decisions on categories of activity (and their regional distribution) and on the commodities and production sectors resulted in a regional distribution for 1998 which - as indicated in Table 14.2C - is quite close to the regional targets set for 1998, i.e. 40% to SSA compared to 39%, 12% to WANA compared with 11%, 31% to Asia compared with 33%, and 17% to LAC i.e. the target set for 1998.
The objective of the medium-term resource allocation process is to ensure the implementation of the agreed core priorities of the CGIAR, expressed in several dimensions, in a coherent way by autonomous CGIAR Centres supported by donors acting individually. In order to ensure realism in the forward core planning by centres, and thus the relevance of the MTPs throughout the planning period, core operating resources need to be confined within the boundaries set by realistic estimates of core funding that will be made available to the System. Though, as indicated earlier, complementary programmes are being treated as financially unconstrained, they are expected to be broadly consistent with the general direction of the core priorities.
The principles upon which the resource allocation process has been constructed are:
(a) transparency, i.e. the rationale of the centre allocation recommendations can be related to the recommendations on System priorities as recommended by TAC and which will be discussed and reviewed by the Group;(b) constraining, i.e., centres are asked to prepare MTP proposals which conform with the indicative core resource envelopes recommended by TAC; however, centres will have a reasonable margin of flexibility since they are also requested to present alternative proposals at 10% above and. below the level of the core resource envelope. Centres in exceptional circumstances could present proposals in excess of this margin for consideration by TAC and the Group;
(c) interactive, i.e. starting from a centralized indicative planning allocation which will be discussed by the Group, centres will construct their MTP proposals, and will present them to both TAC and the Group; subsequently, TAC will need to reconcile the MTP proposals both in substance - i.e. the convergence of the sum total of centres' medium-term programme proposals with the System priorities - and financially - i.e. the compatibility between the sum total of centres' proposed funding requirements and the core funding assumption used for the System as a whole.
The format of the centre resource allocation recommended by TAC is that of a centre specific, indicative envelope of core funding for 1998. The envelopes will serve as planning assumptions for centres to prepare their MTPs for review by TAC and by the Group.
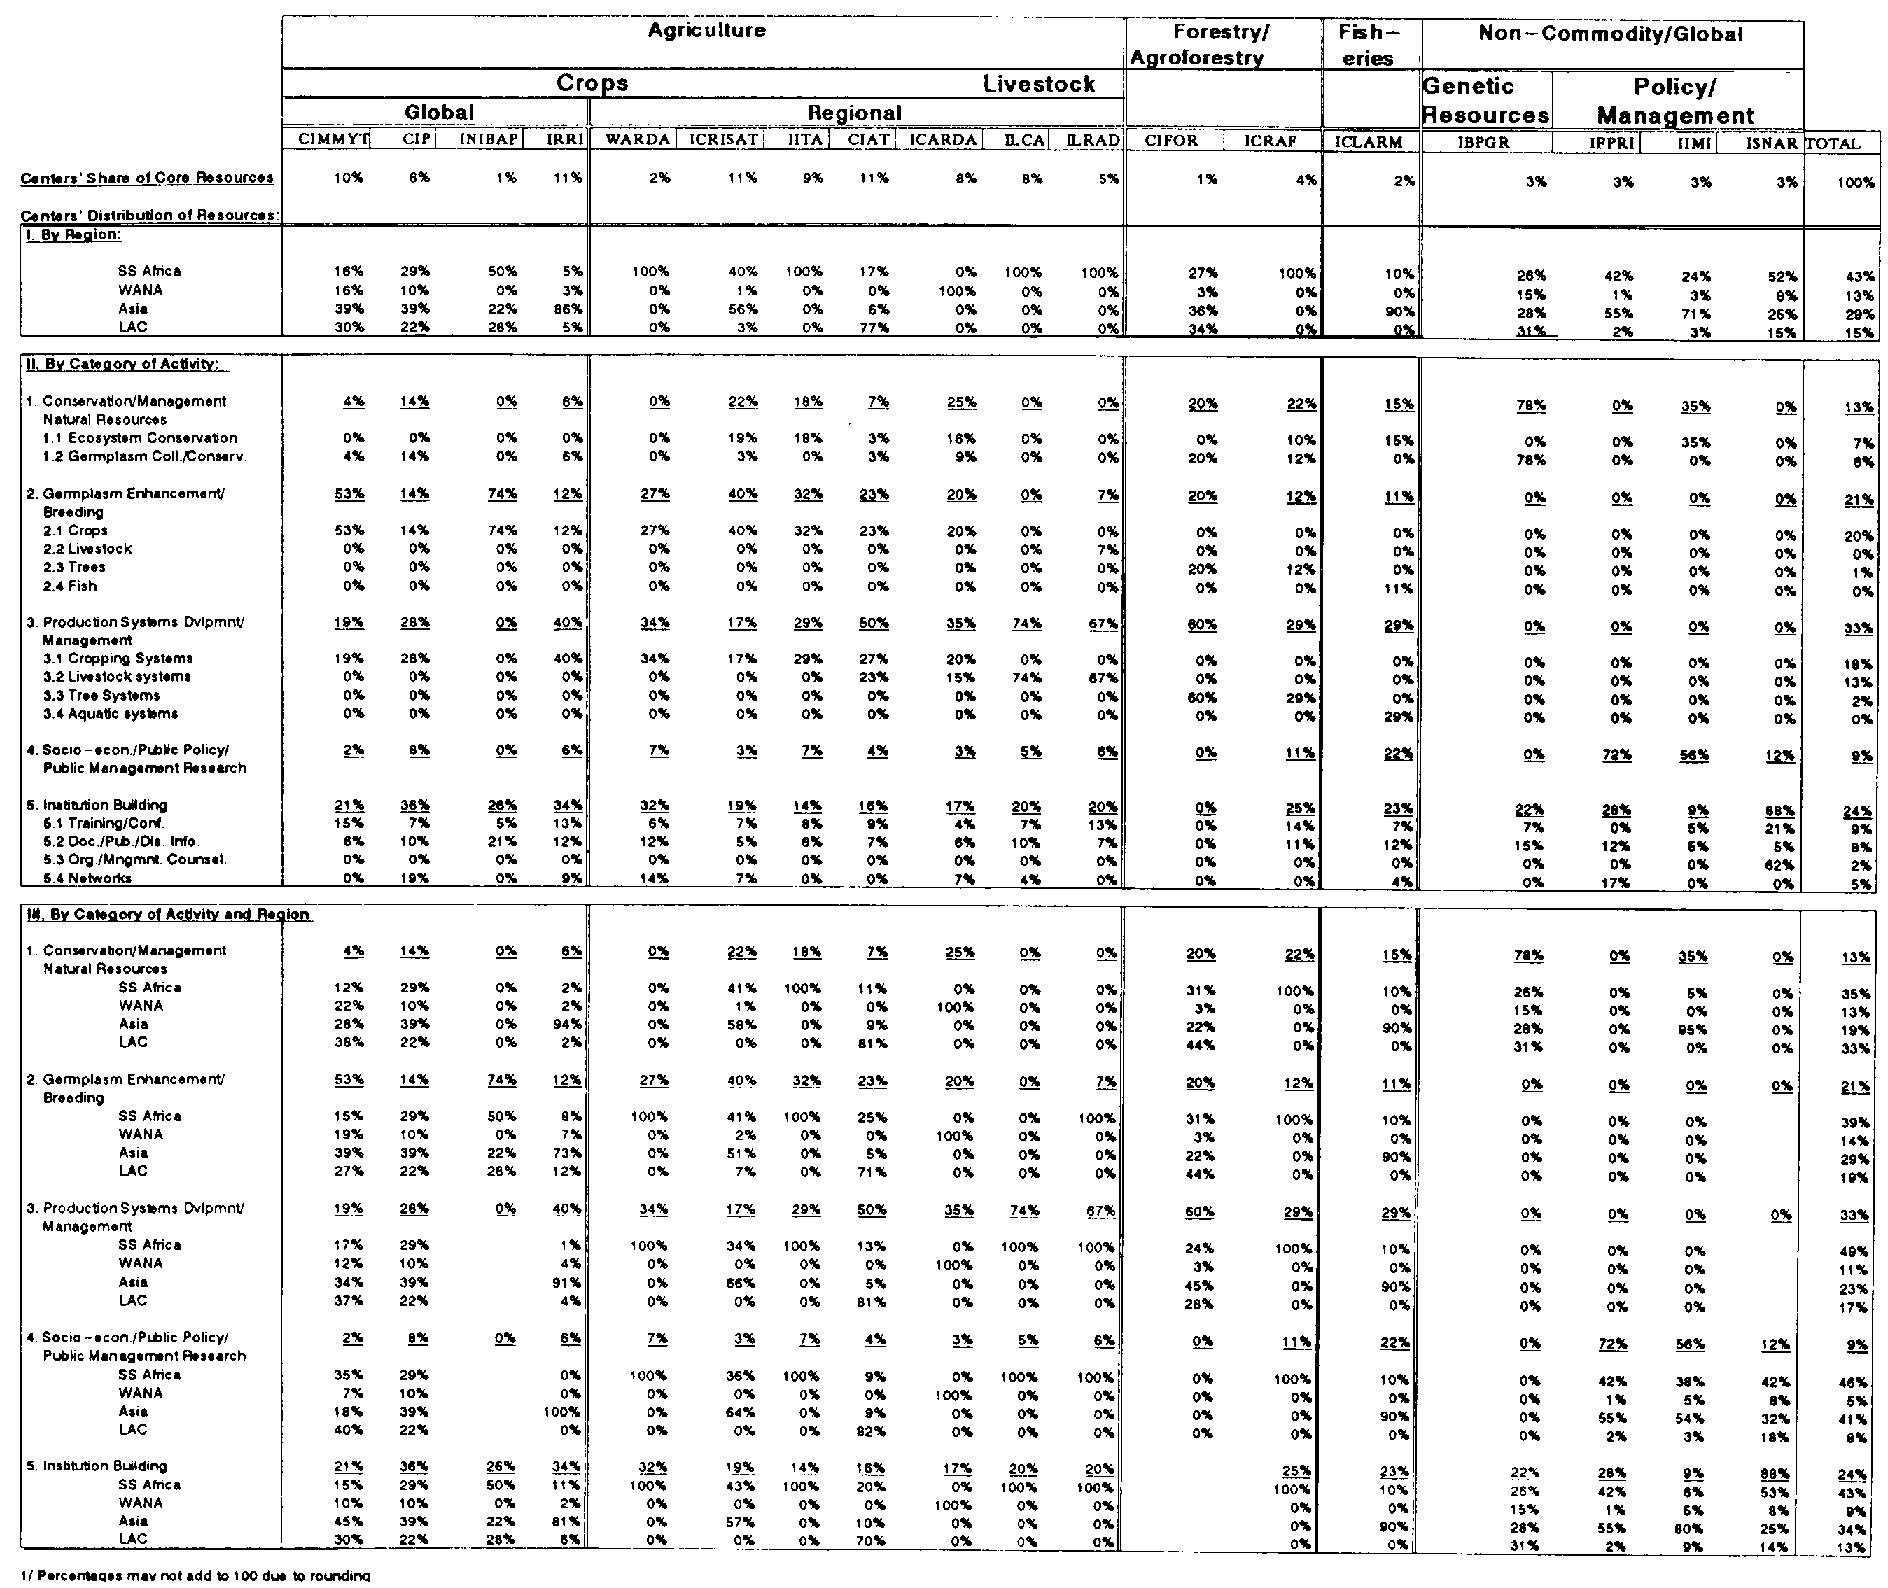
The decision to retain the evolutionary option rather than the construction of an "ideal" model, as described in Section 14.3.1 above, required the use 1991 data as a starting point for the resource allocation exercise. To that effect, centres' 1991 core programme and operating expense data were mapped in accordance with the activity structure and regional definitions used by TAC in the priority exercise. The initial mapping by the CGIAR Secretariat was reviewed and updated by the centres. The product of this exercise is shown in Table 14.3, which indicates for each centre the relative distribution of 1991 core operating resources among activities and regions. The consolidation of centre data at the System level is shown in Table 14.1.
The basic task is to chart the evolution from the actual situation in 1991 towards 2010 goals. The first step was to identify targets for 1998. TAC was assisted in its decision making by a financial spreadsheet. The spreadsheet used 1991 centre and System data as a starting point. These data were adjusted by applying weighting factors to 1991 data regarding activities, and proportional distributions to regions, commodities and production sectors. This was done in an iterative fashion, allowing TAC to consider the impact of the modifications it had introduced, alter modifications to obtain the desired outcome, and consider alternative scenarios and their impact. Thus TAC defined and refined, in an iterative way, the medium-term resource targets for each of its priority parameters. The spreadsheet provided the mechanical translation of the System-level priority choices to centre allocations. This facilitated TAC's consideration of individual centre resource envelopes, taking into account other factors such as need for minimum critical mass, stage of maturity and recent developments of centres' programmes, and relevant information on strategic plans as well as on programme and management reviews.
A key feature of the medium-term core resource allocation process is to ensure that the sum of the 1998 core funding requirements of all centres' MTPs remains within reasonable limits of expected core funding for that year. As indicated above (Section 14.3.3), a number of assumptions with regard to future core supply were considered. However, consistent with donor indications so far, the assumption that generally maintains the 1992 CGIAR core funding in real terms with the possible exception of new activities recently integrated in the CGIAR (i.e. fisheries and forestry) was chosen.
Therefore, the estimated 1998 core funding assumed by TAC in the resource allocation exercise amounts to US$ 270 million in 1992 values - or US$ 342 million in 1998 values, assuming a 4% annual rate of inflation. While this level assumes a mere maintenance of the value of 1992 core funding for most activities, it assumes for 1998 a near doubling of the funding of forestry activities provided in 1992. At ICW'91, 1992 core funding was estimated at US$ 251 million, including about US$ 14 million for forestry activities, but excluding US$ 4 million of funding of fishery activities. This amount augmented by US$ 5 million for fishery activities (up from US$ 4 million in 1992) and an additional US$ 14 million for forestry produces a US$ 270 million estimate for 1998. The implication is that, with the exception of forestry and fisheries, the current core funding would need to be redeployed over a different portfolio of activities.
Table 14.3. Centres' Estimated 1991 Core Resources Distribution (in %) 1/
This funding assumption may be considered too conservative. It should not be seen as an indication by TAC that the current level of resources is adequate to fully meet the challenges and tasks faced by the centres. It is a conservative approach at this stage of the planning process to ensure that the System has the opportunity to explore the operational implications of zero real growth. In order that this assumption is not counterproductive for centres by not providing them the opportunity to demonstrate their full potentials at higher levels of resource supply, the resource allocation process provides two mitigating mechanisms: one is that centres will be requested to explore in their MTPs what the impact would be on their programmes of higher than assumed core funding; the second being the mechanism of yearly adjustment of funding requirements which will distribute actual core supply to centres in function of their share of the total as determined by the medium term resource allocation process.
14.8.1. System Resource Allocations
14.8.2. Linking System Allocations to Centre Allocations
14.8.3. Centre Resource Allocations
14.8.4. Specific Factors Affecting Individual Centre Allocations
14.8.5. Financial Factors Relevant to the Interpretation of the Centre Envelopes
As implied by the previous discussion, TAC formulated recommendations with regard to the 1998 allocation of core operating resource at two levels: at the System level first and, subsequently, at the centre level.
14.8.1.1. Global outcome
14.8.1.2. Regional portfolio of CGIAR investments
The relative distribution resulting from linking priorities to a global, hypothetical resource envelope as indicated in Tables 14.2A to C needed to be converted in absolute dollar core funding amounts. As explained in the previous section, the core funding for 1998 has been estimated at US$ 270 million (in 1992 values); this amount assumes 1998 core funding at the 1992 level (US$ 251 million), augmented by US$ 4 million of ICLARM 1992 core funding, and by US$ 15 million of incremental core funding in 1998 for forestry and fisheries.
Table 14.4 shows the translation of the relative resource distribution (Tables 14.2A to C) into 1998 core funding values of US$ 270 million and the indicative allocation of that amount to the categories of activity, the commodities and production sectors, and the regions.
Table 14.4 provides also an insight into the composition of the regional research portfolios.
In SSA, 55% of the core resources would be allocated to germplasm enhancement and breeding (category 2) and production systems (category 3) research. This ratio is higher than the System average of 51%, and is related to the relatively lesser allocation in SSA to natural resources (category 1) research and to socioeconomic, public policy and public management research (category 4). The recommended level in category 5 (institution building) is near the System level target. Within the consolidated allocation to categories 2 and 3, research on agricultural crops represent 51% of total, which is well below the system average (66%) and reflects the high share allocated to livestock (38%) and forestry (11%) research in the region. Among the agricultural crops, cereals rank first (22% of total), followed by food legumes (14%), roots and tubers (10%) and banana, plantain and yam (5%).
Table 14.4 1998 Proposed System Core Allocation by Category of Activity, by Region, by Production Sector and Commodity (in constant 1992$ millions and percentages) 1/
|
Categories of Activity |
1998 Proposed Allocation |
Relative Distribution of Categories' Allocations by Region |
||||||
|
|
|
SS Africa |
WANA |
Asia |
LAC |
Total |
||
|
1. Conservation & Management of Natural Resources |
48.6 |
15% |
23% |
19% |
21% |
18% |
||
|
|
1.1 Ecosystem conserv./mngmnt. |
27.0 |
10% |
10% |
10% |
11% |
10% |
|
|
1.2. Germplasm coll./conserv./char./eval. |
21.6 |
5% |
13% |
9% |
10% |
8% |
||
|
2. Germplasm Enhancement & Breeding |
60.0 |
20% |
24% |
23% |
23% |
22% |
||
|
|
2.1 Crops |
53.2 |
17% |
24% |
21% |
21% |
20% |
|
|
2.2 Livestock |
1.3 |
1% |
0% |
0% |
0% |
0% |
||
|
2.3 Trees |
4.7 |
2% |
0% |
2% |
2% |
2% |
||
|
2.4 Fish |
0.8 |
0% |
0% |
1% |
0% |
0% |
||
|
3. Production Systems Development & Management |
79.1 |
35% |
28% |
23% |
30% |
29% |
||
|
|
3.1 Cropping Systems |
38.5 |
11% |
17% |
17% |
14% |
14% |
|
|
3.2 Livestock systems |
30.5 |
20% |
10% |
0% |
12% |
11% |
||
|
3.3 Tree systems |
8.3 |
4% |
1% |
3% |
3% |
3% |
||
|
3.4 Aquatic systems |
1.8 |
0% |
0% |
2% |
0% |
1% |
||
|
4. Socio-Economic, Public Policy, & Public Management Research |
29.6 |
9% |
9% |
14% |
10% |
11% |
||
|
5. Institution Building |
52.7 |
21% |
15% |
21% |
17% |
20% |
||
|
|
5.1 Training/Conferences |
19.5 |
8% |
6% |
7% |
6% |
7% |
|
|
5.2 Doc./Pub./Dis. Info. |
16.9 |
7% |
4% |
7% |
5% |
6% |
||
|
5.3 Org./Mngmnt. Counselling |
6.2 |
3% |
2% |
2% |
2% |
2% |
||
|
5.4 Networks |
10.1 |
3% |
3% |
5% |
3% |
4% |
||
|
System Total |
270.0 |
|
|
|
|
|
||
|
Regional Distribution: |
US dollar millions |
|
109.3 |
31.1 |
82.5 |
47.1 |
270.0 |
|
|
Percentage |
|
40% |
12% |
31% |
17% |
|
||
|
Production Sector/Commodity Aggregation of categories 2 and 3) |
1998 Proposed Allocation 2/ |
Relative Distribution of Sectors and Commodities' Allocations by Region |
|||||
|
SS Africa |
WANA |
Asia |
LAC |
Total |
|||
|
Cereals |
|
|
|
|
|
|
|
|
Rice |
19.8 |
6% |
5% |
32% |
13% |
14% |
|
|
Wheat/Barley |
13.2 |
0% |
43% |
13% |
5% |
9% |
|
|
Maize |
13.2 |
9% |
3% |
9% |
16% |
9% |
|
|
Sorghum |
4.6 |
4% |
0% |
5% |
3% |
3% |
|
|
Millet |
3.8 |
3% |
0% |
5% |
0% |
3% |
|
|
Cereals Subtotal: |
54.5 |
22% |
51% |
63% |
36% |
39% |
|
|
Roots & Tubers |
|
|
|
|
|
|
|
|
Cassava |
6.5 |
6% |
0% |
2% |
8% |
5% |
|
|
Potato |
5.3 |
3% |
3% |
5% |
5% |
4% |
|
|
Sweet Potato |
1.3 |
1% |
1% |
1% |
1% |
1% |
|
|
Roots & Tubers Subtotal: |
13.2 |
10% |
4% |
9% |
14% |
9% |
|
|
Food Legumes |
|
|
|
|
|
|
|
|
Phaseolus Bean |
5.7 |
3% |
0% |
0% |
15% |
4% |
|
|
Faba bean/Lentil |
2.5 |
0% |
16% |
0% |
0% |
2% |
|
|
Chickpea |
2.6 |
0% |
8% |
4% |
0% |
2% |
|
|
Cowpea/Soy beans |
5.4 |
9% |
0% |
0% |
0% |
4% |
|
|
Groundnut |
3.3 |
2% |
0% |
5% |
0% |
2% |
|
|
Pigeonpea |
0.8 |
0% |
0% |
2% |
0% |
1% |
|
|
Food Legumes Subtotal: |
20-3 |
14% |
24% |
11% |
15% |
15% |
|
|
Banana & Plantain |
|
|
|
|
|
|
|
|
Banana/Plantain/Yam |
3.6 |
5% |
0% |
1% |
2% |
3% |
|
|
TOTAL AGRICULTURAL CROPS |
91.7 |
51% |
79% |
83% |
68% |
66% |
|
|
LIVESTOCK |
31.8 |
38% |
19% |
1% |
22% |
23% |
|
|
FISH |
2.6 |
0% |
0% |
6% |
0% |
2% |
|
|
TREES |
13.0 |
11% |
2% |
10% |
10% |
9% |
|
|
TOTAL |
139.2 |
100% |
100% |
100% |
100% |
100% |
|
1/Totals may not add due to rounding.
2/Sum of Categories 2 and 3
In WANA, 52% of total resources would be allocated to categories 2 and 3 combined, slightly higher than the system average; category 1 (natural resources) would be allocated 23% of the resources, i.e. well above the System average (18%). In the two remaining categories, WANA's proposed allocations are below System averages. Within the global allocation to categories 2 and 3, agricultural crop research accounts for 79% of the resources (compared with 66% as System average), livestock for 19% (23% System average), and forestry for the remaining 2%. Among the agricultural crops, cereals account for 64% of total, 84% of which is allocated to wheat and barley; food legumes follow with 24%, two thirds of which is allocated to faba bean and lentil research; and roots and tubers represent a modest 5% of the regional total.
In Asia, only 46% of total resources would be allocated to categories 2 and 3, with all three other categories (and particularly category 5, Institution Building) receiving higher than System average allocations. Within the global allocation to categories 2 and 3, 83% of the resources would be allocated to agricultural crop research, i.e. well above the System average; this reflects the low share of livestock research (1%), while fisheries (6%) and forestry (10%) are still at modest levels but above the System averages. Among agricultural crops, cereals account for about 75%, half of which is devoted to rice; food legumes are a distant second with 11%, in part as a consequence of the proposed reduction in pigeonpea research not fully compensated for by the increase in groundnut research; and, roots and tubers represent 11% of total, i.e. at the System average.
In LAC, 53% of total resources would be allocated to categories 2 and 3 combined, slightly higher than the System average; category 1 (natural resources) is proposed at 21% of the resources, and is well above the System average (18%). While category 4 (Socioeconomic, public policy, public management research) is at the System average level of 14%, category 5 (institution building) represents a relatively modest 17%. Within the global allocation to categories 2 and 3, agricultural crop research accounts for 68% of the resources (compared with 66% as the System average), livestock for 22% (23% System average), and forestry for the remaining 10%. Among the agricultural crops, cereals account for 55% of total, 80% of which is allocated to maize and rice; food legumes follow with 22%, all of which relates to phaseolus bean research at a reduced level as recommended by TAC; and, roots and tubers represent 21% of the regional total.
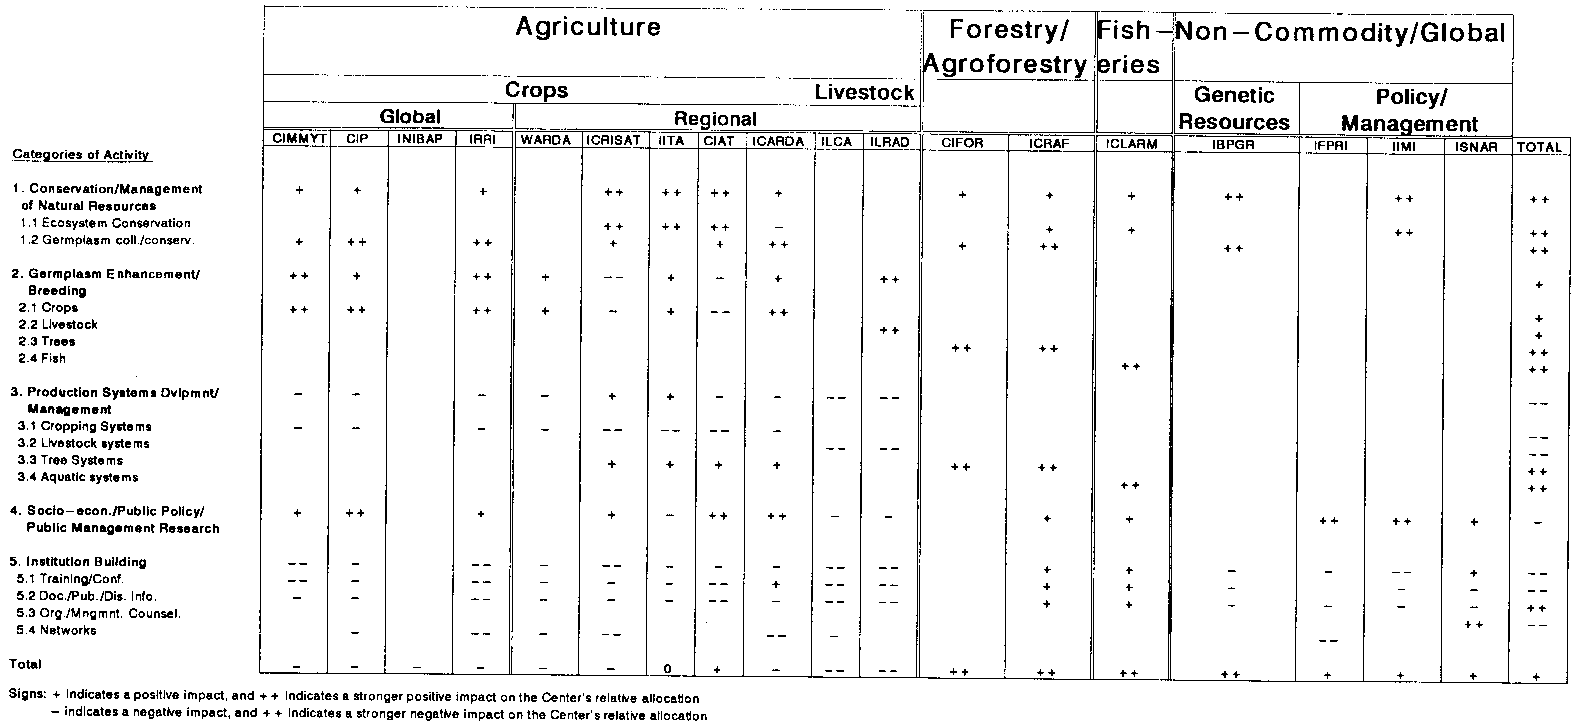
Once TAC had reached consensus on the System resource allocation, it considered the impact of its recommendations on centre allocations in terms of relative change from current core funding levels to reach the projected 1998 levels. These relative changes and their amplitude are shown in Table 14.5 by groups of centres and by category of activity. The table also illustrates how the directional changes proposed at the System level impact on centre allocations. This becomes particularly evident when the directional changes are analyzed by functional regrouping of centres as presented in Table 14.5. A plus or minus sign in the table indicates that the centre allocation is positively or negatively affected by the System relative allocation to the priority parameters; a double sign indicates a stronger impact, while a single sign indicates a more moderate impact. It should be noted that the signs are not directly comparable among categories of activity, and thus across centres, since the magnitude of the change of direction in the different categories varies widely. Given these factors the pluses and minuses can not be translated into monetary terms. Thus adding pluses and minuses within a centre or across centres has no real meaning.
The proposed increase in core resources for research on natural resources conservation and management (category 1) are allocated to all centres concerned. The Centres with a regional mandate and a natural resource management programme benefit more than the global commodity oriented centres, and mostly in their activities comprised in sub-category 1.1 (ecosystem conservation). In contrast, the proposed increase in category 1 in the commodity centres, while more modest in size, is fully allocated to sub-category 1.2 (germplasm collection and conservation), which is consistent with their commodity orientation.
The increase in resources proposed in category 4 (socioeconomic, public policy and public management research) is also allocated to all centres, except to those focusing on SSA. This is consistent with TAC's recommendation to shift the emphasis of this category from SSA towards LAC and, to a lesser extent, to Asia. The proposed reduction in institution building activities (category 5), will affect all centres except ISNAR which is allocated more as a consequence of TAC's recommendations to intensify efforts in organization and management counselling (sub-category 5.3).
The proposed increase in activities related to germplasm enhancement and breeding (category 2) is allocated mostly to the commodity oriented centres, while these centres see the relative allocation to category 3 (production systems development and management) decrease. This is consistent with TAC's recommendation to decrease the overall effort of commodity related production systems work and of emphasizing crop related germplasm work. In contrast, the regionally focused centres see their relative allocation to category 2 increase only modestly mainly as a consequence of TAC's recommendation to reduce efforts in food legumes. The same trends can be observed in the allocations to production systems work in the regionally focused centres; the significant reduction in sub-category 3.1 (cropping systems) is, however, in all cases somewhat compensated by an increase in sub-category 3.3 (Tree Systems), as a consequence of the assumed increment in forestry work.
The centres dealing with policy and management benefit from increases in the categories of activities relevant to them, and consistent with TAC's recommendations to strengthen natural resources conservation and management (category 1), public policy and public management research (included in category 4), and organization and management counselling (sub-category 5.3).
The African livestock centres will experience an overall reduction in resources, consistent with TAC's recommendations to decrease work on productions systems (category 3), including livestock systems (sub-category 3.2), and on institution building (category 5). As indicated above, these centres also see a decline in resources for socioeconomic work (included in category 4) as a consequence of TAC's recommendation to adjust this category in SSA.
The forestry and fisheries centres are allocated significant increases of resources in all categories of activity consistent with the assumption that incremental funding will be provided by the CGIAR for these activities.
Finally, the Genetic Resources Centre will see its overall resources increase significantly, as a consequence of the System increase in germplasm collection and conservation work (sub-category 1.2).
The last step in TAC's resource allocation process consisted in translating the System resource allocations and the directional changes in centre allocations into centre specific absolute dollar amounts, which would represent the 1998 indicative resource allocations as a starting point for the preparation by centres of the 1994-98 MTPs.
TAC felt that in view of the indicative nature of the funding envelopes, it would need, at the final stage of the medium-term resource allocation process, some flexibility to reallocate resources - within the overall core funding envelope - among programmes and centres on the basis of centre proposals. Therefore, in developing the centre core resource envelopes, TAC has only allocated a total of US$ 250 million out of the total of US$ 270 million. The adjustment was made first by discounting all centres' initial resource envelopes by 5% (representing US$ 15 million). This was supplemented by holding back US$ 5 million of funding for African livestock centres - in view of the uncertainty surrounding the future evolution and direction of CGIAR livestock research as expressed in Chapter 12 (Section 12.3.5.2).
At the time of completion of the medium-term resource allocation process decisions can be made on allocating the resulting reserve of US$ 20 million to centres to accommodate requests for core funding in excess of their resource envelopes for programmes and activities which TAC could not anticipate or for additional requirements resulting from external reviews or other studies. Such a reserve could also finance new and innovative programmes during the MTP implementation period, i.e. 1994-98.
Taking into account the set-side of US$ 20 million, an indicative core funding envelope was established for each of the 18 centres. In order to provide flexibility in both System and centre level planning, centres are asked to present MTP proposals at three levels of core funding -i.e. at the level of their allocation (totalling US$ 250 million) as well as in ranges 10% above and below that number. This should provide centres the opportunity to demonstrate their potentials at higher levels of funding, as well as show the impact of a lower funding on their programmes and activities.
These indicative planning targets and the corresponding brackets are shown in Table 14.6, which compares them with 1992 core funding as currently estimated.
Centres' individual, indicative resource envelopes are consistent with TAC's overall System recommendations as explained in the next section.
Table 14.6 Centers' Indicative 1998 Resource Envelopes and Planning Ranges
|
Centers |
1992 Estimated Core Funding |
Planning Ranges of 1998 Core Funding (in 1992 $ millions) |
|||
|
Low |
Base Resource Envelope |
High |
|||
|
CIMMYT |
25.6 |
21.7 |
24.1 |
26.5 |
|
|
CIP |
15.2 |
12.9 |
14.3 |
15.7 |
|
|
INIBAP |
2.2 |
1.9 |
2.1 |
2.3 |
|
|
IRRI |
28.3 |
22.1 |
24.5 |
27.0 |
|
|
WARDA |
6.2 |
5.2 |
5.8 |
6.4 |
|
|
ICRISAT |
27.7 |
24.2 |
26.9 |
29.6 |
|
|
IITA |
22.2 |
20.3 |
22.5 |
24.8 |
|
|
CIAT |
26.5 |
24.8 |
27.5 |
30.3 |
|
|
ICARDA |
18.9 |
15.8 |
17.6 |
19.4 |
|
|
ILCA |
19.4 |
12.6 |
14.0 |
15.4 |
|
|
ILRAD |
12.6 |
8.2 |
9.1 |
10.0 |
|
|
ICRAF |
11.9 |
14.5 |
16.1 |
17.7 |
|
|
CIFOR |
3.4 |
7.3 |
8.1 |
8.9 |
|
|
ICLARM |
4.0 |
4.3 |
4.8 |
5.3 |
|
|
IBPGR |
7.4 |
7.6 |
8.4 |
9.2 |
|
|
IFPRI |
8.3 |
7.7 |
8.6 |
9.5 |
|
|
IIMI |
7.3 |
6.8 |
7.6 |
8.4 |
|
|
ISNAR |
6.6 |
6.1 |
6.8 |
7.5 |
|
|
Centers Total |
253.8 |
|
248.8 |
|
|
|
Add: |
External Reviews |
|
|
1.2 |
|
|
Reserve for future Allocation |
1.2 |
|
20.0 |
|
|
|
System Total |
255.0 |
|
270.0 |
|
|
|
CIMMYT: |
CIMMYT's indicative 1998 core resource envelope amounts to US$ 24.1 million, which compares with a current 1992 core funding assumption of US$ 25.6 million. CIMMYT resources would increase modestly in natural resources conservation and management (category 1), more significantly in germplasm enhancement and breeding (category 2) because of the need to give greater attention to strategic issues in wheat research. The centre also benefits from the higher priority assigned to Asia and of the greater emphasis on socioeconomic work (included in category 4). Resources would, however, decrease, consistent with the Systemwide recommended trends, in production systems development and management (category 3) and institution building (category 5). The relative priority assigned to research on wheat and maize remains unchanged. |
|
CIP: |
CIP's indicative 1998 resource envelope amounts to US$ 14.3 million, which compares with a current 1992 core funding assumption of US$ 15.2 million. CIP would benefit from a relatively modest increase in natural resources conservation and management (category 1), a more significant increase in germplasm enhancement and breeding (category 2) an in socioeconomic work (included in category 4). Its resources for production systems development and management (category 3) and in institution building (category 5) would decrease, consistent with TAC's System recommendations on these categories. The relative priority assigned to research on potato and sweet potato remains unchanged. |
|
INIBAP: |
INIBAP's indicative 1998 resource envelope amounts to US$ 2.1 million, which compares with a current 1992 core funding assumption of US$ 2.2 million. INIBAP's core resources would be virtually maintained thus providing the institution, which joined the CGIAR recently, the necessary critical mass to bring its programme to fruition, which is consistent with TAC's recommendation to maintain the relative importance of banana and plantain at current levels. |
|
IRRI: |
IRRI's indicative 1998 core resource envelope amounts to US$ 25.8 million, which compares with a current 1992 core funding assumption of US$ 28.3 million. IRRI's core resources would decrease significantly as a result of the Systemwide decreases in production systems development and management (category 3) and in institution building (category 5); with regard to the latter, IRRI is particularly affected by the reduction in sub-category 5.4 (networks). On the other hand, IRRI benefits from an increase in natural resources conservation and management (category 1) and from an even more significant increase in germplasm enhancement and breeding (category 2), both of which are not sufficient to offset the decreases in the previous categories of activity. IRRI also benefits from its overall focus on Asia, and on the need to give greater attention to strategic issues in rice research. The relative priority of rice research remains unchanged. |
|
WARDA: |
WARDA's indicative 1998 resource envelope amounts to US$ 5.8 million, which compares with a current 1992 core funding assumption of US$ 6.2 million. WARDA's core resources would be virtually maintained at its current level. The application of TAC's System priority and allocation recommendations on WARDA would have implied a reduction in its core resources. However, such a reduction was considered to bring WARDA's current, modest research programme below the critical mass level. |
|
ICRISAT: |
ICRISAT's indicative 1998 core resource envelope amounts to US$ 26.9 million, which compares with a current 1992 core funding assumption of US$ 27.7 million. Increases result from higher System allocations to natural resource conservation and management (category 1), in socioeconomic work (included in category 4) and in tree related work (sub-category 3.3). ICRISAT's resources are reduced by decreases in germplasm enhancement and breeding (category 2) and cropping systems (sub-category 3.1) as a consequence of TAC's recommendation to de-emphasize work on pigeonpea, though this is in part offset by the recommended increase in groundnut research. ICRISAT also benefits from its focus on the Asia region which has received a higher priority, and its overall emphasis on resource management issues in the semi-arid tropics. The relative priorities assigned to sorghum, millet and chickpea are unchanged. As other centres, ICRISAT's allocation for institution building (category 5) would decrease. |
|
IITA: |
IITA's indicative 1998 core resource envelope amounts to US$ 22.2 million, which compares with a current 1992 core funding assumption of US$ 22.2 million. Increases result from System increases in natural resources conservation and management research (category 1), in germplasm enhancement and breeding (category 2), and in tree related work (sub-category 3.3); consistent with TAC's recommendation to strengthen soybean research, IITA's allocation for categories 2 and 3 increases in relative terms. IITA's allocation, however, experiences decrease in socioeconomic work (included in category 4) and in institution building (category 5), and because of its overall emphasis on SSA which has received a lower priority ranking. |
|
CIAT: |
CIAT's indicative 1998 core resource envelope amounts to US$ 27.5 million, which compares with a current 1992 core funding assumption of US$ 26.5 million. CIAT benefits from the increases in natural resources conservation and management (category 1) and in socioeconomic work (included in category 4), with a special emphasis in both categories on LAC. CIAT also benefited from its overall focus on LAC, and the broadening of its agroecological zone coverage. Except for an increment in tree systems (sub-category 3.3), CIAT's envelope experiences a decline in the combined allocation to categories 2 (germplasm enhancement and breeding) and 3 (production systems) as a result of the overall recommended trend and more specifically as a consequence of TAC's recommendation to reduce the priority of research on phaseolus bean. Also, CIAT is impacted by a reduction in institution building (category 5) as a consequence of TAC's global recommendation to that effect. |
|
ICARDA: |
ICARDA's indicative 1998 core resource envelope is US$ 17.6 million, which compares with a current 1992 core funding assumption of US$ 18.9 million. ICARDA benefits from the system increases in natural resources conservation and Management research (category 1), in socioeconomic work (included in category 4) with a particular emphasis on WANA, in germplasm enhancement and breeding research (category 2) and in tree related work (sub-category 3.3). It experiences decreases in cropping systems (category 3.1) without altering the relative importance of ICARDA's specific crops, and in institution building (category 5), and through its overall focus on WANA which has received a lower priority ranking. |
|
ILCA: |
ILCA's indicative 1998 core resource envelope amounts to US$ 14 million, which compares with a current 1992 core funding assumption of US$ 19.4 million. More than half of the reduction is accounted for by TAC's decision to set aside a reserve, pending the outcome of the Winrock livestock study, of the livestock centres external reviews, and TAC's review of these centres' MTP proposals. Discounting for this reduction, ILCA's resources would still decline as a result of TAC's Systemwide recommendations to reduce the priority assigned to SSA, and of efforts in Production System Development and Management (category 3), to adjust efforts in SSA in socioeconomic work (included in category 4), and to adjust Institution Building activities (category 5). |
|
ILRAD: |
ILRAD's indicative 1998 core resource envelope amounts to US$ 9.1 million, which compares with a current 1992 core funding assumption of US$ 12.6 million. As in the case of ILCA, more than half of the reduction is accounted for by TAC's decision to set aside a reserve, pending the outcome of the Winrock livestock study, of the livestock centres external reviews, and TAC's review of these centres MTP proposals. Discounting for this reduction, ILRAD's resources would still decline as a result of TAC's Systemwide recommendations to reduce efforts in SSA, in particular in production system development and management (category 3), in socioeconomic work (included in category 4), and to adjust institution building activities (category 5). These reductions are, however, offset in part with an increase in resources for germplasm enhancement and breeding (category 2). |
|
CIFOR: |
CIFOR's indicative 1998 core resource envelope amounts to US$ 7.6 million, which compares with a current 1992 core funding assumption of US$ 3.4 million. Virtually all of the increase is related to the assumption that the CGIAR will provide incremental core funding for forestry related activities. If this assumption materializes, CIFOR's activities in all categories would increase substantially. CIFOR also benefits of some increase as a result of TAC's System recommendation to increase resources for natural resource conservation and management (category 1). |
|
ICRAF: |
ICRAF's indicative 1998 core resource envelope amounts to US$ 15.6 million, which compares with a current 1992 core funding assumption of US$ 11.9 million. As in the case of CIFOR, virtually all of the increase is related to the assumption that the CGIAR will provide incremental core funding for forestry related activities. If this assumption materializes, ICRAF's activities in all categories would increase substantially. ICRAF also benefits from some increases as a result of TAC's System recommendation to increase resources for natural resource conservation and management (category 1). As other centres, ICRAF would experience a relative decrease in resources for institution building (category 5), consistent with TAC's recommendation to adjust System efforts in this area. |
|
ICLARM: |
Throughout TAC's priority and resource allocation exercise, it has been assumed that by 1998 ICLARM would be fully integrated in the CGIAR. On that basis, ICLARM's indicative 1998 core resource envelope amounts to US$ 4.8 million, which compares with a current 1992 core funding assumption of US$ 4 million. Virtually all of the increase is related to the assumption that the CGIAR will provide incremental core funding for fisheries related activities. If this assumption materializes, ICLARM's activities in all categories would increase significantly. In addition, ICLARM would benefit from some increases as a result of TAC's System recommendation to increase resources for germplasm collection and conservation (sub-category 1.2) and for socioeconomic work (included in category 4). As other centres, ICLARM would experience a relative decrease in resources for institution building (category 5), consistent with TAC's recommendation to adjust System efforts in this area. |
|
IBPGR: |
IBPGR's indicative 1998 core resource envelope amounts to US$ 8.4 million, which compares with a current 1992 core funding assumption of US$ 7.4 million (excluding funding of one time costs in 1992). The increase results from TAC's recommended System increase in germplasm collection and conservation (sub-category 1.2), tempered somewhat by a relative decrease in the allocation for institution building (category 5). |
|
IFPRI: |
IFPRI's indicative 1998 core resource envelope amounts to US$ 8.6 million, which compares with a current 1992 core funding assumption of US$ 8.3 million. The increase results from the significant increase in allocation to public policy research (included in category 4), in particular in view of the needs arising from the integration in the CGIAR of expanded areas of activity (natural resources management, forestry and fisheries) and from the greater emphasis given to Asia and LAC. IFPRI would, however, experience a relative decrease in resources for institution building (category 5), consistent with TAC's recommendation to adjust System efforts in this area. |
|
IIMI: |
IIMI's indicative 1998 core resource envelope amounts to US$ 7.6 million, which compares with a current 1992 core funding assumption of US$ 7.3 million. The increase results from the significant increase in resources for natural resource conservation and management(category 1) as well as for public management research (included in category 4). As other centres, IIMI would experience a relative decrease in resources for institution building (category 5), consistent with TAC's recommendation to adjust System efforts in this area. IIMI also benefits from its overall focus on Asia. |
|
ISNAR: |
ISNAR's indicative 1998 core resource envelope amounts to US$ 6.8 million, which compares with a current 1992 core funding assumption of US$ 6.6 million. The increase results from the increase in resources for organization and management counselling (sub-category 5.3) as well as for socioeconomic, policy analysis and public management research (category 4). |
In the process of preparing their MTP proposals, centres will add to these allocations the amount of revenue they expect to generate, and the resulting sum will provide the total core resources which the centre should assume to be available to cover all its 1998 core expenditures, i.e. operating expenses inclusive of depreciation charges, new capital requirements, and operating fund adjustments. Because of the application of the depreciation policy, and the expectation that most new capital requirements currently undertaken or envisaged will be largely completed by 1998, it is expected that core new capital requirements will be truly exceptional and will be especially scrutinized from a System's need perspective.
Also, since the centre resource allocations are expressed in constant 1992 values, they will need to be adjusted for inflation at an annual rate of 4% for each of the years 1993 through 1998.
Centres will also be requested to interpret the directional changes implied by their resource envelopes with care when it comes to implementing them during the MTP period, i.e. from 1994 through 1998. Experience has shown that the implementation of changes, particularly in resource allocations, in the CGIAR can only be implemented gradually. In addition, consistent with the basic assumption of constant supply, increases in one area will only be possible if decreases occur first in other areas. Therefore, centres whose resource envelopes imply an increasing trend should not assume that such increase will occur in full in the early years of the MTP period, but rather that the increase will be gradual, equally distributed over the intermediate years. Those centres whose resource envelopes imply a decreasing trend from 1992 towards 1998, are urged to assume that decreasing trends will occur in the early years of the MTP period.
14.9.1. Planning Guidelines
14.9.2. Timetable
14.9.3. Interactive Review of the MTPs
14.9.4. Consolidation and Approval of MTPs
14.9.5. Adjusting Planned Requirements with Actual Funding During Implementation
The indicative resource envelopes are being communicated to all CGIAR Centres via this document, together with the process guidelines for the preparation of the MTPs.
At its mid-term meeting in May 1992, the Group will consider the proposed planning envelopes in the framework of this paper. Since the Group should not approve centre allocations before reviewing centres' final MTP proposals (ICW'93), at the midterm meeting the Group is expected to evaluate, adjust as appropriate and endorse the overall CGIAR priorities and the general thrust of their translation into centre indicative allocations.
The System priorities, the indicative resource envelopes, as well as centres' strategic plans will serve as guidelines for the centres to prepare their medium-term plans. Centres have flexibility to cast their plans and priorities within them as they see fit.
A number of centres have indicated their willingness to prepare 1994-98 MTPs in mid 1992, i.e. upon receipt of the guidelines, while the other centres are expected to initiate the process later in the year. Changes suggested by the Group, at the mid-term meeting in May 1992, to the resource allocation envelopes as planning bases will be communicated to the centres.
In advance of their presentation to TAC and the CGIAR, centres are requested to send their MTP proposals to TAC (and TAC Secretariat) as well as to the CGIAR Secretariat. In the mean time, a working party composed of the TAC liaison scientist and staff members of the two Secretariats will visit each centre. The purpose of the visit is for the members to get acquainted with the centre MTP proposal, provide guidance to the centre as needed in developing its proposal, and facilitate the interaction between TAC and the centre. Interactions between TAC and the centres are scheduled to take place just prior to ICW92 and in March 1993. Similarly, centres will present their proposals to the Group either at ICW92 or at the 1993 mid-term meeting.
At its June 1993 meeting, TAC will review all centres' MTP proposals in a consolidated way to evaluate their consistency with the overall System priorities and resource availability. TAC will then be in a position to formulate final recommendations for centres' resource envelopes, which will serve as a basis for the centres' preparation of the final MTP proposals for Group approval, individually and collectively, at ICW'93. Thus at ICW'93, the Group will be asked to approve a vector of budgets for all CGIAR Centres which will be valid through 1998.
During the implementation of the MTPs, the relative share of each centre will serve as a bench mark for adjusting its level of funding whenever actual core funding is higher or lower than assumed at the time of the approval of the MTPs. This mechanism would be effective as long as the discrepancy between core requirements and supply is in a manageable range of say plus or minus 5 %. Were the discrepancy to be much larger, the CGIAR would need to consider different approaches, which could include an interim review of all centres' MTPs.
14.10.1. A Transition Year
14.10.2. Matching Demand and Supply
The launching of the second round of CGIAR MTPs in March-May 1992, combined with the deferment until mid and late 1993 of final recommendations and decisions on centres' resource envelopes and the MTP proposals, implies that 1993 is a transitional year for both the centres and the System as a whole.
All centres have thus been requested to prepare an annual programme and budget for 1993, which will be reviewed by TAC at its June 1992 meeting, and submitted to the Group for approval at ICW'92. The 1993 programmes and budgets are generally based on 1992 core funding, adjusted for inflation.
All centres will thus prepare the 1993 programme and budget proposals without explicit reference to their existing MTP, since existing MTPs covering 1993 or beyond are out of date as they do not relate to TAC's current priority and strategy setting analysis.
In the event 1993 core funding will be different from the assumption made for the construction of 1993 budgets, the adjustment to centres' 1993 funding requirement should be made in the context of the new priorities and strategies, as follows:
(a) If 1993 core funding for the System exceeds the planning estimate, centres whose indicative 1998 resource envelope shows an increasing trend could be adjusted upwards in proportion to the relative increase of their 1998 indicative resource envelope up to 150% of the average increase in System funding compared with the planning estimate. The centres with a decreasing indicative 1998 resource envelope would be kept at the 1993 level recommended by TAC based on 1992 core funding.(b) If 1993 core funding for the System falls short of the planning estimate, centres whose indicative 1998 resource envelope shows a decreasing trend could be adjusted downwards in proportion to the relative decrease of their 1998 indicative resource envelope up to 150% of the average decrease in System funding compared with the planning estimate. The centres with an increasing indicative 1998 resource envelope would be kept at the 1993 level based on the 1992 core funding.
The assignment of indicative 1998 core resource envelopes to each of the CGIAR Centres constitutes the first step in the medium-term resource allocation process. They will constitute the basis, together with the planning ranges indicated above, for centres to develop MTPs. In developing their proposals, centres will use TAC's present priority and strategy analysis as part of their reference. This should ensure a satisfactory degree of consistency between centre operational proposals and the System priorities and strategies. Following a series of interactions involving the centres, TAC and the Group, the medium term resource allocation process will come to a close when the Group will approve, at ICW'93, a vector of programmes and budgets for the period 1994-98.