1.1 Defining Land Degradation and Sustainability
1.2 Classifying the Approaches to Land Degradation
1.3 Defining Poverty
1.4 Mapping Rural Poverty and Land Quality
Based on an in-depth evaluation of available information, the study on CGIAR Research Priorities on Marginal Lands1 concludes that neither the global and regional quantification of marginal land areas (based on biophysical data) nor the assessment of CGIAR projects and expenditures assignable to these various land areas are relevant to the CGIAR's decision on strategy for poverty alleviation. The report states that the concept of "marginal areas" (MA) is more relevant2 These are areas where "there are concentrations of marginal rural people and where the definition of geographic area would derive from a set of relatively homogeneous variables deemed to generate rural poverty. Biophysical characteristics would be one element in the equation" [Nelson et al. (1997)]. It thus put rural poverty at the center of the stage3.
1 This study had started with the "four tenets of conventional wisdom," namely: 1) Marginal lands are defined in biophysical terms which establish them as: having low inherent productivity for agriculture; being susceptible to degradation; and involving high risks for agricultural production; 2) They support a high proportion of the rural poor, particularly the poorest of the poor; 3) The combination of fragility and high density of poor people who place a premium on current consumption (resulting in over-exploitation of natural resources) is leading to accelerated erosion or vegetation destruction; the consequence is a downward spiral of poverty and resource degradation with significant negative externalities; and, 4) The impact of CGIAR research on agricultural productivity increase, environmental protection and above all, poverty alleviation has been limited in these areas [Nelson et al. (1997)].2 Lack of comfort with the definition of marginal areas purely in terms of climate, soils and terrain was obvious for several years. For example, Crosson and Anderson (1993) had suggested an alternative definition based on productivity potential. Their discomfort had also extended to the allocation of research resources for such areas. From a purely economic point of view these authors had pointed out that research resources should only be allocated to marginal areas when concerns with equity in the distribution of productive opportunities outweighs productivity gains as the criterion for research focus amongst areas. This is basically a political choice and to the extent that cost free migration is an alternative, equity might be much better served by focusing on the areas with more productive potential and encouraging non agricultural activities in the less favored ones. Focusing on less favored areas may not be the most cost effective way to promote equity.
3 The report concludes that the assessment of the appropriate balance between CGIAR research investment targeted to MA and to non-MA could only follow from a clarification of where marginal people are located, why they are marginal and the options open to the System for addressing poverty in the MA.
Within this overall sharper focus on the need to understand more fully the causes and consequences of rural poverty with a view to identifying the options open to the System - for addressing it; the report stated that "there is [also] a need to improve our understanding of land and water degradation processes.4 There appears to be little hard evidence linking the poor, in contrast to the non-poor, to accelerated resource degradation. Degradation processes need to be understood and linked to poverty processes" [Nelson et al. (1997)].
4 The widespread reports of land degradation in Africa; soil erosion on sloping lands in South Asia; and the extensive deforestation of agricultural landscapes in formerly forested parts of South Asia and Ethiopia have brought an increased focus on issues of natural resource management in agriculture [Scherr and Yadav (1995)].
By highlighting the lack of rigorous evidence and calling for a greater understanding of the interaction of the two processes, the Marginal Lands Study has called into question the strong perception that poverty is both a consequence as well as a cause of resource degradation.5 This perception is strongly evident in the writings of the multilateral development agencies such as the World Bank6 and the International Fund for Agricultural Development7 (IFAD).
5 Such statements aggregate over many diverse situations and lead to confusion. Generally societies are composed of poor as well as non-poor individuals and poverty is characterized by differential access to resources especially land. Stating that the poor in a particular region behave differently from the non-poor in terms of their relationship to land and are impacted differentially by it is not the same as saying that generally low levels of development in a region are both a cause as well as a consequence of resource degradation. While areas with low levels of development may have a larger proportion of the poor, regions with relatively better levels of development can also contain significant proportions of poor people. In order to evaluate conclusively if the poor behave differently from the non-poor, it is crucial to be able to maintain conceptual and analytical rigor. For this it is important to control for general levels of development, institutions, markets, infrastructure, resource quality and quantity and relationships that govern the use of resources.6 For example, "increasing numbers of poor people live in areas that have little agro-climatic potential and are environmentally fragile... population pressure in these areas has decreased the productivity of land and increased its vulnerability to flooding and soil erosion. This raises the question of the links between poverty and environmental degradation.......These regions need a special development strategy for three reasons. First there potential for growth is limited. Second they are increasingly occupied by poor people with the fewest skills and the least access to infrastructure and supplies. Third environmental degradation in these regions adversely affects both the immediate area and regions downstream or downhill... Poor farmers are being marginalized and pushed to frontier areas. In addition population growth and the commercialization of agriculture have forced farmers who once relied on environmentally sustainable forms of cultivation to use their land more intensively... But the intensification of traditional farming methods such as slash and burn agriculture has damaged the productivity of these marginal areas. Over grazing and unmanaged irrigation and an ever widening search for fuel wood all accelerate decline... Insecure land tenure and encroachments on common and state lands encourage soil mining practices that diminish the long term productivity of the land [World Bank (1990)].
7 For example, when peoples' survival is at stake they are forced to farm increasingly marginal soils, to reduce fallow periods which would permit the soil to renew its fertility, to cut vital forests in their search for arable land or fuel and to overstock fragile range lands [IFAD (1992)].
The present study is a first step towards addressing the concerns raised by Nelson et al. (1997) with regard to poverty and land degradation. In reviewing the available literature on rural poverty and land degradation and evaluating the implications of the current state of knowledge for priority setting in the CGIAR System; an attempt is made to look beyond the generally-held perceptions of poverty and land degradation processes. Such an effort is inherently fraught with all the problems that a study of the interaction of two complex and diverse processes is bound to face. These problems are further compounded by the fact that the understanding of these processes is still limited and shrouded in numerous unresolved issues ranging from difficulties in conceptualization and definition to those of measurement and empirical verification. The lack of a clear testable theory on the interaction of the two processes and the vast heterogeneity of what is observed, coupled with the limited and inadequate range of what is actually measured of the numerous diverse elements of this interaction underlies these problems.
There are numerous difficulties associated with definition, measurement and maintenance of analytical rigor. Attempts at rigorous analysis generally gloss over the underlying assumptions and the inherently weak statistical basis. The emotionalism associated with images of severely denuded hillsides or starving malnourished children tend to take over. The debate looses further clarity through the involvement of several intellectual disciplines that do not speak a common language.
The short- and long- term implications of land degradation are not very clear [see Scherr and Yadav (1995)]8 Similarly, while knowledge about poverty is expanding rapidly, thanks in large parts to the massive international focus and resources brought to bear on its understanding in the past ten years or so; the existing state of knowledge is still far from providing a comprehensive understanding of all the complex dimensions of its processes.9 Even less clear and limited is the understanding of the interactions of poverty and land degradation.10
8 This study, part of the IFPRI 2020 exercise, presents the synthesis of discussions from a three-day workshop of 35 experts from 14 countries representing a cross section of disciplines. The discussions at this workshop were structured around four research paper prepared especially by IFPRI to address the land degradation and food production linkages namely 1) an extensive literature review comparing existing studies of the scale and effects of land degradation 2) a modeling exercise to simulate some of the effects of land degradation on global food production, trade and consumption [Agcaoili, Perez and Rosegrant (1995)], 3) a modeling exercise to simulate the process of land-use intensification in the drylands of the Sahel to 2020 [Barbier (1995)], and 4) a review of ecological principles and natural resource degradation and improvements, and microeconomic foundations for changes in land management in tropical hillsides, along with their implications for policy [Scherr, Jackson and Templeton (1995)].9 Conclusion of the World Bank's workshop on the "Future Of Poverty Analysis In The Bank", March 16, 1997 reported in Malik (1997).
10 Studies on the direct empirical verification of the relationship between poverty and land degradation are extremely scarce. Scherr and Yadav (1995) after their comprehensive survey of available literature conclude that no consistent relationship between poverty and land degradation can be established.
This study is organized as follows: Initially the understanding on each process is evaluated. Issues connected with definition and measurement are highlighted and currently available empirical estimates are presented. Next the existing state of knowledge about the relationship between poverty and land degradation is evaluated. The empirical evidence and attempts to explain observed behavior are analyzed. The implications of the current understanding for policy research generally and for the CGIAR in particular are presented in the final section.
There are several definitions of land degradation. Land11 degradation is generally defined as the reduction in the soil's ability to contribute to crop production [Blaikie and Brookfield (1987)] and as a change to land that makes it less useful for human beings [Wasson (1987)]. Examples of land degradation can be found in erosion, salinization, waterlogging, vegetation depletion, fertility loss, soil structure change, and pollution of soil. In each case the focus is on the physical or biological effects with land-use methods seen as the ultimate causes of degradation. Land degradation can take many forms.12 Land degradation13 effects are often cumulative. The off-site effects (sedimentation of reservoirs and deposition of silt on downstream fields), both positive and negative, can also be considerable. A formidable problem exists because there is no simple relationship between the physical phenomena and the perceptions of land by human beings. What is observed in the present is the result of the interaction of several complex processes over long periods of time. For complete detection and measurement of land degradation, a system is needed for monitoring change in physical, biological and social phenomena.14 The heterogeneity of the situations and the complex and changing (over time) interaction of the several processes involved have negative implications for precise measurement.15
11 The concept of land used in such studies is broad. It is the extensive system of physical and biological materials and processes associated with the interface of the solid earth, terrestrial water bodies and the air, and the works of human beings [Chisholm and Dumsday (1987)].12 Scherr (1998) classifies these to include: crusting, compaction, sealing, wind erosion, water erosion, devegetation, over-tillage, impeded drainage, waterlogging, reduced waterholding capacity, reduced infiltration, salinization, alkalinization, acidification, nutrient leaching, removal of organic matter, burning of vegetative residues, nutrient depletion, over-application of agrochemicals, industrial contamination, decline in vegetative cover, decline in biodiversity, decline in species composition, decline in availability of valued species. Land degradation involves aspects of physical soil management soil Water management, soil nutrient and organic matter management, soil biology management, vegetation management.
13 Degradation and erosion are not the same although the terms are often used interchangeably. Erosion is only one (though probably the most well known and significant) possible form of degradation [Pagiola (1994)].
14 For an excellent discussion of detection and measurement issues of land degradation processes see Wasson (1987).
15 Much of what we know about the extent and nature of land degradation is based on 1) anecdotal evidence 2) suspended sediment measurements and 3) plot-level soil loss measurements. The anecdotal evidence, though generally visually spectacular, is often non-representative and does not control for the effects of other factors. The suspended sediment measurements are difficult to undertake and do not provide information on the effects on yields. The plot-level soil-loss measurements come from test plots. There are also serious issues of the representativeness of field conditions and practices associated with these. Measurements are generally carried out in short periods - whereas actual soil loss varies substantially because of changes in other conditions. What are needed ideally are estimates of long-term average loss. Moreover, these measurements are generally limited to soil loss and not productivity loss. These measurements generally assume that soil moved from one field is soil lost, whereas it might have moved from one field to another. Because of these data problems often it is very difficult to decide on the existence or severity of land degradation [Pagiola (1994)].
Concern with land degradation has heightened due to the increasing focus in policy circles on sustainability. There are several definitions in use for sustainability in agriculture which leads to some confusion There is a need for a clear and widely agreed upon perspective.16 Existing definitions can be broad and all encompassing. For example sustainability is defined as meeting the needs of the present generation without compromising the ability of the future generations to meet their own needs [The World Commission on Environment and Development17 (1987)]. Sustainable development means more efficient use of arable lands and water supplies. It requires avoiding overuse of chemical fertilizers and pesticides so that they do not degrade rivers and lakes, threaten wildlife and contaminate human food and water supplies. It means careful use of irrigation to avoid salinization or water logging of croplands. It means avoiding the expansion of agriculture to steep hillsides or marginal soils that would rapidly erode [World Resources Institute (1982)].
16 The lack of an agreed perspective is brought out forcefully in the discussion on conceptual issues relating to sustainable growth of agriculture by Crosson and Anderson (1993). Given the increasing concern with the potential impact on the welfare of current and, in particular, future generations, the need for an agreed perspective for identifying measures that can guide analysis of policies, approaches, and achievements in the field of poverty, natural resources and the environment is obvious.17 Generally referred to as The Brundtland Commission
Sustainability is often confused to imply zero depletion of the natural resource base or zero environmental costs. However, as Crosson and Anderson (1993) point out ''agricultural production that imposes some resource depletion and environmental costs can be sustainable as long as the costs of depletion and environmental damage are consistent with rising per capita welfare". From an economic perspective, degradation only occurs beyond the socially defined optimal use level. Such degradation occurs where individuals cannot or do not optimize returns to their resources (e.g., due to inadequate information) and/or because there is a divergence between private and social interests (e.g.. externalities or inappropriate public policies) [see for example Scherr and Yadav (1995) and Binswanger (1989)].
This lack of an agreed perspective on sustainability has implications for how land degradation is defined, measured and analyzed
There is general recognition that data on the physical processes of land degradation as well as on its economic and social consequences are sparse [Scherr and Yadav (1995)]. Earlier reviews of the evidence on land degradation around the world have also found this evidence to be "extraordinarily skimpy." ''No country has comprehensive estimates of the productivity consequences of land degradation or the rates of degradation from current practices" [Crosson and Anderson (1992)]. Several other authors, including Biot et al. (1995), recognizing this inadequacy, have called for a thorough review of experimental and field data and a sharper focus, particularly, on robust and cheap methods of measurement in order to improve the understanding of the physical processes involved.
The problems associated with drawing representative samples for plot-level measurement have meant that most aggregate estimates are based on non-scientific methods of "raising" the information. Most estimates of the impact of land degradation are based on "objective assessments" by experts. Available aggregate estimates of the cost of degradation have to be taken with even greater caution since they are based on standard formulas relating certain levels of degradation to estimates of yield losses. Attempts to go from the estimates of the effect of yield losses at the plot level to aggregate estimates of the socioeconomic impact at the national or regional level have often been dubbed as "giant leaps of faith." Even at the plot level the problems associated with measuring the physical and social value consequences of alternative natural resource management practices and technologies are "big and complex" and not amenable to perfect solutions [Crosson and Anderson (1993)].
The inadequate basis of the available numbers is, however, generally lost in the emotionalism that pronouncements of the catastrophic extent of land degradation generally stir up. Statements such as ''over the last thirty years alone, the world has lost nearly one fifth of the top soil from its crop land, one fifth of its tropical rainforests and tens of thousands of plant and animal species" [Brown (1990)] stir up visions of imminent and impending doom. The literature associated with the "tragedy of the Commons" [Hardin (1968)] has brought an increasing focus on the negative consequences of the interaction of man and natural resources.18 On the other hand complacency,19 based upon the phenomenal increase in agricultural (especially food) production during the past forty years or so, might well be misplaced.
18 The Hardin study had brought the focus to bear on the tragedy of the global commons. The issues of land degradation relate more to local commons.19 This complacency has been likened by some to the misconception of the man hurtling headfirst from the top of a twenty story building stating merrily, as he falls past the ninth floor, that there is nothing serious to worry about because nothing has happened yet! The influential FAO study World Agriculture Towards 2010 reflects this complacency on an aggregate level [Alexandratos (1995)]. It does, however, highlight the seriousness of the problem in certain regions.
There is thus a tremendous need to obtain a fuller understanding of the different aspects of soil degradation based on data generated through consistent definitions and scientific rigor. As already noted, the studies of the impact of soil degradation are based, in one crucial aspect or the other, on the assessments of experts. In most countries the data used for such estimates generally comes from a few studies that were not originally designed to generate estimates for the whole country.20 Moreover, the capacity to monitor changes over time is limited by the weak statistical foundations and the lack of comparability in the available data.
20 For example U.S estimates of the magnitude of soil erosion and the effects of soil erosion on land productivity come from only two sample surveys [Crosson (1986)].
Attempts are being made to address some of these concerns through research on land quality indicators [World Bank (1997)]. The land quality indicators (LQI) program21 was set up under a coalition of international agencies in 1994. Its objective was to better understand the problems of land degradation. This program seeks to "develop a set of natural resource indicators: statistics or measures that help characterize the conditions of natural resources related to land. The program seeks to develop a set of standardized indicators (mainly focused on the local and district levels) to provide concise, reliable information about the condition of land, including the combined resources of soil, water, vegetation and terrain that provide the basis for land use" [Pieri et al. (1995)].
21 This program involves agencies such as the Food and Agriculture Organization, the United Nations Development Programme, the United Nations Environment Programme, and the Consultative Group on International Agricultural Research (CGIAR). The World Resources Institute, the International Food Policy Research Institute and other CGIAR institutions are also participating.
The Global Land Assessment of Degradation (GLASOD22) is the first major exercise that has sought to maintain some consistency in definitions in its endeavor to obtain aggregate estimates of land degradation [Oldeman, Hakkeling and Sombroek (1990)]. The comparative study of dry lands by Dregne and Chou (1992) represents another important effort.23 While the GLASOD exercise was designed to study the problem at the continental scale, the latter study was designed for analysis at the national level but was limited by the availability of national studies. The study [ASSOD] by van Lynden and Oldeman (1997) represents a recent attempt at estimating land degradation. While the methodology is basically the same as that for the GLASOD study, it permits analysis at the national level while the GLASOD was focused on a larger regional level.
22 The GLASOD estimates are also subjective because these are based on experts' estimation of land degradation since the Second World War.23 Studies listed in Scherr (1998) by methods used for assessment of soil degradation impacts include: Qualitative assessments: Pagiola and Dixon (1997), Oldeman et al. (1991), van Lynden and Oldeman (1997), Seghal and Abrol (1994) and Dregne (1990, 1992). Biophysical models of degradation-yield relationships: Aune et al. (1997); Kilasara et al. (1995); Stocking and Benites (1996), Cassman et al. (1995) with secondary price data to obtain estimates of value: Aune (1995), Pagiola (1997), Littleboy et al. (1996). Aggregate, gross valuation of economic losses due to degradation and cost benefit analysis: Pimentel (1995), Young (1993), Lutz et al. (1994), McIntire (1994), White and Jickling (1994). Econometric models: Byringiro and Reardon (1996), Rozelle et al. (1997), Lindert (1996), Bojo (1991), Rozelle et al. (1997), Byringiro and Reardon (1997), Alfsen et al. (1997), Agcaoli et al. (1995), Higgins et al. (1983). Comprehensive Assessments based on disaggregated data (by soil type, farming system, crop): Stoorvogel et al. (1993), Smaling and Stoorvogel (1993), Repetto et al. (1989), Lal (1995)
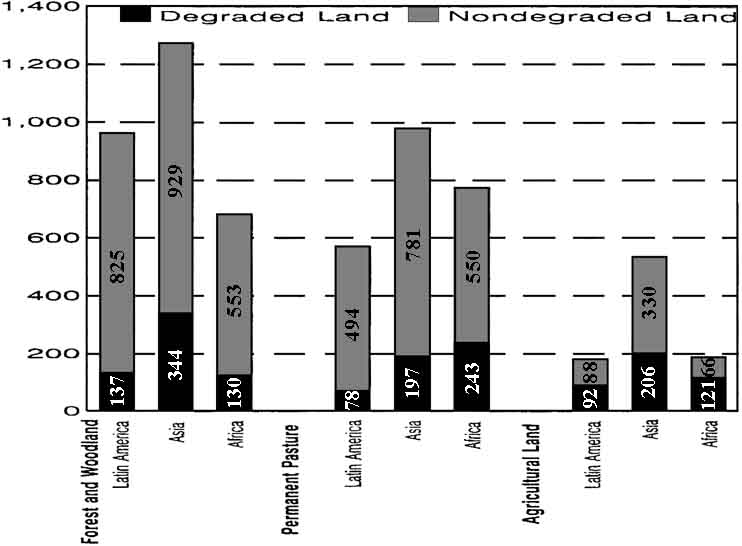
The GLASOD study estimated that nearly 2 billion hectares of the 8.7 billion hectares of vegetated area (agricultural land, pasture, forest and woodland) (22.5 percent) have been degraded since the mid century. This study estimated that some 3.5 percent of the total have been degraded so severely as to be reversible only through costly engineering measures if at all. Just over 10 percent has been moderately degraded and is reversible only through significant on-farm investments. Another nearly 9 percent is lightly degraded and easily reversible through good land management. The GLASOD estimates indicate that nearly one-half of this vegetated area is under forest, of which about 18 percent is degraded; 3.2 billion hectares is under pasture, of which 21 percent is degraded and nearly 1.5 billion hectares is in cropland, of which 38 percent is degraded. Water erosion is the principal cause of degradation. Wind erosion is an important cause, particularly in dry lands and areas where land forms are conducive to high winds.
Figure 1. Land degradation by type of land USE: A regional perspective (million hectares)
Source: Scherr and Yadav (1995) based on GLASOD estimates.
Chemical degradation, such as salinization and nutrient loss, is often the result of cropping practices. It accounts for a smaller overall proportion of degraded lands but more than 40 percent of cropland degradation. Physical degradation such as compaction accounts for a smaller proportion of degraded area. According to the GLASOD estimates degradation of cropland appears to be most extensive in Africa, affecting 65 percent of cropland area compared with 51 percent in Latin America and 38 percent in Asia. Degradation of pasture is also most extensive in Africa, affecting 31 percent, compared with 20 percent in Asia and 14 percent in Latin America. Forest land degradation is most extensive in Asia, affecting 27 percent of forest land compared with 19 percent in Africa and 14 percent in Latin America [GLASOD estimates reported by Scherr (1998)].
Land degradation can lead to declining potential yields on the farm. But, fertilizer use or changing the land use can hide the effects of this degradation for long periods. As such it is almost impossible to establish a one-to-one relationship between the amount of degradation and the effect on yields. Moreover, the level at which yields are affected by changes in land quality can differ by the type and variety of crop grown and by type of soil and its depth etc. While measurements of land degradation generally cover only a short period of time, any measurable effect on crop yields could however, take long periods to appear because of the cumulative nature of land degradation.
For developing countries the literature on land degradation is even more qualitative and less rigorous than that available for developed countries. The difficulty of modeling complex farming systems and the lack of necessary data both contribute to this paucity.24 Most glaring is the lack of knowledge of the effects of degradation on social welfare. "Most of the technical literature on the socioeconomic aspects of land degradation can be classified into three broad categories: soil conservation as an input in agricultural production; top soil as a natural resource, somewhere between nonrenewable and renewable; and the effects of land degradation on common property resources and externalities" [Anderson and Thampapillai (1990)]. Studies at the household level that attempt to rigorously verify differences in behavior between the poor and the non-poor with respect to land are generally difficult to find. This paucity results in large part from the inadequacy of the available data.25
24 The lack of technical information such as rates of soil loss and physical parameters such as those required for the definition of the universal soil loss equation (USLE) leads some studies to use site parameters from specific developed country locations [see for example Veloz et al. (1985)].25 Careful analysis requires disaggregated and detailed data. The availability of disaggregated data on population, incidence of poverty, land use and infrastructure is essential for rigorous analysis. Such data for India enabled Fan and Hazell (1997) to show that public investments in less favored rainfed areas, [coupled with high-yielding varieties, irrigation and education] would increase agricultural productivity and reduce rural poverty. And, that the resultant gain per unit of additional investment would be higher than similar investments in irrigated or high potential rain fed areas. Similarly, a study using the detailed 1992-93 World Bank Living Standards Measurement Survey data for Vietnam found that the highest impact on net crop income would occur in Vietnam's two poorest regions: the Northern Uplands and the North Coast [van de Walle (1996)].
Given some of the problems described above, there is an urgent need for a research agenda that builds up from a large number of case studies. In order to ensure common perspectives, such a research program should involve the biophysical scientists, the socioeconomic experts and the land users working closely together. Use of consistently defined household-level socioeconomic panel (longitudinal) surveys that have specific land-quality assessment modules in several of the "hot spots26" could provide effective answers.27 Such surveys would also be extremely useful for studying the dynamics of poverty.
26 These "hot spots" in land degradation based on the recent assessment of an international group of experts are presented in Annex 1.27 The IFPRI Pakistan panel survey of rural households collected information on land quality in 1993. However, this information, has not been analyzed to date.
Most of the available literature looks at the impact of land degradation in terms of crop production. Scherr (1998), based on her detailed review of this literature,28 concludes that "many studies examine the gross impact of degradation on crop production29 [but] very few examine the net effect, taking into account price effect, substitution of supply by other producing areas, or other secondary impacts. [And moreover] very few studies incorporate into their analysis any active farmer response to degradation" [Scherr (1998)]. Scherr could find only three studies that provided data relevant to the assessment of human welfare impacts. These welfare assessments use different indicators to assess the impact at national or international levels.30 A detailed review of the results and methodological aspects of these studies is available in Scherr (1998) and is therefore not attempted here. However, results from the IFPRI simulations reported by her are reproduced below.
28 Scherr (1998) contains the most comprehensive review of studies showing the impact of land degradation. At the global level she reviews UNCOD (1977), UNEP (1980), Higgins et al. (1983), Harrison (1984), Mabbutt (1987), Buringh and Dudal (1987), Dregne and Chou (1992), Oldeman et al. (1992), Pimentel et al. (1993), Steiner and Herdt (1993), Crosson (1994), Agcaoli et al. (1995), Dyson (1996), Stocking and Benites (1996), Crosson (1997) and Scherr and Yadav (1995)29 Oodit and Somonis (1992) estimated that salinity has reduced the yield of major crops by 30 percent in the fifteen million hectares of irrigated lands in Pakistan. The study by Crosson (1995) indicates that the average productivity losses in the dry lands between 1945 and 1990 were in the range of 11.9 to 13.4 percent. Globally he calculates that if all strongly and extremely degraded lands were restored there would be a 15 percent yield increase. Given the spectacular growth in global food production and the secular declines in grain prices over this period it is obvious that other factors must have compensated for the effects of degradation on aggregate performance.
30 The CGE model for Nicaragua, one of these three studies, finds a counter-intuitive positive effect of degradation on peasant consumption [Alfsen et al. (1996) reported in Scherr (1998)].
Simulations based on the global food production and trade model developed at IFPRI under different scenarios for degradation indicate that by the year 2020 an additional seven to nine million children will be malnourished under the assumptions of severe degradation. The baseline estimate from this model is two hundred and six million malnourished children (so that this would imply approximately one to three percent increases in the baseline). The results indicate that land degradation may not be as severe a problem during the next two decades or so, as many believe. According to the simulations, a decline in investment in agricultural research and infrastructure can produce downturns of a similar magnitude. These results highlight another problem of some concern; while the global picture may not be as bleak, the regional effect of land degradation can be expected to be quite severe in some countries, for example China and Pakistan.
Biot et al. (1995) have classified the main approaches to land degradation into three groups. These they term as: the classic; the populist revolution that shares characteristics with the neo-Marxist or world systems diagnosis of problems of land degradation and the neo-liberal counter revolution embodied in the approach taken by the World Bank.
The main characteristics of the three approaches as summarized by Biot et al. (1995) are presented below:
|
Main Approaches to Land degradation | |||
|
Variable |
Classic |
Populist |
Neo-liberal |
|
Structural causes of land degradation |
over-population, backwardness, lack of foresight, ignorance |
resource distribution, inappropriate technologies |
inappropriate property rights institutions, prices and rapid populn. Growth |
|
Immediate Causes |
mis-management by users |
mis-management by State, capitalists, TNCs big business |
poor government policies and bureaucratic rules and regulns |
|
Academic discipline; profession |
science; bureaucratic |
sociology; activist |
economics; development professional |
|
Research framework |
systematic empiricism |
Rapid/Participant rural appraisal, community as unit of analysis |
methodological individualism |
|
Technology |
soil conservation works particularly terracing |
agronomic techniques of conservation |
not specified |
|
Peasant behavior |
ignorant, irrational traditional |
virtuous, rational community minded |
rational, egocentric |
Source: Biot et al. (1995)
The authors find that these approaches are neither sequential nor mutually exclusive. The present emphasis on poverty as both a cause and an effect of environmental degradation is shared by both the neo-Marxist and the neo-liberal approaches. Concern with the issue of population pressures on natural resources which was a popular theme of the classic approach has also re-emerged in the neo-liberal counter revolution literature. These approaches differ basically in terms of the role of the State and in their emphasis on the structural and immediate causes of land degradation. They also differ in terms of the assumptions regarding peasant behavior and in the diagnosis of the problem. This classification emphasizes the perceptual nature of the problem identification and underscores the inability of the available innovations to address the issue. Biot et al. (1995) state the basic dilemma as follows: "Land degradation is perceived to be a problem, there are perceived to be many technological and institutional innovations that can solve them and these have been promoted by aid organizations - and yet these innovations seem not generally successful. Why?"
Answers to this dilemma lie in getting to the reality behind these perceptions to develop common perspectives. Detailed evaluation of the factors underlying these perceptions should bring together all the actors; the international and national research systems - the biophysical and social scientists, the donor/development agencies, governments at all levels and those who eke out a living from the land in the diverse situations around the world.
Poverty is increasingly viewed as a multidimensional concept. It has social and psychological effects that prevent people from realizing their potential [IFAD (1992)]. Measurement of poverty can include material deprivation, isolation, alienation, dependence, and lack of participation or freedom of choice of assets, vulnerability and insecurity.31 Introducing several such dimensions can seriously complicate the measurement problems. That is why most measurement is based on material deprivation32 generally linked to the inability of incomes to meet basic nutritional demands.
31 Isolation is defined in terms of lack of physical access to roads and mass communication. Alienation can be both functional and educational. Domination and dependence arise from tenurial relations. Agricultural families that are tenants and sharecroppers can be dominated by and be dependent on rural elites. Lack of participation in decisions involving their own well being result from the rural poor seldom belonging to formal groups or organizations. Lack of assets both physical and social, and vulnerability are important characteristics of the poor. There are several inter-linked socioeconomic processes that both create and perpetuate rural poverty. Amongst these, policy-induced processes that have a bias, which excludes the rural poor from the benefits of development generally, accentuate the impact of other poverty processes. Dualism as an important poverty perpetuating process. In most ex-colonial societies small and marginal farmers are hurt because resources starting with the best land are pre-empted by large, primarily export-oriented commercial farms [IFAD (1992)].32 Material deprivation can be reflected in serious protein and energy malnutrition. However, the evidence is mixed on the relationship between levels of poverty and levels of malnutrition. Studies in Pakistan find high levels of malnutrition amongst children whereas corresponding levels of poverty in other countries do not display the same levels of malnutrition [Malik and Malik (1992)].
Poverty is, thus, operationally defined as the inability to attain a minimal standard of living.33 Generally a consumption-based34 poverty line is used and estimates are made of the head count index, the poverty gap ratio and a severity of poverty index.35 The World Bank supplements the consumption-based poverty measure with others such as nutritional status, life expectancy, under five mortality and school enrollment rates in what it terms the Priority Poverty Indicators36 (PPIs). The World Bank is currently considered to be the largest repository of information on poverty in the world37. The research work at the Bank has confirmed that, in order to answer the question of how the poor have participated in the general improvements, it is necessary to move from aggregate data to more disaggregated survey-based household-level data. Without such disaggregated data it is impossible to conduct rigorous analysis of the decision-making processes of poor households38.
33 Three questions are relevant to operationalizing this definition: How to measure the standard of living? What is meant by a minimal standard of living? And having thus identified the poor how to express the overall severity of poverty in a single measure or index? [Lipton and van der Gaag (1993)]34 Expenditures are found to be better measures of welfare than incomes especially at the lower ends of the income distribution because these reflect the household's ability to borrow to smooth consumption.
35 The Forster-Greer-Thorbecke (1984) class of decomposable indices which are generally used as measures of poverty are presented in Annex 2.
36 Non-income measures of welfare can include anthropometric measurement especially of vulnerable groups such as children under the ages of five and pregnant and lactating mothers. The World Bank augments these direct income and non-income measures of poverty with information on socioeconomic aggregates that indicate for example the access to social services. Access to social services denote the "public" incomes that the poor enjoy from the provision of health, education and other services that governments provide; consumption of which generally does not show up in household surveys. The Living Standards Measurement Surveys LSMS of the World Bank are especially designed to measure such access in addition to the other information that is generally required for computing the poverty measures. Moreover, the LSMS provide an element of consistency in the information that is available. However, these LSMS surveys generally require enormous resources, which restrict the ability of the developing countries to institutionalize them. The lack of such institutionalization implies that the information is sparse. There are very few countries for which comparable data are available over time.
37 The World Bank has mandated that detailed poverty assessments be undertaken for all its client countries. In 1990 such assessments were available for eleven countries, which together accounted for forty percent of the total population of the developing world and for fifty percent of the poor. The older surveys were less reliable than the more recent ones. The World Bank first began conducting poverty assessments in 1989. Since then a total of eighty-four (seventy-five countries and nine updates) assessments have been completed covering approximately ninety percent of the world's poor.
38 Especially as these relate to the relationship with land.
Poverty measurement is difficult at the national level and even more so at the sub-national and household levels. The quality and reliability of the data, where available, are generally questionable. Census taking is generally in its infancy in developing countries. Increasing attention is only now being paid to the systematic collection of socioeconomic information through household representative income and expenditure surveys. The heavy costs involved generally imply that the data that such surveys yield are only representative at the national or at most sub-national level. Given the nature and distribution of poverty, such aggregate estimates can often be misleading. The ability to match the quantitative information with more qualitative data is generally severely limited by the even greater scarcity of the latter. Even where such information is available, meaningful integration is limited because these come from entirely different samples and have generally been collected for entirely different purposes. The problems of the reliability and non-availability of the basic information are compounded by problems associated in the measurement. The use of one cut-off point or poverty line for the country as a whole aggregates across tremendous heterogeneity and does not necessarily reflect the particular situation in a sub-region or segment. The use of a standard calorie requirement cutoff so fashionable in previous studies, for example, masked tremendous differences in minimum calorie requirements across regions due to differences in body structures, climate and levels of physical activity.39 In the case of estimates of rural poverty, for example, such estimates generally ignored incomes in kind from home production and to that extent may have been significantly biased upwards.
39 The use of the parity adjusted expenditure of $1/day/person, currently in vogue at the World Bank, has its own limitations [see Ravallion (1994, 1992)].
While considerable headway has been made at improving the quality of the aggregate poverty information there is still considerable variability in quality.40 This variability was confirmed by a recent report of the Operations Evaluation Department of the World Bank (1996).41 And while considerable headway has been made in counting the poor, considerably less has been done to explain why they are poor and in particular to explain what strategies for poverty alleviation work and why? While the need to move towards more disaggregated data and analysis is keenly felt there is no hard evidence available that shows that the poor as opposed to the non-poor behave differently in key aspects and especially in terms of natural resource management. The data available are generally at levels of aggregation that limit their usefulness for analysis of specific land degradation problems that generally have a locational dimension. The PPIs are available at the national level for the countries for which these have been collected. This limits the usefulness for understanding specific processes related to poverty and the relationship to other processes such as land degradation.
40 Poverty profiles answer the questions such as where are the poor? Who are the poor? Why are they poor? And is it transitory or chronic poverty? Why are they poor? A poverty profile is a simply instrument for making poverty comparison. These can show how poverty varies across sub groups of society, such as region of residence or sector of employment. A poverty profile can be extremely useful in accessing how the sectoral or regional pattern of economic change is likely to affect aggregate poverty. If the poverty profile shows that, for example, there is significantly more poverty in the rural farm sector than the non farm sector then a policy reform which improves farmers terms of trade is very likely to reduce aggregate poverty [Kanbur (1987, 1990)].41 Only 54% of the 46 poverty assessments evaluated in this study met with the requirements. Most were five years old and some were based on data that were more than ten years old. The report used the following bench-marks for evaluation: 1) inclusion of a profile of Priority Poverty Indicators (PPIs) 2) diagnosis of poverty 3) set of prescriptions for poverty reduction and 4) operational content of the prescription.
IFAD (1992) identifies five types of rural poverty. Material deprivation and alienation cause interstitial poverty, or pockets of poverty surrounded by power, affluence and ownership of assets. Material deprivation can combine with isolation and alienation to lead to peripheral poverty, which is, according to this study, found in the marginal areas. Material deprivation arising from population pressure and limits on resources will breed alienation and overcrowding poverty. Vulnerability to natural calamities, (e.g., drought) labor displacement, and insecurity, produces traumatic or sporadic poverty, which can be transitory but often ends up being endemic. Isolation, alienation, technological deprivation, dependence and lack of assets are also signs of endemic poverty.
This classification is important for linking the types of poverty processes to the types of poverty produced and the segments of the population affected.42 According to the IFAD (1992) study, environmental degradation leads to both transitory and chronic poverty (IFAD terms these as peripheral and endemic poverty) and affects smallholders, landless, nomadic pastoralists, ethnic groups, artisanal fishermen, refugees and households headed by women. The IFAD study contains an extensive classification of different types of poverty processes, the type of poverty that is produced, and the segments of the rural population affected by these, for 42 of the least developed countries. While this classification is helpful; given the nature of the data on which it is based, it is only indicative of the types of aggregate patterns. Given the heterogeneity of types that it indicates and the extremely aggregate available data that it marshals the study does not help in rigorously answering specific questions or in furthering the understanding of the interaction of the poverty and land degradation processes.
42 This full classification assumes that the international processes produce traumatic/sporadic poverty which affects small holders, refugees, and households headed by women. Domestic policy biases produce interstitial, peripheral, overcrowding, traumatic/sporadic and endemic poverty these processes affect small holders, landless, nomadic pastoralists, ethnic groups, artesinal fishermen, refugees and households headed by women. Dualism produces interstitial and peripheral poverty and affects small holders, landless, nomadic pastoralists, ethnic groups, artisanal fishermen, refugees and households headed by women. Population pressure leads to peripheral and over crowding types of poverty. It affects smallholders, landless, nomadic pastoralists and households headed by women. Environmental degradation leads to peripheral and endemic poverty and affects small holders, landless, nomadic pastoralists, ethnic groups, artisinal fishermen, refugees and household headed by women. Natural cycles produce peripheral, traumatic/sporadic and endemic poverty and affect small holders, landless, nomadic pastoralists, ethnic groups, artisinal fishermen, refugees and households headed by women. Gender biases lead to endemic poverty and affect households headed by women. Cultural/ethnic biases produce interstitial and endemic poverty and affect ethnic groups exploitative intermediation produces interstitial, peripheral and endemic poverty and affects small holders, landless, nomadic pastoralists, ethnic groups, artisinal fishermen and women. Internal civil strife leads to traumatic/sporadic poverty and affects smallholders, landless, nomadic pastoralists, ethnic groups, refugees and women [IFAD (1992)].
This IFAD (1992) study remains to date the most extensive analysis of its kind available in the literature on rural poverty. Based on information for the late 1980s, this study estimated that over 80 percent of the poor people in the 114 countries for which it analyzed available data were based in the rural areas. In the 42 least developed countries, the study found that as much as 69 percent of the total rural population lives in poverty. This figure was 31 percent for Asia, (46 percent if China and India are excluded), 60 percent in Sub-Saharan Africa. 61 percent in Latin America and the Caribbean and 26 percent in the Near East and North Africa. In absolute terms these percentages translate to 633 million in Asia, 204 million in Sub-Saharan Africa, 27 million in the Near East and North Africa and 76 million in Latin America and the Caribbean.
Substantial improvement in aggregate global welfare has been achieved over the past few decades. For example, between 1965 and 1990, world food production grew by 90 percent43 while population rose by 60 percent. This growth has, however, not been uniformly distributed44 The increase in food production has resulted largely from yield increases. It is estimated that 93 percent of the incremental cereal output is due to intensification alone. Area expansion remains important in Africa and Latin America accounting for 40 percent and 32 percent, respectively, of cereal production increases over this period [Mink (1993)]. Average consumption per capita in developing countries has also increased by about 70 percent in real terms; average life expectancy has risen from 51 to 63 years; and primary school enrollment rates have reached 89 percent. If these gains were evenly distributed, much of the world's poverty would be eliminated.
43 The growth in agricultural production has resulted from the expansion of the agricultural systems; use of chemical fertilizers, pesticides, tools and machinery; improved seeds; and, land-improving investments particularly irrigation and drainage.44 In Sub-Saharan Africa cereal production increased by only 60 percent while population increased by 105 percent.
The lack of comparable estimates of poverty over time makes it difficult to evaluate trends. However, based on heroic attempts to obtain comparable and consistent data sets, the consensus appears to be that growth, even when it is associated with rising inequality, has led to poverty reduction [Fields (1980), World Bank (1990, chapter 3) and Squire (1993)]. Ravallion and Datt (1994) estimate that the historical elasticity of the poverty head count measure to mean consumption is about minus 1.5 for India. Bell and Rich (1994) estimate that the rural poverty head count responds to real agricultural output per head, with an elasticity of minus 1.5 to minus 0.8, depending on model specification.
Nearly all available studies agree that agricultural growth (especially growth and stabilization of food staples production) is likely to benefit poor people.45 There is some evidence to indicate that the level of initial inequality of incomes and of assets determines - the degree to which growth is translated to reduction in poverty [Lipton and Ravallion (1995)]. The evidence on the relationship of growth to inequality is however, mixed.
45 Some examples where agricultural growth is not necessarily pro-poor also exist [see Cohen (1975)]. However, the general experience is that agricultural growth works in several ways to improve the welfare of the poor. Its large direct and indirect multipliers on income and employment open up avenues for the poor to participate in the growth process.
The World Bank Policy Research Department has an active program focusing on establishing consistent patterns in the relationship between growth, inequality and poverty. Deininger and Squire (1996) and Ravallion and Chen (1997) present results based on household data sets for a number of countries. While these "new" household data sets represent improvements in quality and coverage it is important to bear in mind the differences in definitions in the underlying data sets on which these estimates are based. While the authors do consistently warn users to keep such inadequacies in mind, it is easy to loose sight of these warnings and focus only on the aggregate results that are brought out. Mindful of the limitations such as the lack of tests for sensitivity and robustness and the large number of factors identified by the authors that could affect cross country comparisons, the study by Deininger and Squire (1996) could find no systematic link between growth and changes in inequality. The study found, however, a strong positive relationship between growth and reduction in poverty. A later study by Ravallion and Chen (1997) uses a larger number of household surveys to define "spells" from 67 countries between 1981 and 1994 to conclude that changes in inequality and polarization were uncorrelated with changes in average living standards. The results of the relationship between inequality and growth were at best mixed. However, "almost always poverty fell with growth in average living standards and rose with contraction" [Ravallion and Chen(1997)].
The relationship of poverty and land is intimate, given the prevalence of poverty in rural areas. Countries that are classified as low income have much higher shares of agriculture in GDP and even higher shares of rural labor force as compared to the industrial market economies [World Bank (1990)]. Typically, the share of agriculture in gross domestic product in the low-income countries is about 30 percent while the proportion of total labor force in agriculture is about 68 percent. The corresponding figures for the industrial market economies are 6 and 2 percent, respectively [World Bank (1997)].
Quibria and Srinivasan (1991), in a comparative study of seven Asian developing countries in the late 1980s, showed that rural poor depended more on agriculture than the rural non-poor did. This has also been observed in West Africa [Reardon et al. (1992)]. The welfare of rural non-farm households also depends substantially on the forward and backward production and consumption linkages from farmers [Chuta and Liedholm (1981), Hazell and Haggblade (1993) and Hazell and Ramasamy (1991)]. "Given the high labor intensity and relevance to local food availability and prices of agricultural products most anti-rural-poverty strategies for production activities are based substantially on agriculture" [Lipton and Ravallion (1995)].
The lack of land and rural poverty are generally observed to coexist [Ravallion and Sen (1994)]. Generally three forms of interventions are suggested to improve the access of the poor to land [IFAD (1992)]. These are redistribution of ownership rights, regulation of tenancy contracts and the role of land titling.46
46 There is a belief that traditional tenure systems can achieve development objectives only under low population density but are not compatible with rapid economic change and large increases in population pressure.
Improved equity and efficiency are generally put forward as justifications for land redistribution. Operationally, the implementation of such programs has been strongly affected by political realities. Redistribution implies increasing intensification with possible negative consequences for land degradation. At the same time, redistribution is expected to improve access to credit so necessary for the use of inputs. This can facilitate investments in land-improving and maintaining technologies.
Tenancy reforms are also advocated on the basis of equity and efficiency. Such reform can however, also increase landlessness through large-scale eviction as evidenced in South Asia. And within the different forms of tenancy arrangements, a move away from share cropping arrangements can imply a reduction in traditional risk sharing arrangements with potential resultant pressures for resource degradation.
Land titling can have both positive and negative effects. The African experience bears this out. Theoretically, land titling is considered important for increasing tenure security with a view to improving investment in land and water conservation. It is also held to improve access to capital inputs and the adoption of permanent crops. It further provides the collateral for ensuring increased access to institutional credit and for promoting land markets deemed to be so essential for the development of commercial agriculture. Lack of title can bias the farmer's decision towards short-cycle crops. Operationally, however, the wealthier farmers can exercise their influence to obtain greater rights [IFAD (1992)]. Such titling can lead to likely negative effects on women through increased cultivation of commercial crops that men generally tend to control [von Braun and Kennedy (1986)].
Income derived from common property resources is much more important to the rural poor than to the non-poor especially in the arid and semi arid regions. The studies by Jodha (1985, 1986, 1991) show that common property resources accounted for 20 percent of the income of households cultivating less than two hectares (including landless households) and between 1 and 2 percent amongst the non-poor households in 21 groups of villages in India. These studies also show that common property resources declined sharply in area and productivity between the mid 1950s and the mid 1970s. However, "it is the combination of more people, high interest rates and other "short-termist" incentives, scarce land and inadequate technical progress that threatens to validate the claim that population growth in rural areas causes resource degradation - and to do so whatever the structure of property rights" [Lipton (1997a, p. 89)].
Rural poverty also implies that the "wrong crops" may be grown. In sub-tropical conditions most export crops (except cotton and groundnuts) tend to be less damaging to the soil than cereals and root crops. Most export crops grow on trees and bushes and have a continuous root structure and provide canopy cover. Repetto (1988) shows that, with grasses planted underneath such export crops, the rate of soil erosion is substantially less than with food crops.47 Moreover, poor people are constrained in their access to credit, insurance and capital markets. These conditions get translated into larger herd sizes especially in times and places that have a high risk of draught and the possibility of greater mortality amongst the herds. These extra animals can lead to overgrazing and land degradation.
47 However, the fact that women control food while men control cash crops can generally translate into reduced incomes of women with increasing commercialization and to the resultant deterioration in the nutritional status of the families [see for example von Braun and Kennedy (1986)].
Mechanization that is labor displacing (especially if is subsidized) can have negative impacts on poverty [Binswanger and van Braun (1993), Mellor and Desai (1985), Bell and Rich (1994), Ravallion and Datt (1994), Lipton with Longhurst (1989)]. Lack of alternative sources of employment can lead displaced families to scavenging off the land and common property resources leading to land degradation. The impact of irrigation on poverty is much less clear and depends on the technical features of the type of system used [Narian and Roy (1980)] However, the processes through which irrigation leads to increasing soil salinity are well documented in the ecological literature [see for example Ehrlich, Ehrlich and Holdren (1977)].
Rigorous analyses of the differential behavior of poor versus non-poor households in terms of land degradation are sadly deficient. Such analyses require specifically collected data and detailed modeling of the household decision making processes. Collecting such data is a resource-intensive process and often requires skills that are not generally available in developing countries. Cost constraints generally imply small and often "non-representative" samples. This leads to the obvious questions of the generalizability of the results. There is a strong need to replicate such studies in as many situations as possible to be able to build up a body of knowledge for which conclusions can be generalized.
The marginal lands study [Nelson et al. (1997)] had noted the great limitation in the understanding of the nature and distribution of marginal lands and the lack of readily available data in a geo-referenced framework, in particular with respect to the incidence and nature of poverty and probability of land degradation by land type. The World Resources Institute under a contract with UNEP/GRID/Arendal is conducting such a study [Henninger (1997)]. This work is part of the ongoing project to strengthen the use of geographic information systems in agricultural research48 and extends the previous work done by the World Resources Institute in mapping indicators of human development for West Africa. The set of poverty indicators used by the World Bank have been expanded to include accessibility (i.e., the degree to which people have access to resources) and vulnerability (low income groups who face high income uncertainty because of natural resource degradation). By including vulnerability defined in this way the researchers are hoping to identify a large proportion of people who can be easily pushed into poverty when the natural resource sector they depend on for their basic needs is being degraded.
48 The idea of defining and mapping major regions of the world in terms of climate, soils and natural vegetation as an aid to agricultural planning is not new. Systems of classification date back to the 1930s. [Koppen and Giger (1936), Troll and Paffen (1965), and Papadakis (1975) reported in Henninger (1997)]. These have proved useful in the work of the international agricultural research centers.
Henninger (1997) notes that the degree to which individual or geographic factors are causing poverty has implications for developing a strategy for agricultural research, which tends to improve the situation of the poor. If geographic factors play an important role then geographic targeting of agricultural research to the poor in these areas can become a useful tool to address poverty issues. This, of course, assumes that the ability of individuals to migrate out of these marginal areas is restricted. There is some evidence to support this assumption. The work by Ravallion (1994) shows significant spatial effects on living standards after controlling for non-geographic characteristics. These he terms as spatial poverty traps.
The data limitations for mapping marginal lands in most developing countries were highlighted by the Marginal Lands Study [Nelson et al. (1997)]. The soil and length of growing period maps used to define the marginal agricultural lands and the favored agricultural lands included no information on land cover or use. Population data were only available at the first sub-national level and a constant poverty rate was applied for all areas within a country [Henninger (1997)]. Such data limitations were also evident in the IFPRI study by Broca and Oram (1990). These shortcomings will, however, remain till more detailed data become available. The World Bank's Living Standards Measurement Surveys and the Macro International's Demographic and Health Survey data sets which are the most likely sources of data for the socioeconomic aspects of such endeavors were originally designed to yield results representative at the national level. These were originally not intended to be broken down by sub-national units.
The usefulness of these mapping exercises is constrained by the aggregate level of the available comparable information. Ranking of countries and territories according to the rural poverty dimension needs to be strengthened with more disaggregated information from several sources to make such exercises more effective for prioritizing research activities. Where the research mandate already has a clear natural resource mandate such rankings can assist in effectively prioritizing activities [e.g., ICARDA (1997)].