Appendix C-1 - ISNAR. Proprietary Biotechnology Inputs and International Agricultural Research
Appendix C-2 - June Blalock. Interviews with Selected Commercial Companies and Universities
Appendix C-3 - E. Binenbaum and B. Wright. On the Significance of South-North Trade in IARC Crops
Joel I. Cohen, Cesar Falconi, John Komen, and Michael Blakeney
New inputs derived from biotechnology, especially those coming from the private sector, are finding wide utility in agriculture. This is made evident by the number of products reaching fields and markets in industrialized countries and the amount of ongoing cross-licensing of biotechnology products by commercial agricultural research organizations. Most of these inputs are protected through some form of intellectual property rights (IPR). However, it is not only the commercial sector that is using and developing materials for which intellectual property protection is being sought. The development and use of protected materials is also occurring among public, national, and international agricultural research organizations working for and with developing countries.
International agricultural research, including the centers of the Consultative Group on International Agricultural Research (CGIAR) and the national agricultural research organizations (NAROs) of developing countries, is affected by these trends. Changes in proprietary rights as they relate to agricultural research are particularly relevant to the international agricultural research centers (IARCs) of the CGIAR because of two related developments: First is the increasing importance of biotechnology in the centers<@146> research. Second is the growing position of the private sector in international agricultural research. As a consequence of these changes, and on behalf of the CGIAR Expert Panel on Propriety Science and Technology, ISNAR studies the magnitude of, and procedures for, the use of inputs protected by IPR at selected IARCs.
This Briefing Paper presents the most important findings and lessons of that study. It highlights the challenging environment in which agricultural research organizations are working with regard to biotechnology. As such, it documents the difficult and often confusing situations that these institutions face regarding the use and dissemination of products resulting from proprietary science where rights are held by others.
Introduction
Proprietary technologies and materials are those that are privately owned, managed, or protected through some sort of intellectual property rights (IPR). Such materials and technologies may have restrictions put on their use. This occurs at the research stage. Or it may happen later, when products derived from the protected materials are ready for wide dissemination. A growing number of research inputs are protected as intellectual property. The use of such protected, or proprietary materials and technologies in seven IARCs is the focus of this study.
Since the early 1980s, the IARCs have invested in building up their infrastructure and human resources for biotechnology research. By now, most IARCs have specialized units or divisions for molecular biology and other techniques covered by the term biotechnology. According to recent figures from the Technical Advisory Committee (TAC) of the CGIAR, the centers are spending about US $24 million per year on biotechnology research. Of that amount, about 27 percent is related directly to livestock (primarily animal health). Roughly 15 percent of the total expenditure goes to genetic engineering. For the CGIAR's client countries, the IARCs have become a key player in agricultural biotechnology. Although their combined research and development investments in agricultural biotechnology may be small compared to leading private-sector companies, the IARCs have developed an extensive network of research collaboration with advanced research institutes, public and private, in both industrialized and developing countries.
In step with the CGIAR's growing involvement in biotechnology, concerns have arisen about IPR. IPR protection for agricultural inventions has been strengthened in past decades, with a growing number of countries allowing for the protection of living material under their patent laws. Plant breeders' rights have also been introduced or strengthened. The resulting ability to legally protect agricultural innovation has stimulated the involvement of the private sector in agricultural research. In addition, many advanced public-sector research organizations and universities now routinely protect their research results. This situation may create difficulties for the IARCs in accessing, using, or protecting relevant technology.
Discussions on IPR in the CGIAR have been many, and will not be repeated here. To date, however, the CGIAR has formulated no general policy regarding IPR. In 1996, it adopted "guiding principles" on genetic resources and intellectual property. These principles reaffirm that the resources maintained in the gene banks at the centers should be freely available, and that the centers should not seek legal protection for their innovations unless it is absolutely necessary to ensure that developing countries have access to new technologies ("defensive patenting"). The centers should not seek intellectual property protection for income-generating purposes and will not view potential returns from intellectual property protection as a source of operating funds. The 1996 document also states that any IPR acquired by a center should be exercised without compromising in any manner whatsoever the fundamental position of the CGIAR regarding free access by developing countries to knowledge, technology, materials, and genetic resources.
The CGIAR has discussed how it can best use biotechnology to address CGIAR research objectives. At the CGIAR Mid-Term Meeting in May 1997, two expert panels were established to explore this question. One panel was to address general issues in biotechnology. Another focused on issues of proprietary science and technology. The latter panel was to explore legal issues and their ramifications regarding proprietary science and the complex partnerships arising in agricultural research. The panel felt that gaining an understanding of the current technologies and practices employed by the various centers would be an important first step in this process. The study summarized in this Briefing Paper was done on behalf of this CGIAR expert panel. It is designed to be a first step in a long-term project focusing on developing countries' access, use in research, and dissemination of products resulting from proprietary biotechnology inputs.
Purpose and Methodology of Study
Purpose
The purpose of the study was threefold: (1) to provide an assessment of the extent to which proprietary applications of biotechnology (technologies and materials) are being used in the IARCs, (2) to present potential legal implications for consideration by the IARCs regarding use of the identified proprietary technologies and materials, and (3) to synthesize findings and recommendations with the aim to stimulate further discussion of the study.
Methodology
ISNAR conducted a survey among CGIAR centers regarding the application of proprietary research inputs and prospects for generating proprietary products from these inputs. It first constructed a list of the most relevant proprietary technologies and materials with the assistance of several technical experts. It grouped the technologies and materials into eight categories as follows: (1) transformation systems, (2) promoter genes, (3) insect-resistance genes, (4) disease-resistance genes, (5) selectable marker genes, (6) genetic markers, (7) diagnostic probes, (8) others.
Two survey tables were developed to determine which proprietary technologies or materials from the categories above are being used at the centers. On the first table, respondents were asked to provide information on specific applications, the means by which intellectual-property protection is provided (patents, plant breeders' rights, or other means), and how the center obtained permission for research (e.g., material transfer agreement (MTA) or license). On the second table, information was requested on the research products to be derived from the technologies or materials identified, the dissemination of results from this research, and if any intellectual-property protection was to be sought by the center.
Following consultations with the chairperson of the panel on proprietary science and technology and with TAC, ISNAR selected seven centers to complete the survey. The selected centers reflect a balance between research on cereal crops, noncereals, and other categories of research. ISNAR initially contacted the centers in December 1997 by approaching their respective directors general and subject-matter specialists. All seven centers returned their completed survey forms during the second half of December. The data received were organized using data-base management software that facilitated the analysis of qualitative information. Separate records were generated for each of the specific proprietary technologies and materials reported by each center. This method of data entry created many individual records, helping to preserve data uniqueness. The accuracy of the data entered was later confirmed by each responding center, as well as the text and findings of the initial report.
Confidentiality
Confidentiality was essential for conducting the survey in a timely manner. Therefore, specific information collected from each IARC is not presented. Rather, the study and this report focus on systemwide trends and recommendations on the use of proprietary science in the IARCs and their collaborative partners.
Analysis of the Data
All the centers that responded to the survey currently use proprietary inputs for biotechnology research. In total, 46 discrete technologies and materials were reported over the eight technology categories introduced above. Most centers apply these technologies and materials in research on several mandated commodities. ISNAR recorded 166 applications of proprietary research inputs. Of the technology categories surveyed, three had the broadest utility across centers: selectable marker genes, promoters, and transformation systems (table 1). This clearly demonstrates the important role that proprietary technologies and materials have assumed in IARC research, as is true for advanced research centers globally.
While some proprietary technologies and materials are being applied in a research-only context, others become part of germplasm or other products suitable for dissemination to national agricultural research institutes, nongovernmental organizations (NGOs), and other IARC research partners, or even directly to farmers.
Utility across research categories
Table 1 groups the various technologies and materials into three research categories. Based on a list of possible research targets for the CGIAR centers, the categories were defined as follows:
Cereals: maize, rice, wheat, sorghum, finger millet and pearl milletNon-cereals: beans, cassava, tropical forages, potato, sweet potato, chickpea, cowpea, pigeonpea, groundnut, lentils
Other: diagnostics, livestock health, microbial systems, general technology development
Table 1. Applications of proprietary technologies and materials by research category
|
Technology category |
Number of applications per research category |
|||
|
Cereals |
Non-cereals |
Other |
Total |
|
|
Selectable markers |
17 |
25 |
2 |
44 |
|
Promoters |
18 |
14 |
3 |
35 |
|
Transformation systems |
12 |
14 |
3 |
29 |
|
Insect-resistance genes |
8 |
11 |
0 |
19 |
|
Disease-resistance genes |
6 |
5 |
0 |
11 |
|
Genetic markers |
4 |
4 |
2 |
10 |
|
Diagnostic probes |
0 |
0 |
3 |
3 |
|
Others |
7 |
6 |
2 |
15 |
|
Total |
72 |
79 |
15 |
166 |
Survey results reveal an almost equal use of inputs among centers working on cereal and noncereal crops, with fewer applications recorded at the noncrop centers and programs. The distinction reflects the emphasis placed on crop research in the CGIAR.
Means of Protection and Permission for Use
Figures 1 and 2 describe the means by which the technologies and materials are protected, and how the centers obtained permission for use. Not all of the proprietary inputs pose difficulties related to intellectual property or the dissemination and use of resulting products. Nonetheless, it is appropriate for centers to explore any such potential difficulties.
Figure 2 shows that for more than 30 percent of the applications of proprietary technology, centers were not able to obtain clear knowledge or information regarding the type of IPR provided for a particular proprietary tool. Therefore, depending on the actual means of protection involved, there is potential for inadvertently infringing on legal conditions regarding the use of these inputs. In addition, figure 2 shows that more than 35 percent of the applications are being used without any written agreement. This leaves centers in an unclear position as to their legal responsibilities, both to the owner of the technology and to other research partners. Situations where there is a lack of information about conditions for using these inputs are now under study by the IARCs.
Figure 1. Proprietary technologies and their means of protection
Figure 2. Proprietary technologies and their permission for use
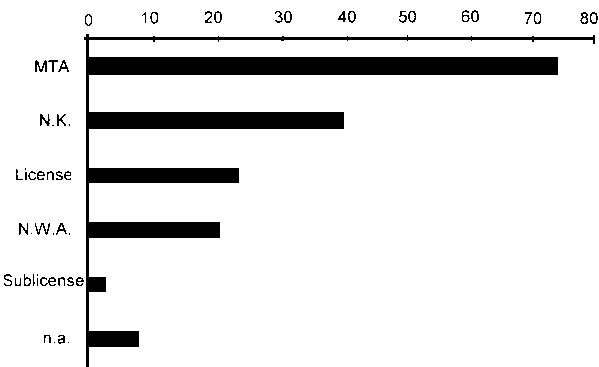
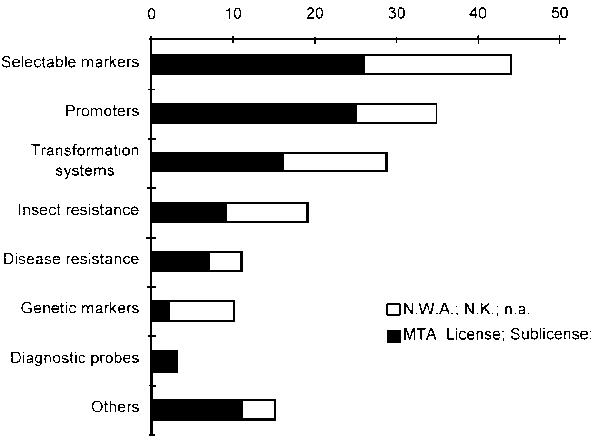
Figure 3 shows that in cases where permission for use was obtained, it is generally achieved through MTAs, licenses, or a sublicense. However, for each technology category, except diagnostic probes, the centers are using a number of technologies and materials without written agreement, or for which permission status is unknown. Obtaining permission is the general rule. But exceptions do exist. There are, for example, cases of transformation systems where the permission to use specific systems is unclear. Similar problems exist for the use of selectable markers, genetic markers, and various insect and disease resistance genes. However, it should also be noted that while MTAs may secure permission for research, they do not generally confer permission for subsequent dissemination.
Figure 3. Agreements and potential difficulties in permission to use proprietary technologies and materials
Products and dissemination
The survey sought information on whether research products were expected that may encounter difficulties in their dissemination. The purpose for using these inputs is to develop a product, such as improved crops, animal health products, new genetic constructs, or new research methodologies. Survey results showed that the IARCs expected 58 outputs or products (table 2). Based on the fact that inputs are proprietary, restrictions may exist for their use, dissemination, or further production.
Table 2. Products Expected from the Application of Proprietary Tools
|
Product category |
Number of expected products reported |
Examples |
|
Improved crops |
36 |
Improved cereal and non-cereal varieties with enhanced insect-, fungal-, and virus resistance |
|
Diagnostics |
11 |
Diagnostic tests for tropical livestock diseases |
|
Vaccines |
1 |
Vaccine for East Coast Fever |
|
Others |
10 |
Transformation protocols, genetic markers |
More than 40 percent of the responses indicate that centers do not have enough information or knowledge to anticipate difficulties in the post-research use and dissemination of outputs that are generated from proprietary technologies. Consequently, one could imagine that some outputs developed with proprietary technologies will encounter problems in their use and dissemination, especially if exports are involved to countries where the technologies are protected. Many IARCs have yet to take into account extensions of protection and permission requirements for such technologies.
A few centers have considered the implications of legal agreements for disseminating research outputs, with 14 percent of the responses foreseeing some limitations. For example, a contractual arrangement between an IARC and a private multinational as owner of the input technology specifies that outputs can be distributed only in certain countries. In this case, there is an ex ante understanding of the restrictions and limitations for dissemination that should be studied further by the CGIAR. Such studies have already begun on a center-by-center basis.
IARC Patents
Along with other institutions producing international public goods, the CGIAR is considering options to ensure that developments from its research programs will be able to reach their intended beneficiaries. According to the End of Meeting Report of the CGIAR's International Centers Week 1997, "The CGIAR stands for free flows of germplasm and it has no profit motive. However, it may have to think of defensive patenting in order to stake out a claim and ensure access."
With this in mind, the ISNAR study assessed the degree to which centers are planning to patent or otherwise protect inventions. As shown in table 3, only three outputs were identified that may be patented. Centers anticipated the use of other protective measures for 11 outputs. This limited amount of intellectual property protection being sought by centers can be attributed to many factors, including lack of familiarity with IPR issues, the fact that suitable IPR options are not yet developed and approved, and the traditional reliance on goods and services developed as international public goods. Further, many bilateral donor and civil society organizations are opposed to applying IPR protection to products of IARC research, making it a highly controversial issue.
Table 3. Do centers expect to file for registration or protection of new products?
|
Product category |
Means of protection or registration |
||
|
No |
Yes |
Maybe |
|
|
Improved mandate crops |
19 |
1 (patent) |
16 |
|
Diagnostics |
- |
11 (other) |
- |
|
Vaccines |
- |
1 (patent) |
- |
|
Others |
4 |
1 (patent) |
5 |
Legal Analysis and Options
Using MTAs
As shown in figure 2, the most common legal arrangement by which centers obtain permission for use of proprietary inputs is through MTAs, followed by licensing. This extensive use of agreements and licenses is a new fact of life for publicly funded agricultural research. Given the various legal obligations (discussed below) that are generated by MTAs, the popularity of the MTA as a means of obtaining proprietary technologies, and the likelihood that MTAs will be formulated and imposed by the technology supplier, the CGIAR system may wish to review and use standard formats for MTAs.
Enforcement of obligations
Where legal obligations are imposed by MTAs, the relevant center must be in a position to honor its obligations under the agreement. For example, where the proprietary technology involves the supply of a trade secret and confidentiality obligations are imposed, the center must be able to police the handling of the material supplied. This may require the establishment of a secure system of operation and placing researchers and visitors under confidentiality obligations. In the event of a default under an MTA, the CGIAR center is most likely to be the defendant in a legal suit rather than the individual actually responsible for an infringement. This is because it is the center that is the signatory to the MTA.
The increasing legal complexity involved in the supply of proprietary technologies may raise matters of contract law, intellectual property law, biodiversity and biosafety law, technology transfer, and competition law (where restrictive provisions are imposed). These increasing legalities indicate the need for IARCs to have a primary legal administrator. The administrator would ensure the compliance of staff with obligations generated by MTAs, as well as ensure the center's compliance with the terms of intellectual property licenses. Because MTAs and licenses are among the most common ways that centers acquire proprietary technologies, it should be reiterated that MTAs, licenses, and sublicenses impose direct legal obligations upon the centers.
The importance of research institutes' understanding and monitoring their legal obligations is illustrated by the recent controversy regarding germplasm held under "in trust agreements," as reported in the New Scientist of February 14, 1998. The report concerned two agricultural research institutes that sought plant breeders' rights for material held "in trust" and provided by a CGIAR center. The center distributed the requested material using its standard genetic-resource MTA, which strictly forbids the application of any IPR covering the material's use. However, the recipient institutions applied for plant breeders' rights not fully understanding that seeking such protection was fundamentally opposed to the intent of the center's MTA and of the materials' designation as held in trust.
Management of proprietary tools
Where different CGIAR centers are using the same category of proprietary tools, it may be advantageous to cooperate in the acquisition of such technologies. For example, the survey indicates that CaMV/35S is the promoter of first choice among the centers. Here, the opportunities for coordination are evident. Precedents for such coordination have been set for research collaborations supported by international biotechnology research programs.
For 37 percent of the 58 products reported in table 2, no dissemination constraints due to legal arrangements are expected. For 40 percent of the products, the centers reported not knowing if such constraints exist. These statistics indicate the need for CGIAR centers individually and as a system to (i) develop IPR expertise to analyze potential limitations and (ii) designate an officer to administer legal obligations.
For example, one center's policy provides for intellectual property protection in exceptional circumstances "to ensure availability to developing nations of advanced biological technologies or biological materials" and for new agricultural equipment. It also states that the center "will devise, maintain and monitor employee policies on intellectual property rights...and policies or agreements to govern its relations with visitors and research collaborators." The implementation of principles such as these will obviously require an internal system of intellectual property management. The high percentage of applications reported where IPR implications are "not known," suggests that there is work to do in this regard.
The April 1994 Agreement on Trade Related Intellectual Property Rights (TRIPs) presents membership obligations for joining the World Trade Organization (WTO). These include a requirement that signatory countries protect plant varieties through either patent protection or a sui generis system. The presence in the TRIPs agreement of mandatory obligations concerning the introduction of plant varietal rights provides additional reasons for CGIAR centers and NAROs to familiarize themselves with IPR obligations.
Lessons and Recommendations for IARCs and NAROs
ISNAR has derived a number of lessons and recommendations from the study to be considered by the expert panel on proprietary science and technology, by the IARCs, and collaborating NARO partners. These are as follows:
Extensive use of proprietary inputs in center research
The study shows the extent to which CGIAR centers are using and integrating biotechnology into their ongoing research programs. The centers have moved from a phase in the 1980s, when biotechnology was virtually nonexistant, into a phase where such technologies and materials are being used to develop a new generation of inputs. Many of these inputs are products arising from transformation.
Recommendation. CGIAR centers and NAROs may wish to acknowledge the use of proprietary technologies and materials in their research programs as one means of demonstrating collaboration and highlighting the scale of such contributions. Where several centers are using the same proprietary tools, it may be advantageous to collaborate in the acquisition of such technologies.
Extensive use of MTAs
Proprietary technologies and materials that were developed by or are under the protection of private-sector research organizations have made important contributions to the centers' work. The extensive use of such materials means that as centers take on the transformation of mandate crops, the development of vaccines and diagnostic probes, and provide for marker-assisted breeding, their dependence on licenses, MTAs, and other agreements with the private sector increases.
Recommendation. Experiences with MTAs and their conditions should be analyzed and exchanged among centers and NARO partners. Possibilities for standard formats should be explored and legal implications determined regarding possible restrictions on use and dissemination.
Limited IPR sought by centers
All of the centers surveyed indicated that they are using applications of biotechnology that are protected by others. They also reported receiving these materials and technologies through many avenues. However, implications for the eventual dissemination of products is often unclear. While the technologies received by centers are numerous, the number of products expected to be patented or otherwise protected by the centers is very low.
Recommendation. Given the range of proprietary technologies being used, and the potential for limited protection sought for developments from the IARCs themselves, guidelines for managing intellectual property at the centers should be reviewed and possibilities for a system-wide policy or guidelines considered.
Partners in a challenging environment
Many centers have formed partnerships with NAROs to undertake joint or contractual biotechnology research, receiving access to proprietary materials though such agreements. The technology or licensing agreements held by these partner organizations may cover the use of proprietary inputs by the centers. In other cases, partner organizations may hold their own rights to inputs. In that case, the centers expect that they are undertaking research consistent with the mission of the CGIAR to produce international public goods. However, such partnerships may only cover the actual research. The use and dissemination of products may be a matter for further negotiation. This highlights the need for increased IPR consultations.
Recommendation. Consistent, system-wide legal advice is urgently needed, given the limited familiarity with the implications of using proprietary technology, the fact that some of inputs have global utility, and the intention that some of these applications will become available to NAROs, NGOs, and other CGIAR partners through new products. Immediate legal advice must be acquired for those applications of proprietary tools for which permission for use is unclear.
International, regional, and national implications
Much of the CGIAR's knowledge of what products and processes are protected focuses on regions such as North America and the European Union. There is less knowledge for other regions. Such knowledge is usually acquired when a center develops a product for the country or approaches the IPR holder regarding a license. Also, there is the issue of legal deployment of a protected product in a country, only to discover later that the country wants to export the product into a country where a license is required. What obligations do the IARCs have in this regard, especially in the face of the rapid evolution of the entire IPR arena?
Access to a new generation of technologies
A few implications of the study illustrate the complexities for the centers regarding use of newer, more advanced technologies. Centers are not always clear as to how they receive authorized use for proprietary inputs. The centers have benefited from proprietary technologies and materials because they are in common use, but this also means that they are "older generation" technologies or materials. Centers not able to obtain authorized use could have more limited access to recent or improved technologies.
Recommendation. The CGIAR should foster greater IPR awareness by developing system-wide expertise for managing intellectual property, providing an economy of scale for the individual centers. No center alone can afford to establish in-house capacity, and the CGIAR could negotiate much stronger collectively. A central facility would also help keep centers aware of changes in national IPR positions.
Conclusion
This Briefing Paper has examined the results of a survey conducted by ISNAR on the use by the CGIAR centers of materials and technologies protected by proprietary rights. The survey findings indicate a pressing need for establishing competent legal expertise in issues of proprietary rights for the CGIAR centers and their NARO partners. Based on the lessons of the study, it proposes seven recommendations:
· CGIAR centers and NAROs may wish to acknowledge the use of proprietary technologies and materials in their research programs as one means of demonstrating collaboration and highlighting the scale of such contributions.· The CGIAR should foster greater IPR awareness by developing systemwide expertise for managing intellectual property, providing an economy of scale for the individual centers. No center alone can afford to establish in-house capacity, and the CGIAR could negotiate much stronger collectively. A central facility would also help keep centers aware of changes in national IPR positions.
· Where several centers are using the same proprietary tools, it may be advantageous to collaborate in the acquisition of such technologies.
· MTA experiences and conditions should be analyzed and exchanged among centers and NARO partners, possibilities for standard formats could be explored and legal implications determined regarding possible restrictions on use and dissemination.
· Given the range of proprietary technologies being used and the potential for limited protection sought for IARC developments, guidelines for managing intellectual property at individual centers should be reviewed, and possibilities for a systemwide policy or guidelines considered.
· Consistent, systemwide legal advice is urgently needed, given the limited familiarity with the implications of using proprietary technology, the fact that some of inputs have global utility, and that some of these applications will become available to NARS, NGOs and other partners through new products.
· Immediate legal advice must be arranged for those applications of proprietary tools for which permission for use is unclear.
About the Authors and this Briefing Paper...
Joel I. Cohen is project manager of ISNAR's Intermediary Biotechnology Service. Cesar Falconi is economist and research officer. John Komen is the project's information specialist. Michael Blakeney is director of the Murdoch University School of Law at Murdoch Western, Australia. The study on which this report is based was supported through a grant to ISNAR from the CGIAR Secretariat. ISNAR wishes to express its appreciation to the individual IARCs that participated in this study and made this report possible. The original study was submitted as Appendix C-1 to the Report of the CGIAR Expert Panel on Proprietary Science and Technology.
ACCESS TO THE PROPRIETARY SCIENCE OF OTHERS
A preliminary informal survey of intellectual property owners was conducted to determine whether it would be possible to obtain authorized access to protected technologies and materials for applications important to the mission of the CGIAR. Five multinational corporations which own plant biotechnology-related intellectual properties in multiple jurisdictions were contacted, as well as five major U.S. land grant universities with extensive agricultural research programs. In order to obtain candid responses, the parties interviewed were assured anonymity. All interviewees have responsibilities for managing and licensing intellectual properties for their respective organizations. None have policy-making authority, although all have input into policy decisions regarding intellectual property matters.
The corporations were asked the following questions:
1 - Does your company have any ongoing or previous working relationship(s) with any CGIAR center(s)? If so, what type of relationship(s)? With which center(s)? If not, for what reasons?2 - Does your company currently market products in any country(ies) where CGIAR centers are located [list provided]? In other developing countries? What are your marketing plans in these countries for the near future? Do you find intellectual property protection necessary and/or useful in these markets?
3 - Would your company be interested in/willing to cooperate with the CGIAR to make new technologies available to the world's poor?
4 - Under what general terms have you/would you be willing to make company-owned proprietary technology available to the CGIAR centers for research? For local distribution? For export to other countries?
5 - Would the availability of intellectual property rights for technologies/materials developed at the CGIAR centers make possible future working relationships with the centers more or less attractive to your company?
6 - What role, if any, do you see for the CGIAR centers in the development, transfer and distribution of new technologies/materials in the future?
The following is a compilation of the responses received:
Question 1Those who responded yes were most likely to have worked with CIMMYT and/or IRRI. The types of agreements included materials transfer agreements for company-owned materials, research agreements and testing agreements using company-owned technology. There is one patent license currently under negotiation for center-owned technology. None were aware of any examples where germplasm or other materials had been received from any CG centers, although research managers might be better able to answer this question. Those who responded no to this question said that the centers are not viewed as an important source of either germplasm or technology by their company.
Question 2
All responded that they market products worldwide. There is most likely to be a strong marketing effort in South America, and least likely to be a strong effort in Africa. All companies indicated that they apply for IP rights in all countries where such rights are available and enforced. Where rights are not available, or not enforced, they do not market the latest innovations, and they do not develop new technologies for crops localized to these geographic areas. All agreed that it is essential to improve IP protection before can afford to make any major investments in these countries.
Question 3
All responded yes, and some are already cooperating with various CG centers. An important caveat is that it depends on the technology and the risk associated with uncontrolled distribution. There was much more concern about the appropriate management of herbicide or insecticide resistance than there was about the potential loss of IP rights. All said that they need assurances that there are effective mechanisms to prevent "trickle back" of protected materials into key markets.
Question 4
The primary issue is management and control of distribution (see response to Question 3). All are willing to make materials available under standard materials transfer agreements (no commercial use, no distribution to third parties), in principle. However, there is concern about the enforceability of these terms. They probably would not share the most valuable materials. All would be willing to make materials available for local distribution on a case by case basis, with proper controls. For example, distribution could be limited to locally adapted varieties only. Materials intended for export use would be subject to a commercial license agreement.
Question 5
All said that the availability of IP rights for technologies and materials developed by the CG centers would make working with the centers more attractive. IP rights need only be obtained in important commercial markets, such that distribution to subsistence farmers could continues as always. Even if the company was only able to obtain a non-exclusive license, it would still have value because it would contribute to an "orderly marketplace," and the company could be assured that their competitors were no getting a "free ride." A couple of caveats: most public sector institutions overestimate what technology/materials will be commercially useful, and the CG centers will need a knowledgeable IP management/licensing staff to make such a program work. One suggestion was that the CG centers could transfer IP rights to the NARS for management.
Question 6
The CGIAR should be a forum for discussion about IP rights and public use issues on a worldwide basis, and it should bring the interests of the private sector into the discussion. The CG centers should continue to adapt technologies to regional needs and act as a technology conduit to subsistence farmers. The role of the CG centers will diminish unless ways are found to access proprietary technologies. However, as they get involved in IP rights and enforcement, the centers should not try to become businesses. They should continue to serve the public interest.
The universities were asked the following questions:
1 - When your university licenses intellectual property related to crop improvement, what public use exemptions are usually included in the agreement?2 - Does your university normally (or has it ever), sought patent protection in the countries where CGIAR centers are located [list provided]? In other developing countries? If so, what public use exemptions are included?
3 - Has your university ever made proprietary technologies/materials available to any of the CGIAR centers? If so, under what terms? If not, why not?
4 - Has your university ever used university-owned intellectual property rights as bargaining chips to obtain access to another party's intellectual property? If so, what additional information can you provide? If not, are you aware of any examples where a public sector institution has used this approach?
The following is a compilation of the responses received:
Question 1In exclusive and partially exclusive licenses, rights are retained for the university to do research, including with third party non-profit organizations. Where U.S. government funding is involved, rights are retained for U.S. government use. Use in developing countries is usually not an issue, because these countries are usually not included in the license agreement due to a lack of enforceable intellectual property rights. This issue is only explicitly addressed in cases where there is funding from the Rockefeller Foundation.
Some universities retain rights for state crop improvement associations for some crop varieties. This does not apply to utility patents.
Question 2
The answer is generally no, except for Mexico. Otherwise, IP rights are sought only in countries which are of commercial interest to the licensee. Licensees frequently want rights in South America, but seldom in Africa and Asia. Public use exemptions for subsistence farming and non-export production are seldom discussed in the license negotiation. Generally, this is viewed as an enforcement issue for the licensee. There is an operating assumption that the licensee would not enforce patent rights against subsistence farmers.
Questions 3
They have never received a request for proprietary materials from any CG center that they are aware of. However, all agreed there has probably been scientist to scientist transfer of materials. All would be willing to make proprietary materials available to the centers under standard materials transfer agreements (limited to research use, no transfer to third parties, new inventions must be reported and ownership is based an inventor ship). Other use, such as transfer to subsistence farmers, could be determined on a case by case basis, and would depend on rights already granted to a commercial licensee, the local availability of patent rights and assurances from the centers regarding distribution controls. Export would be the main concern.
Question 4
None of these universities has ever done a cross license, although several are under discussion currently. Because the universities are required to share revenues with inventors, there is concern about how to value (in monetary terms) a cross license for the purpose rewarding the inventors. Several universities have in-licensed technology to make a total IP package more valuable. This is also done to provide access to dominant patent rights for small company licensees. However, usually companies would prefer to negotiate directly with each other. Apocryphal examples of cross licenses for multimedia or software technologies were mentioned, but no details were available.
Conclusions
The general willingness of these intellectual property owners to provide access to their proprietary science is encouraging, but it does not in any way assure that access will be available to any particular property. Agreements will have to be negotiated on a case by case basis, dependent upon the owner, the particular property and the specific use intended by the IARC requesting access. However, it should be possible to obtain similar terms for all IARCs for a particular property.
1. The Issue
2. The Data
3. Discussion of Tables and Graphs
4. Conclusions
An important issue confronting the International Agricultural Research Centers (IARCs) and the Consultative Group on International Agricultural Research (CGIAR) is whether intellectual property rights on technologies and genetic materials from developed countries might in the future jeopardize the free supply of those technologies and materials to IARCs. In particular, if developing countries ("the South") export to developed countries ("the North") IARC crops1 that incorporate technology or genes that are subject to Northern intellectual property rights, Northern suppliers might in the future take legal action to make IARCs or their clients pay for proprietary technology and genetic materials.
1 Crops which are the focus of IARC research are for convenience denoted 'IARC crops'.
How big a problem might this be? In the long term, the answer depends in part on the future significance of sales of IARC crops in markets offering strong intellectual property protection for the relevant processes and products. In the near future, sales are in general most likely to encounter strong intellectual property rights in countries of the North, although stronger intellectual property protection is spreading to other countries under the provisions of the TRIPS2 agreement of the World Trade Organization (WTO).
2 TRIPS stands for "Trade-related Intellectual Property Rights, Including Trade in Counterfeit Goods".
In predicting the likely volume of such sales, a good place to start is with recent trade data. Accordingly, this report, prepared as a broad overview prepared to inform the deliberations of the Expert Panel on Proprietary Science and Technology of the CGIAR, focuses mainly on the question: "How significant are exports from South to North of IARC crops, in absolute terms and relative to domestic production and to total exports?"
Raw data on agricultural trade and production were obtained from the FAOSTAT database, made available on the Internet by the Food and Agricultural Organization (FAO) of the United Nations. Note that this data set does not provide bilateral (i.e., country-to-country) trade data. It does provide annual commodity-level production, export and import data for each country. Thus it will indicate United States wheat exports or Russian wheat imports, but not U.S. exports to Russia.
For this report we mainly used data for the year 1995. This is the most recent year for which FAOSTAT currently provides trade data. Thus, the tables are a one-year snapshot (with the exception of Table 5b). In general, this will suffice for our purposes, since most trade flows do not exhibit extreme year-to-year fluctuations. However, some do.3
3 Table 5b and Figure 3c provide examples of large fluctuations.
The total quantity of imports on a worldwide basis should closely correspond to the total quantity of exports for a given commodity. Factors such as time lags in reporting, loss or destruction of traded goods en route and misclassification of a commodity between exporting and importing country can account for some of the differences. However, for a number of crops, percentage differences over 10% between world exports and imports were noted, suggesting significant data error.4 In order to maintain a degree of consistency between import and export quantities without embarking on a major data-correction exercise, we adjusted import data by multiplying all import figures by the ratio of world exports to world imports for the crop in question.
4 In 1995, world net exports (exports minus imports) as a percentage of world exports, as reported in FAOSTAT, exceeded ten percent for the following categories: Beans, Dry; Beans, Green; Cow Peas, Dry; Jute; Millet; Pigeon Peas; Plantains; and Sweet Potatoes. Note that none of these commodities belongs to the top-ten of export commodities (ranked according to value of 1995 exports). (Note that in these footnotes, FAOSTAT crop categories are capitalized.)
Table 1 shows indicators of importance of selected crops in international trade. The table includes IARC crops as well as a few non-IARC crops. The latter, coffee, cocoa, grapes, jute, mangos and tea, are included for comparison purposes.5
5 Some other important non-IARC crops, such as Sugar and Cotton, are not included in Table 1.
The table ranks crops according to value of world exports. Note that each border-crossing counts as trade. Sometimes commodities will be shipped from country A to country C via country B. In such cases, double-counting of exports and imports occurs.6 In the third column of the table, a measure of the value of world output is provided. In order to value output, we use export prices7. The fourth column lists world exports as a percentage of world output. Note that this percentage could conceivably be greater than 100 due to the aforementioned double-counting of exports. The fifth column lists value of output of developing countries, again valued at export prices. The sixth column shows output of developing countries as a percentage of world output.
6 Thus, in a sense, our figures provide upwardly biased estimates of trade volumes. However, it may be argued that for our specific purposes our figures are useful. Problems related to proprietary technology and genetic materials are more likely to occur in cases of multiple border crossings.7 Since FAOSTAT does not report dollar value of production of agricultural commodities, a price index was calculated for each commodity as (dollar value of exports)/(quantity of exports), using world totals. This ratio was used as a price for valuing quantities of each commodity in dollars. The FAOSTAT data consistently report exports using the FOB (free on board) valuation standard. Since exported goods tend to be of higher quality than average, and since transportation costs from the production center to port are presumably included in export price, an upward bias in calculated values of production is likely. The export price index of Rice (FAOSTAT code 042) was used to compute the value of Rice, Paddy in world output.
The final column gives net imports - defined as imports minus exports - of developed countries as a percentage of output of developing countries. This statistic tells us how significant is the overall South-North trade flow for developing countries. If it is a large positive percentage, we know that a large fraction of Southern output is exported to the North. One should, however, be cautious in interpreting this statistic, especially where it assumes negative or small positive values. For instance, for soybeans the statistic has a value of -3.1 %. To conclude that Southern exports of soybeans to the North are insignificant would be a mistake. As we see in the market share tables (Tables 3-10), the United States and Brazil are major exporters of soybeans, while the European Union is a major importer. In fact Brazil is a major exporter of soybeans to Europe, even though the overall trade flow of soybeans is from North to South.
Of all the crops listed in Table 1, only bananas, coffee, cocoa, and tea display large positive percentages in the last column; however, the latter three are not of immediate interest to us because they are non-IARC crops. As for bananas, unfortunately our data do not distinguish between cooking bananas and dessert bananas. Cooking bananas are predominantly for local consumption, whereas the international market for dessert bananas is relatively very large. This is an important distinction for our purposes, because in fact dessert bananas can hardly be considered an IARC crop - IARC banana research8 focuses on cooking bananas.9 Thus we can conclude that for none of the IARC crops there is a clear overall tendency for trade flows to be from South to North.
8 Two IARCs conduct Banana research: IPGRI/INIBAP (International Network for the Improvement of Banana and Plantain, a part of IPGRI, located in France) and IITA (International Institute for Tropical Agriculture, located in Nigeria).9 The research efforts of IPGRI/INIBAP and IITA are directed at cooking bananas (also known as "starch bananas"), not the dessert bananas (also called "sweet bananas") that dominate South-North trade.
Figure 1a shows a selection of eleven crops ranked according to value of world output. For each crop, it shows output and exports of the world and of developing countries, all in U.S. dollar terms. From this graph, it is evident that for most crops trade is dwarfed by output. In other words, the vast majority of IARC crop output is never traded across national borders.
Figure 1b displays only part of the information contained in figure la. It omits output and focuses entirely on exports. Among IARC crops, rice is by far developing countries' most significant export crop in value terms. In addition, Southern exports dominate international markets for cassava, groundnuts and beans.
Table 2 basically contains the same information as Table 1 (except for the fact that it omits non-IARC crops), but the crops are now arranged in a different way, namely by IARC.10
10 The classification by IARC relies in part on recent IARC reports. It is not exhaustive. As can be seen in the table, centers share responsibility for some crops.
Tables 3-10 and Figures 2-6 break world aggregates down into sub-aggregates for eight groups of countries: Low-Income Developing Countries11; Brazil; China; Rest of Middle-Income Developing Countries12; Transition Economies13, United States; European Union14; and Rest of Developed Countries.15 There is one Table for each group. The Figures focus on developing countries.
11 Our term "Countries" is not synonymous to "independent states". Developing Countries include Low-Income Developing Countries and Middle-Income Developing Countries. Low-Income Developing Countries include Afghanistan, Angola, Bangladesh, Benin, Bhutan, Burkina Faso, Burundi, Cambodia, Cape Verde, Central-African Republic, Chad, Comoros, Congo Democratic Republic, Djibouti, Equatorial Guinea, Eritrea, Ethiopia, Gambia, Guinea, Guinea-Bissau, Haiti, Kiribati, Laos, Lesotho, Liberia, Madagascar, Malawi, Maldives, Mali, Mauritania, Mozambique, Myanmar, Nepal, Niger, Rwanda, Samoa, Sao Tome and Principe, Sierra Leone, Solomon Islands, Somalia, Sudan, Tanzania, Togo, Tuvalu, Uganda, Vanuatu, Yemen, and Zambia.12 Middle-Income Developing Countries include Brazil, China, and the Rest of Middle-Income Developing Countries, which include American Samoa, Anguilla, Antigua and Barbuda, Argentina, Aruba, Bahamas, Bahrain, Barbados, Belize, Bermuda, Bolivia, Botswana, Bouvet Islands, British Indian Ocean Territory, British Virgin Islands, Brunei Darussalam, Cameroon, Canton Islands, Cayman Islands, Chile, Christmas Islands, Cocos Islands, Colombia, Congo Republic, Cook Islands, Costa Rica, Cote d'Ivoire, Cuba, Cyprus, Dominica, Dominican Republic, East Timor, Ecuador, Egypt, El Salvador, Falkland Islands, Fiji, French Guiana, French Polynesia, French South Territories, Gabon, Gaza Strip, Ghana, Greenland, Grenada, Guadeloupe, Guam, Guatemala, Guyana, Heard and McDonald Islands, Honduras, Hong Kong, India, Indonesia, Iran, Iraq, Jamaica, Johnston Islands, Jordan, Kenya, Korea (North), Korea (South), Kuwait, Lebanon, Libya, Macau, Malaysia, Malta, Marshall Islands, Martinique, Mauritius, Mayotte, Mexico, Micronesia, Midway Islands, Mongolia, Montserrat, Morocco, Namibia, Nauru, Netherlands Antilles, New Caledonia, Nicaragua, Nigeria, Niue, Norfolk Islands, Nothern Marianas, Oman, Pakistan, Palau, Panama, Papua New Guinea, Paraguay, Peru, Phillipines, Pitcairn, Puerto Rico, Qatar, Reunion, Saint Lucia, Saudi Arabia, Senegal, Seychelles, Singapore, South Georgia, Sri Lanka, Saint Helena, Saint Kitts and Nevis, Saint Pierre and Miquelon, Saint Vincent, Suriname, Swaziland, Syria, Taiwan, Thailand, Tokelau, Tonga, Trinidad and Tobago, Tunisia, Turkey, Turks and Caicos Islands, U.S. Virgin Islands, United Arab Emirates, Uruguay, Venezuela, Vietnam, Wake Island, Wallis Island, Western Sahara, and Zimbabwe. Note that several Asian "tigers" as well as some oil-exporting countries (and perhaps some other countries like the Bahamas) might be more properly classified as high-income countries.
13 Transition Economies include Albania, Armenia, Azerbaijan, Belarus, Bosnia-Herzegovina, Bulgaria, Croatia, Czech Republic, Estonia, Georgia, Hungary, Kazakhstan, Kyrgyzstan, Latvia, Lithuania, Macedonia, Moldova Republic, Poland, Romania, Russian Federation, Slovakia, Slovenia, Tajikistan, Turkmenistan, Ukraine, Uzbekistan, and Yugoslavia.
14 The European Union includes Austria, Belgium, Denmark, Finland, France, Germany, Greece, Ireland, Italy, Luxembourg, Netherlands, Portugal, Spain, Sweden and United Kingdom.
15 Developed Countries include the European Union, the United States, and the Rest of Developed Countries. The Rest of Developed Countries include Andorra, Australia, Canada, Faeroe Islands, Gibraltar, Iceland, Israel, Japan, Liechtenstein, Monaco, New Zealand, Norway, San Marino, South Africa, Svalbard, Switzerland, and Vatican City.
Tables 3-10 provide market share measures for each of the eight groups. These were calculated using raw data from FAOSTAT on imports, exports and production, all measured in metric tons.16 We obtained data for these groups of countries by adding up values for constituent countries. This approach is appropriate for production. With trade data, aggregate exports and imports (as separate items) fail to differentiate between trade within a group of nations and trade to nations outside the group. Again, this is a consequence of the fact that FAOSTAT does not provide bilateral trade data.
16 In some cases, we needed to make adjustments to commodity categories to make trade categories compatible with production categories:(1) There is a single category of Cassava in production data, and three categories (Dried, Starch and Tapioca) in trade data. For the group trade data we used the Dried Cassava category.(2) Only Green Coffee is represented in production data, while Green and Roast coffee are represented in trade data. Trade in Green and Roast Coffee is compared to production of Green Coffee.
(3) Groundnuts have a single category in production data but two in trade data (In-Shell and Shelled). Total (In-Shell and Shelled) Groundnut trade is compared to production of Groundnuts in Shell.
(4) Only Rice, Paddy is represented in production data, whereas trade data are for Rice (Total).
For each group of countries, we included only crops that are in one way or another significant.17 The columns of Tables 3-10 are largely self-explanatory, except for the sixth column, FAOSTAT does not provide consumption data. We calculated "consumption" (C) quantities from the accounting identity C = Y + M - X, using the available data for production (Y), exports (X) and adjusted18 imports (M). This approximation entails possible distortions due to commodity storage for consumption or export in a later period.
17 Crops for which all four percentages are below 5 % are omitted from Tables 3-10.18 Recall that we adjusted imports to make aggregate world imports match aggregate world exports. Combined with our method for computing consumption, this implies that aggregate output equals aggregate computed consumption.
In Table 3, we see that dry beans account for more exports (in value terms) from low-income developing countries than all other IARC crops combined. Another salient fact is that though exports from the poorest countries dominate international markets for cow peas and pigeon peas, the size of these markets is very small compared to international trade in many other crops. Figure 2a demonstrates that what is true for developing countries in general, namely that exports are only a small fraction of output of IARC crops, holds a fortiori for low-income developing countries. In figure 2b19 we see that rice imports are by far the most significant feature of the poorest countries' trade in IARC crops.
19 Compared with Figure 2a, Figure 2b contains no additional information; it omits production.
Table 4 highlights the fact that soybeans are the only IARC crop of which Brazil - a major player in several non-IARC crop markets - is an important exporter.
Table 5 a shows that Chinese producers have significant international market shares mainly in beans, groundnuts, and sweet potatoes. Interestingly, notwithstanding the enormous Chinese production of rice, Chinese rice exports were relatively very small, and net Chinese rice exports were even negative, in 1995. At this point, however, the reader should be mindful of the perils of a one-year snapshot. As we see in Table 5b and Figure 3c, Chinese rice exports exhibit large fluctuations; for example, in 1994, they were almost ten times as large as in 1995. Relatively small fluctuations in Chinese output lead to large fluctuations in exports or imports for a number of crops. This is due to the fact that - once again - trade is small compared to output, as is demonstrated in Figure 3a. Finally, as most vividly illustrated in figure 3b, not only for rice, but for all four most important crops20 in Chinese trade, exports were much smaller than imports in 1995. As we see in Figure 3c, China has been a major importer of wheat during the entire period 1986-1995.
20 Rice, Wheat, Maize, and Soybeans.
Next, consider Table 6, which provides information about the category of middle-income developing countries excluding China and Brazil. This is a very large and disparate group of countries21 with a combined population of over two billion. Not surprisingly, the combined export market share of this group is significant for most IARC crops, most notably rice, cassava, groundnuts, and chickpeas. Net group exports of four of these five crops22 are positive.
21 See footnote 11.22 Groundnuts being the exception.
In Figures 4a and 4b, Brazil is included in the group.23 Figure 4a shows - again - that for all IARC crops, the vast majority of output is not traded internationally, the most extreme case in point being yams - an important crop in terms of output, but negligable in terms of international trade. Note that rice group output (in value terms) is vastly larger than group output of any other IARC crop. As shown in figure 4b, the only IARC crop whose group exports (in value terms) come anywhere close to those of rice is bananas. (But, as we noted above, the type of bananas that is usually traded internationally is not an IARC research priority.) Moreover, bananas and cassava are the only major export crops listed here for which group exports are much larger than group imports.
23 Only for Soybeans does this make a significant difference.!
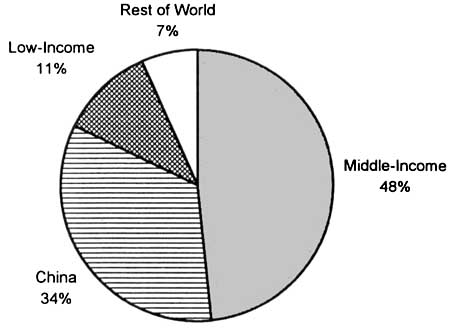
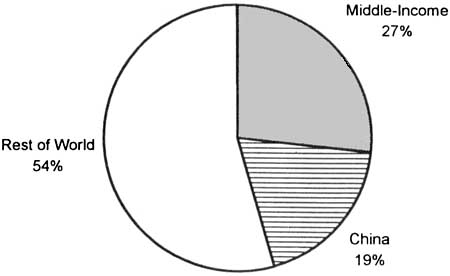
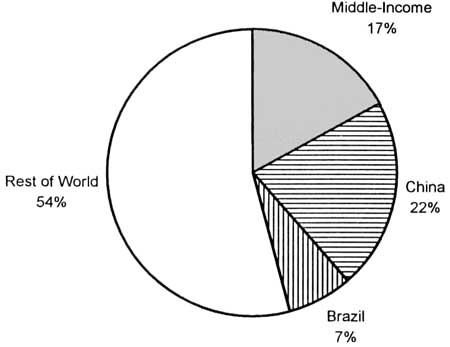
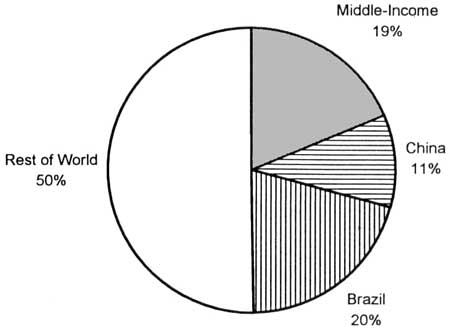
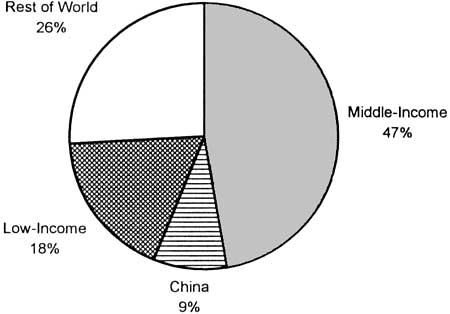
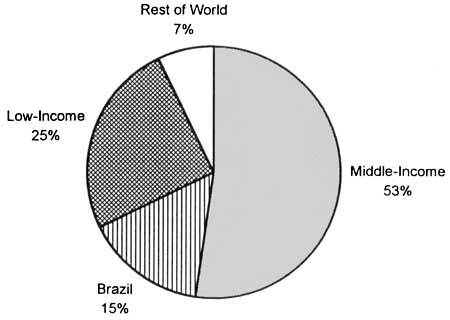
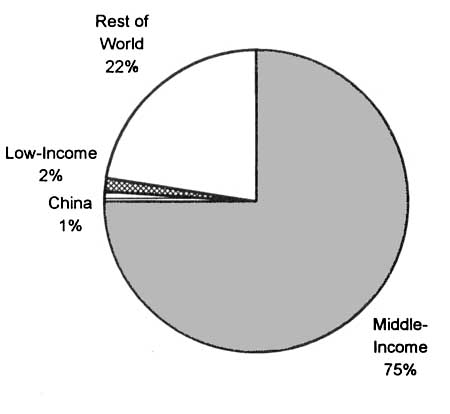
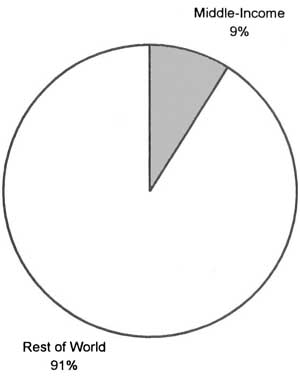
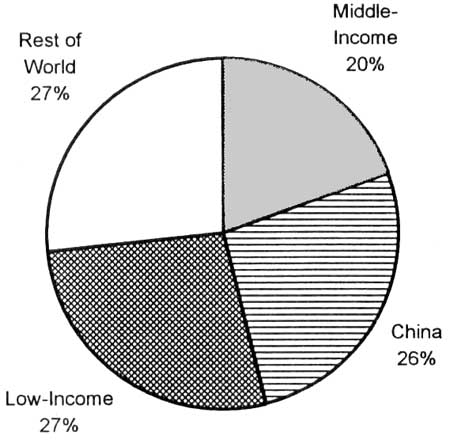
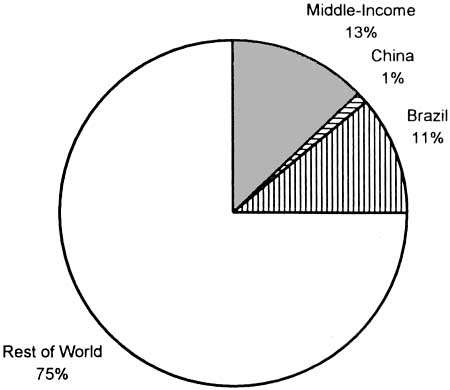
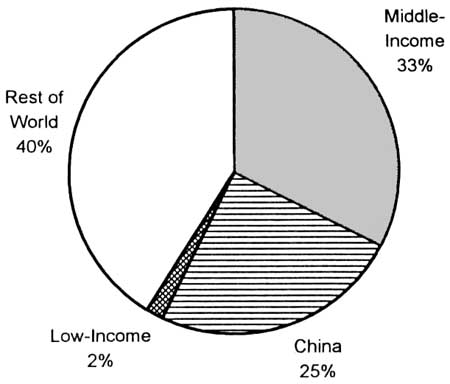
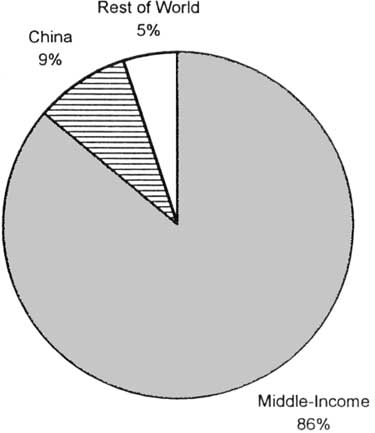
Figures 5 and 6 show how world output and world exports, respectively, of some major IARC crops are divided among four groups of countries: low-income developing countries,24 China, middle-income developing countries,25 and the rest of the world.26
24 See footnote 10.25 In Figures 4a, 4b, 5, and 6 Brazil is included in the category "Middle-Income Countries excluding China".
26 The "Rest of the World" category consists of all Developed Countries and Transition Economies.
Table 7 provides market share data for the transition economies. Wheat and barley are the only major export crops for this group. Wheat exports stand out in value terms, while barley is the only other major crop of which this group is a somewhat significant net exporter. Group output of wheat, barley and potatoes is significant relative to world output.
Tables 8, 9, and 10 provide market share data for three groups of developed countries. Here, we are especially interested in net imports.27 A measure of net imports is given by subtracting any percentage in the third column from the corresponding percentage in the fourth column.28 Thus, taking into account volume of trade (in value terms), we see in Table 8 that the European Union is a significant net importer of maize, bananas, groundnuts, soybeans, dry beans, cassava, and sorghum. Interestingly, inspection of Table 10 reveals that the category of other developed countries (which excludes the U.S.A. and the E.U.) exhibits the exact same pattern.
27 Note that if both imports and exports are large, it is likely that a large proportion of group trade is intra-group trade. This is especially true in the European Union, which is a geographically contiguous trading block. For example, most Potato trade of member countries of the European Union is with other member countries. The reader is also reminded that the last column of Table 1 provides information about aggregate net imports of all developed countries.28 The reader is reminded that we adjusted the raw imports data so that, by construction, aggregate world imports equal aggregate world exports.
Of these crops, maize and sorghum are not significant net export crops of developing countries; the United States dominate the international maize and sorghum markets. As for groundnuts and dry beans, combining information from Tables 8, 9, and 10, we see that although U.S. net exports of these crops are substantial, the combined net imports of the European Union and other developed countries are much larger. In the case of soybeans, the European Union and other developed countries are large net importers, while the United States dominate the international market. However, as reported above, Brazilian soybean exports are significant. From this data set, it is impossible to tell to what extent U.S. exports dominate other developed countries' import markets. Judging by FAOSTAT data, it may be that all of Brazil's exports go to developed countries, but it may also be that a large proportion of Brazil's exports goes to other middle-income developing countries.29 However, it is well known that Brazil is a significant exporter of soybeans to developed countries.30 Finally, there is a very clear pattern in international cassava trade: cassava is mainly exported by middle-income developing countries (excluding Brazil and China) to the European Union. The international cassava market is of intermediate size.31
29 We currently do not have this information because FAOSTAT does not provide bilateral trade data.30 In the early 1970s, Brazil quickly established itself as a Soybean exporter to Japan and the European Union. One should always keep in mind that markets are dynamic. In the future, other challenges to currently dominant crop exporters will no doubt arise.
31 As Table 1 shows, world exports total a little over half a billion U.S. dollars.
Table 9 shows that the United States are a major net importer of bananas, plantains and yams. In these crops, international trade is clearly dominated by the category of middle-income developing countries, as can be seen in Table 6. As shown in Table 1, the international (predominantly non-IARC varieties) banana market is big, while international markets for plantains and yams are small.
We conclude our discussion of the tables and graphs with a few comments on rice. Rice is not only the world's most important crop in terms of output, but also the number one IARC crop in terms of developing countries' exports (see Table 6). However, most of these exports probably go to other developing countries (see also Table 3). Due to the lack of bilateral trade data in FAOSTAT, we are unable to quantify South-North rice trade here. From Table 8 we can infer that imports of the European Union's member countries from non-member countries comprise between 2.7% and 7.9% of world imports. Because U.S. net rice exports total 12.7% of world exports, a large proportion of E.U. imports may well be supplied by U.S. exporters. But we cannot exclude the possibility that total rice exports from developing to developed countries are significant.32
32 Based on FAOSTAT, South-North Rice trade cannot exceed one billion U.S. dollars, and is likely to be substantially less and to comprise a number of distinct varieties.
It should be emphasized that the database used for this report, FAOSTAT, has some major limitations and flaws, the most important of which is its lack of bilateral trade data.33 Nevertheless, (mainly) on the basis of FAOSTAT it is possible to draw some conclusions regarding the importance of South-North trade in IARC crops.
33 The currently available budget for this research project does not permit the purchase of COMTRADE, which is a data set offered by the United Nations Statistics Division. COMTRADE does provide bilateral trade data.
Of most IARC crops, only small percentages of world output are traded internationally. Notably, rice is perhaps the most important crop in the world, but only a small fraction of rice output is traded internationally.34
34 Even so, Rice is the number four IARC crop in terms of value of world exports.
IARC crops exhibiting significant South-North trade flows include soybeans, dry beans, groundnuts, cassava, plantains, and yams, and perhaps rice35 Among these, rice and soybeans are the only crops whose international markets are very large36 relative to those of other crops. International trade in dry beans, groundnuts, and cassava is also sizeable.37 Dry beans are the only IARC crop for which exports from the poorest category of countries - the low-income developing countries - are noteworthy. Finally, plantains and yams are mostly exported from middle-income developing countries to developed countries, but these international markets are small.38
35 Bananas are not included in this listing, because dessert bananas are not a major focus of IARC research. The international market for dessert bananas is very large and clearly dominated by exports from developing countries.36 Total world trade in both Rice and Soybeans exceeds seven billion U.S. dollars. Due to the lack of bilateral trade data in FAOSTAT, we are currently unable to exactly quantify South-North tradeflows of Soybeans and Rice.
37 That is, between half a billion and one-and-half-billion U.S. dollars.
38 That is, less than one hundred million U.S. dollars.
The recent trade patterns reported here have one clear implication. The poorest countries are unlikely to be greatly exposed in the near term to accusations of intellectual property rights violations by their exports of IARC crops to the North.
For middle-income countries, problems might occur in some of the seven crops listed above. Investment in bilateral trade data might provide a more accurate picture of their potential exposure. We suggest that the Expert Panel consider the feasibility of estimating threshold values for exports to the North below which serious exposure to intellectual property challenges is unlikely.
Table 1: Indicators of Importance of Trade, 1995 (Values in US $1,000,000)
Note that non-IARC crops appearing in this table are italicized.
|
|
Value of World Exports |
Value of World Output (at export prices) |
World Exports/World Output |
Value of Output of Developing* (at export prices) |
Output of Developing*/World Output |
Net Imports of Developed*/ Output of Developing* |
|
WHEAT |
16,564 |
91,096 |
18.2% |
42,766 |
46.9% |
-21.7% |
|
Coffee** |
12,209 |
16,960 |
72.0% |
16,954 |
100.0% |
56.9% |
|
MAIZE |
10,829 |
71,410 |
15.2% |
34,820 |
48.8% |
-15.4% |
|
SOYBEANS |
7,392 |
29,282 |
25.2% |
14,593 |
49.8% |
-3.1% |
|
RICE** |
7,297 |
179,858 |
4.1% |
171,495 |
95.4% |
-1.0% |
|
BANANAS |
4,620 |
19,820 |
23.3% |
19,510 |
98.4% |
15.6% |
|
BARLEY |
2,669 |
20,220 |
13.2% |
3,884 |
19.2% |
-23.0% |
|
Cocoa Beans |
2,459 |
3,958 |
62.1% |
3,958 |
100.0% |
49.0% |
|
POTATOES |
2,273 |
91,718 |
2.5% |
32,913 |
35.9% |
0.0% |
|
Tea |
2,267 |
5,093 |
44.5% |
4,811 |
94.5% |
14.8% |
|
Grapes |
1,943 |
57,097 |
3.4% |
17,639 |
30.9% |
1.5% |
|
BEANS, DRY |
1,256 |
9,031 |
13.9% |
7,830 |
86.7% |
2.5% |
|
GROUNDNUTS** |
1,033 |
22,435 |
4.6% |
21,044 |
93.8% |
4.1% |
|
SORGHUM |
839 |
6,891 |
12.2% |
5,144 |
74.6% |
-5.0% |
|
CASSAVA** |
638 |
22,492 |
2.8% |
22,492 |
100.0% |
1.8% |
|
Mangos |
297 |
18,762 |
1.6% |
18,692 |
99.6% |
0.9% |
|
LENTILS |
280 |
1,277 |
21.9% |
1,023 |
80.1% |
-7.4% |
|
CHICK-PEAS |
248 |
7,256 |
3.4% |
6,973 |
96.1% |
0.8% |
|
BEANS, GREEN |
192 |
4,095 |
4.7% |
2,682 |
65.5% |
2.3% |
|
Jute |
102 |
736 |
13.9% |
736 |
100.0% |
1.5% |
|
PLANTAINS |
67 |
14,351 |
0.5% |
14,351 |
100.0% |
0.3% |
|
MILLET |
57 |
5,956 |
1.0% |
5,712 |
95.9% |
0.4% |
|
SWEET POTATOES |
34 |
37,647 |
0.1% |
37,116 |
98.6% |
0.0% |
|
YAMS |
21 |
25,575 |
0.1% |
25,414 |
99.4% |
0.1% |
|
COW PEAS, DRY |
5 |
533 |
0.9% |
524 |
98.3% |
0.0% |
|
PIGEON PEAS |
2 |
833 |
0.2% |
833 |
100.0% |
0.0% |
* See footnotes 11, 12, 14, and 15 for definitions of the Developed and Developing categories.
** Production data are for Coffee, Green; Rice, Paddy; Groundnuts in Shell; and Cassava.
Trade data are for Coffee, Green and Roast; Rice (Total); Groundnuts, Shelled plus Groundnuts In Shell; and Dried Cassava.
Table 2: Indicators of Importance of Trade (crops are sorted by IARCs*), 1995 (Values in US $1,000,000)
|
Research Center |
|
Value of World Exports |
Value of World Output (at export prices) |
World Exports/ World Output |
Value of Output of Developing** (at export prices) |
Output of Developing**/World Output |
Net Imports of Developed**/ Output of Developing** |
|
CIAT |
RICE*** |
7,297 |
179,858 |
4.1% |
171,495 |
95.4% |
-1.0% |
|
BEANS, DRY |
1,256 |
9,031 |
13.9% |
7,830 |
86.7% |
2.5% |
|
|
CASSAVA*** |
638 |
22,492 |
2.8% |
22,492 |
100.0% |
1.8% |
|
|
BEANS, GREEN |
192 |
4,095 |
4.7% |
2,682 |
65.5% |
2.3% |
|
|
CIMMYT |
WHEAT |
16,564 |
91,096 |
18.2% |
42,766 |
46.9% |
-21.7% |
|
MAIZE |
10,829 |
71,410 |
15.2% |
34,820 |
48.8% |
-15.4% |
|
|
BARLEY |
2,669 |
20,220 |
13.2% |
3,884 |
19.2% |
-23.0% |
|
|
CIP |
POTATOES |
2,273 |
91,718 |
2.5% |
32,913 |
35.9% |
0.0% |
|
SWEET POTATOES |
34 |
37,647 |
0.1% |
37,116 |
98.6% |
0.0% |
|
|
ICARDA |
WHEAT |
16,564 |
91,096 |
18.2% |
42,766 |
46.9% |
-21.7% |
|
BARLEY |
2,669 |
20,220 |
13.2% |
3,884 |
19.2% |
-23.0% |
|
|
BEANS, DRY |
1,256 |
9,031 |
13.9% |
7,830 |
86.7% |
2.5% |
|
|
CHICK-PEAS |
248 |
7,256 |
3.4% |
6,973 |
96.1% |
0.8% |
|
|
BEANS, GREEN |
192 |
4,095 |
4.7% |
2,682 |
65.5% |
2.3% |
|
|
ICRISAT |
GROUNDNUTS*** |
1,033 |
22,435 |
4.6% |
21,044 |
93.8% |
4.1% |
|
SORGHUM |
839 |
6,891 |
12.2% |
5,144 |
74.6% |
-5.0% |
|
|
CHICK-PEAS |
248 |
7,256 |
3.4% |
6,973 |
96.1% |
0.8% |
|
|
MILLET |
57 |
5,956 |
1.0% |
5,712 |
95.9% |
0.4% |
|
|
PIGEON PEAS |
2 |
833 |
0.2% |
833 |
100.0% |
0.0% |
|
|
IITA |
MAIZE |
10,829 |
71,410 |
15.2% |
34,820 |
48.8% |
-15.4% |
|
SOYBEANS |
7,392 |
29,282 |
25.2% |
14,593 |
49.8% |
-3.1% |
|
|
RICE*** |
7,297 |
179,858 |
4.1% |
171,495 |
95.4% |
-1.0% |
|
|
BANANAS**** |
4,620 |
19,820 |
23.3% |
19,510 |
98.4% |
15.6% |
|
|
CASSAVA*** |
638 |
22,492 |
2.8% |
22,492 |
100.0% |
1.8% |
|
|
YAMS |
21 |
25,575 |
0.1% |
25,414 |
99.4% |
0.1% |
|
|
COW PEAS, DRY |
5 |
533 |
0.9% |
524 |
98.3% |
0.0% |
|
|
IPGRI/INIBAP |
BANANAS**** |
4,620 |
19,820 |
23.3% |
19,510 |
98.4% |
15.6% |
|
IRRI (Philippines) |
RICE*** |
7,297 |
179,858 |
4.1% |
171,495 |
95.4% |
-1.0% |
* IARCs (International Agricultural Research Centers) are in alphabetical order; crops for each IARC are ranked by Value of World Exports
** See footnotes 11, 12, 14 and 15 for definitions of the Developed and Developing categories.
*** Production data are for Rice, Paddy; Groundnuts in Shell; and Cassava.
Trade data are for Rice (Total); Groundnuts, Shelled plus Groundnuts In Shell; and Dried Cassava.
**** The FAOSTAT database does not distinguish between cooking bananas and dessert bananas. IARC banana research focuses on cooking bananas which are predominantly for local consumption, rather than the dessert bananas that are traded internationally in large quantities.
Table 3: Market Share Data for Low-Income Developing Countries*, 1995
|
|
Group Exports (US $1.000) |
Group Exports per capita |
Group Exports/ World Exports |
Group Imports/ World Imports |
Group Output/ World Output |
Group Consumption/ World Output |
|
BEANS, DRY |
277,958 |
$0.48 |
27.3% |
6.8% |
16.6% |
13.7% |
|
RICE** |
79,384 |
0.14 |
1.6% |
14.1% |
11.0% |
11.5% |
|
SORGHUM |
47,431 |
0.08 |
5.3% |
3.0% |
18.0% |
17.7% |
|
GROUNDNUTS** |
17,509 |
0.03 |
1.7% |
1.1% |
11.5% |
11.4% |
|
BANANAS |
10,671 |
0.02 |
0.2% |
0.1% |
9.6% |
9.6% |
|
MILLET |
6,180 |
0.01 |
16.9% |
0.6% |
24.4% |
24.2% |
|
COW PEAS, DRY |
3,400 |
0.01 |
91.0% |
0.0% |
26.9% |
26.1% |
|
CASSAVA** |
2,265 |
0 |
0.7% |
0.0% |
25.2% |
25.2% |
|
PIGEON PEAS |
1,900 |
0 |
99.6% |
5.2% |
14.2% |
14.0% |
|
LENTILS |
1,119 |
0 |
0.4% |
2.1% |
10.7% |
11.0% |
|
YAMS |
4 |
0 |
0.1% |
3.5% |
10.8% |
10.8% |
|
SWEET POTATOES |
2 |
0 |
0.0% |
0.1% |
5.1% |
5.1% |
|
PLANTAINS |
0 |
0 |
0.0% |
0.0% |
53.6% |
53.6% |
* For a listing of countries in Low-Income Developing category, see footnote 11.
** Production data are for Rice, Paddy; Groundnuts In Shell; and Cassava.
Trade data are for Rice (Total); Groundnuts, Shelled plus Groundnuts In Shell; and Dried Cassava.
Table 4: Market Share Data for Brazil, 1995
|
|
Domestic Exports (US $1,000) |
Domestic Exports per capita |
Domestic Exports/ World Exports |
Domestic Imports/ World Imports |
Domestic Output/ World Output |
Domestic Consumption/ World Output |
|
SOYBEANS |
770,426 |
$4.84 |
10.9% |
2.6% |
20.3% |
18.2% |
|
MAIZE |
5,315 |
0.03 |
0.0% |
1.7% |
7.1% |
7.3% |
|
BANANAS |
3,907 |
0.02 |
0.1% |
0.0% |
10.3% |
10.3% |
|
YAMS |
1,310 |
0.01 |
5.9% |
0.0% |
0.7% |
0.7% |
|
BEANS, DRY |
1,016 |
0.01 |
0.0% |
9.1% |
16.3% |
17.6% |
|
WHEAT |
16 |
0 |
0.0% |
6.0% |
0.3% |
1.4% |
|
CASSAVA |
0 |
0 |
0.0% |
0.0% |
15.4% |
15.4% |
Table 5a: Market Share Data for China, 1995
|
|
Domestic Exports (US $1,000) |
Domestic Exports per capita |
Domestic Exports/ World Exports |
Domestic Imports/ World Imports |
Domestic Output/ World Output |
Domestic Consumption/ World Output |
|
BEANS, DRY |
262,819 |
$0.22 |
26.5% |
2.0% |
7.8% |
4.4% |
|
GROUNDNUTS* |
256,879 |
0.21 |
24.9% |
0.1% |
35.8% |
34.5% |
|
SOYBEANS |
99,696 |
0.08 |
1.2% |
8.6% |
10.7% |
12.6% |
|
RICE* |
56,486 |
0.05 |
1.0% |
7.7% |
33.9% |
34.2% |
|
BANANAS |
32,611 |
0.03 |
0.3% |
1.2% |
5.8% |
6.0% |
|
MAIZE |
13,256 |
0.01 |
0.1% |
15.2% |
21.8% |
24.1% |
|
SORGHUM |
13,005 |
0.01 |
1.5% |
0.5% |
8.9% |
8.8% |
|
LENTILS |
11,473 |
0.01 |
7.4% |
0.2% |
4.1% |
2.5% |
|
SWEET POTATOES |
6,867 |
0.01 |
34.5% |
0.0% |
86.4% |
86.4% |
|
POTATOES |
5,800 |
0 |
0.4% |
0.0% |
16.0% |
16.0% |
|
MILLET |
3,740 |
0 |
7.2% |
0.9% |
11.8% |
11.7% |
|
WHEAT |
1,559 |
0 |
0.0% |
12.4% |
18.8% |
21.1% |
|
BARLEY |
280 |
0 |
0.0% |
6.9% |
3.2% |
4.2% |
|
CASSAVA* |
227 |
0 |
0.0% |
13.4% |
2.1% |
2.5% |
* Production data are for Rice, Paddy; Groundnuts In Shell; and Cassava.
Trade data are for Rice (Total); Groundnuts, Shelled plus Groundnuts In Shell; and Dried Cassava.
Table 5b: Chinese Trade in Wheat and Rice, 1986-1995
|
Year |
Wheat IMPORTS (US $1000) |
Wheat EXPORTS (US $1000) |
Rice IMPORTS (US $1000) |
Rice EXPORTS (US $1000) |
|
1986 |
936,329 |
570 |
51,233 |
211,264 |
|
1987 |
1,484,326 |
748 |
83,110 |
220,404 |
|
1988 |
1,891,441 |
885 |
76,184 |
204,199 |
|
1989 |
2,757,839 |
239 |
305,076 |
111,574 |
|
1990 |
2,319,117 |
559 |
12,755 |
97,990 |
|
1991 |
1,600,026 |
265 |
40,987 |
181,784 |
|
1992 |
1,663,219 |
298 |
40,317 |
232,897 |
|
1993 |
1,007,715 |
8,238 |
36,628 |
266,222 |
|
1994 |
1,177,918 |
10,055 |
143,490 |
533,138 |
|
1995 |
2,253,067 |
1,559 |
435,273 |
56,486 |
Table 6: Rest of Middle-Income Developing Countries* (excluding Brazil and China)
|
|
Group Exports (US $1.000) |
Group Exports per capita |
Group Exports/ World Exports |
Group Imports/ World Imports |
Group Output/ World Output |
Group Consumption/ World Output |
|
RICE** |
4,972,253 |
$2.04 |
75.1% |
57.8% |
48.4% |
47.7% |
|
BANANAS |
3,244,814 |
1.33 |
85.9% |
10.4% |
72.8% |
54.9% |
|
WHEAT |
1,378,857 |
0.57 |
9.0% |
43.3% |
26.7% |
33.2% |
|
MAIZE |
909,918 |
0.37 |
9.2% |
40.2% |
16.9% |
21.6% |
|
SOYBEANS |
801,690 |
0.33 |
12.8% |
19.2% |
18.7% |
20.3% |
|
CASSAVA** |
506,677 |
0.21 |
92.7% |
4.6% |
57.3% |
55.1% |
|
POTATOES |
370,503 |
0.15 |
17.4% |
15.0% |
17.2% |
17.1% |
|
GROUNDNUTS** |
336,287 |
0.14 |
32.5% |
34.0% |
46.0% |
45.9% |
|
BEANS, DRY |
296,447 |
0.12 |
19.5% |
39.3% |
46.0% |
48.8% |
|
CHICK-PEAS |
204,438 |
0.08 |
77.8% |
52.8% |
91.7% |
90.8% |
|
BARLEY |
107,359 |
0.04 |
6.5% |
38.8% |
14.7% |
19.2% |
|
LENTILS |
104,805 |
0.04 |
31.1% |
60.6% |
65.4% |
71.9% |
|
SORGHUM |
38,734 |
0.02 |
4.9% |
38.6% |
47.4% |
51.5% |
|
PLANTAINS |
36,456 |
0.01 |
75.0% |
13.0% |
46.4% |
46.2% |
|
YAMS |
19,374 |
0.01 |
93.8% |
2.0% |
87.9% |
87.9% |
|
MILLET |
8,823 |
0 |
19.4% |
19.7% |
59.8% |
59.8% |
|
SWEET POTATOES |
6,859 |
0 |
23.0% |
10.9% |
6.6% |
6.6% |
|
COW PEAS, DRY |
26 |
0 |
0.1% |
95.7% |
71.3% |
72.2% |
|
PIGEON PEAS |
18 |
0 |
0.4% |
94.8% |
85.8% |
86.0% |
* For a listing of countries in Middle-Income Developing category, see footnote 12.
** Production data are for Rice, Paddy; Groundnuts In Shell; and Cassava.
Trade data are for Rice (Total); Groundnuts, Shelled plus Groundnuts In Shell; and Dried Cassava.
Table 7: Market Share Data for Transition Economies*, 1995
|
|
Group Exports (US $1.000) |
Group Exports per capita |
Group Exports/ World Exports |
Group Imports/ World Imports |
Group Output/ World Output |
Group Consumption/ World Output |
|
WHEAT |
1,211,517 |
$2.92 |
9.8% |
6.8% |
17.6% |
17.1% |
|
BARLEY |
292,452 |
0.71 |
18.7% |
10.0% |
30.5% |
29.3% |
|
MAIZE |
188,813 |
0.46 |
1.3% |
1.4% |
6.4% |
6.4% |
|
POTATOES |
71,249 |
0.17 |
5.3% |
7.2% |
37.0% |
37.0% |
|
BANANAS |
47,417 |
0.11 |
0.8% |
10.8% |
0.0% |
2.4% |
|
MILLET |
8,054 |
0.02 |
18.4% |
1.6% |
3.2% |
3.0% |
|
GROUNDNUTS** |
2,055 |
0 |
0.2% |
5.1% |
0.0% |
0.3% |
* For a listing of countries in Transition Economies category, see footnote 13.
** Production data are for Groundnuts In Shell; trade data are for Groundnuts, Shelled plus Groundnuts In Shell.
Table 8: Market Share Data for European Union*, 1995
|
|
Group Exports (US $1,000) |
Group Exports per capita |
Group Exports/ World Exports |
Group Imports/ World Imports |
Group Output/ World Output |
Group Consumption/ World Output |
|
WHEAT |
4,772,843 |
$12.84 |
25.4% |
17.5% |
16.1% |
14.6% |
|
MAIZE |
1,949,614 |
5.24 |
9.6% |
14.4% |
5.9% |
6.7% |
|
POTATOES |
1,630,943 |
4.39 |
64.8% |
67.2% |
16.1% |
16.2% |
|
BARLEY |
1,602,311 |
4.31 |
46.4% |
25.7% |
30.4% |
27.5% |
|
BANANAS |
1,175,799 |
3.16 |
9.8% |
36.7% |
0.7% |
7.1% |
|
RICE** |
946,427 |
2.55 |
5.2% |
7.9% |
0.4% |
0.5% |
|
GROUNDNUTS** |
159,496 |
0.43 |
15.4% |
42.4% |
0.0% |
1.5% |
|
SOYBEANS |
106,417 |
0.29 |
1.2% |
50.1% |
0.8% |
13.2% |
|
BEANS, DRY |
101,700 |
0.27 |
4.5% |
24.7% |
0.8% |
3.6% |
|
CASSAVA** |
48,735 |
0.13 |
6.6% |
80.7% |
0.0% |
1.8% |
|
SORGHUM |
40,900 |
0.11 |
2.7% |
13.4% |
0.9% |
2.2% |
|
PLANTAINS |
30,782 |
0.08 |
24.9% |
14.8% |
0.0% |
0.0% |
|
MILLET |
14,786 |
0.04 |
10.2% |
55.1% |
0.0% |
0.4% |
|
CHICK-PEAS |
13,078 |
0.04 |
3.8% |
36.9% |
0.5% |
1.7% |
|
LENTILS |
9,895 |
0.03 |
2.7% |
31.0% |
0.5% |
6.7% |
|
SWEET POTATOES |
9,492 |
0.03 |
25.6% |
72.7% |
0.0% |
0.1% |
* For a listing of member countries of the European Union, see footnote 14.
** Production data are for Rice, Paddy; Groundnuts In Shell; and Cassava.
Trade data are for Rice (Total); Groundnuts, Shelled plus Groundnuts In Shell; and Dried Cassava.
Table 9: Market Share Data for the USA, 1995
|
|
Domestic Exports (US $1,000) |
Domestic Exports per capita |
Domestic Exports/ World Exports |
Domestic Imports/ World Imports |
Domestic Output/ World Output |
Domestic Consumption/ World Output |
|
MAIZE |
7,534,947 |
$28.21 |
77.0% |
0.4% |
36.4% |
24.8% |
|
WHEAT |
5,457,780 |
20.43 |
31.6% |
1.5% |
10.9% |
5.2% |
|
SOYBEANS |
5,427,678 |
20.32 |
71.6% |
0.4% |
46.9% |
28.9% |
|
RICE* |
996,530 |
3.73 |
13.7% |
1.0% |
1.4% |
0.9% |
|
SORGHUM |
682,105 |
2.55 |
83.8% |
0.0% |
21.4% |
11.2% |
|
GROUNDNUTS* |
221,274 |
0.83 |
21.4% |
2.3% |
5.4% |
4.6% |
|
BEANS, DRY |
212,817 |
0.8 |
14.8% |
1.9% |
7.7% |
5.9% |
|
BANANAS |
200,954 |
0.75 |
2.9% |
29.4% |
0.0% |
6.3% |
|
BARLEY |
178,142 |
0.67 |
6.2% |
5.0% |
5.5% |
5.3% |
|
POTATOES |
83,172 |
0.31 |
3.6% |
4.3% |
7.1% |
7.1% |
|
LENTILS |
38,919 |
0.15 |
13.6% |
0.8% |
3.3% |
0.5% |
|
MILLET |
11,005 |
0.04 |
21.7% |
0.5% |
0.7% |
0.5% |
|
SWEET POTATOES |
8,000 |
0.03 |
9.7% |
6.8% |
0.4% |
0.4% |
|
COW PEAS, DRY |
1,438 |
0.01 |
8.9% |
4.3% |
0.1% |
0.0% |
|
PLANTAINS |
0 |
0 |
0.0% |
71.9% |
0.0% |
0.3% |
|
YAMS |
0 |
0 |
0.0% |
92.2% |
0.0% |
0.1% |
* Production data are for Rice, Paddy and for Groundnuts In Shell.
Trade data are for Rice (Total) and for Groundnuts, Shelled plus Groundnuts In Shell.
Table 10: Market Share Data for Rest of Developed Economies* (excluding USA and European Union), 1995
|
|
Group Exports (US $1,000) |
Group Exports per capita |
Group Exports/ World Exports |
Group Imports/ World Imports |
Group Output/ World Output |
Group Consumption/ World Output |
|
WHEAT |
4,147,700 |
$17.63 |
24.2% |
8.3% |
8.4% |
5.4% |
|
BARLEY |
538,216 |
2.29 |
22.1% |
12.5% |
14.4% |
13.0% |
|
MAIZE |
236,883 |
1.01 |
2.5% |
25.0% |
2.5% |
5.9% |
|
SOYBEANS |
172,006 |
0.73 |
2.1% |
18.2% |
2.0% |
6.1% |
|
POTATOES |
147,718 |
0.63 |
8.2% |
4.8% |
4.0% |
3.9% |
|
LENTILS |
113,894 |
0.48 |
44.7% |
2.1% |
15.7% |
6.4% |
|
BEANS, DRY |
96,703 |
0.41 |
6.8% |
15.0% |
2.3% |
3.5% |
|
GROUNDNUTS** |
37,169 |
0.16 |
3.6% |
14.8% |
0.7% |
1.3% |
|
CHICK-PEAS |
18,202 |
0.08 |
12.4% |
3.3% |
3.3% |
3.0% |
|
SORGHUM |
16,247 |
0.07 |
1.8% |
44.4% |
2.9% |
8.1% |
|
MILLET |
4,786 |
0.02 |
6.3% |
18.4% |
0.2% |
0.3% |
|
SWEET POTATOES |
1,822 |
0.01 |
2.9% |
9.0% |
0.9% |
0.9% |
|
BANANAS |
902 |
0 |
0.0% |
11.4% |
0.8% |
3.5% |
* For a listing of countries in the Rest-of-Developed category, see footnote 15.
** Production data are for Groundnuts in Shell; trade data are for Groundnuts, Shelled plus Groundnuts In Shell.
[Figure 1a] Production and Exports (World vs. Developing Countries), 1995
[Figure 1b] Exports (World vs. Developing Countries), 1995
[Figure 2a] Production and Trade (Low-Income Countries), 1995
[Figure 2b] Trade (Low-Income Countries), 1995
[Figure 3a] Production and Trade (China), 1995
[Figure 3b] Trade (China), 1995
[Figure 3c] Fluctuation of Chinese Trade in Wheat and Rice
[Figure 4a] Production and Trade (Middle-Income Countries excluding China), 1995
[Figure 4b] Trade (Middle-Income Countries excluding China), 1995
[Figure 5] Production by Groups of Countries, 1995
[Figure 6] Exports by Groups of Countries, 1995

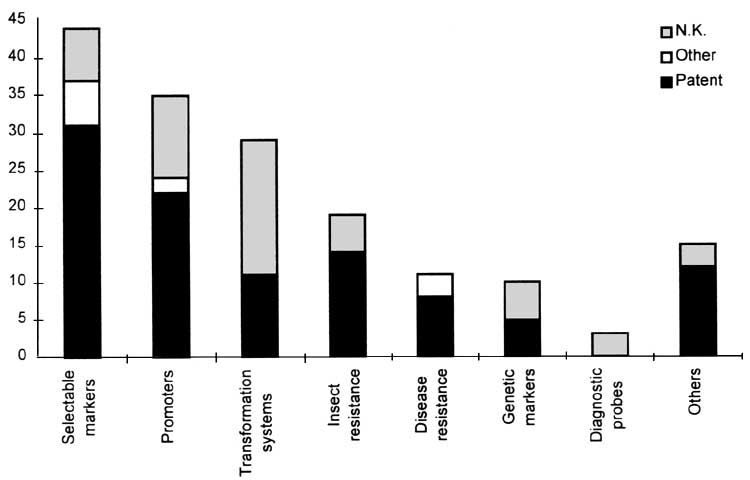
![[Figure 1a] Production and Exports (World vs. Developing Countries), 1995](x5786e01.jpg)
![[Figure 1b] Exports (World vs. Developing Countries), 1995](x5786e02.jpg)
![[Figure 2a] Production and Trade (Low-Income Countries), 1995](x5786e03.jpg)
![[Figure 2b] Trade (Low-Income Countries), 1995](x5786e04.jpg)
![[Figure 3a] Production and Trade (China), 1995](x5786e05.jpg)
![[Figure 3b] Trade (China), 1995](x5786e06.jpg)
![[Figure 3c] Fluctuation of Chinese Trade in Wheat and Rice](x5786e02.gif)
![[Figure 4a] Production and Trade (Middle-Income Countries excluding China), 1995](x5786e07.jpg)
![[Figure 4b] Trade (Middle-Income Countries excluding China), 1995](x5786e08.jpg)