4.1. Overall Resource Allocation to S&W Research
4.2. Agricultural Land Types
4.3. Research Scope
4.4. Research Approach
As S&W-related activities are an essential part of research on natural resources management (NRM), an attempt was made to characterize them in terms of the strategic context in which resource-conserving research is carried out in the respective Centres. It was considered as a useful background to allot activities to the scale of the system at which they are focussed, and to the research approach followed. In most of the MTPs the natural resources dimension of the research strategy is not explicitly stated. That component of the characterization was then derived from reading different chapters of the MTPs and P&Bs, and included in the tables sent to the Centres. Based on the few comments made we believe they correctly interpret the Centre's approach to research on the management of natural resources. Table 3 purports our interpretation of how IARCs approach S&W-related research in their respective mandate areas. CIFOR and IPGRI were not considered at this stage, as they are not undertaking any S&W-related research at the moment.
Table 3: Centres Approach to S&W Research
|
Concentrated around |
Centres |
Focusing on |
|
CROPPING SYSTEMS |
IRRI |
Soil Nutrient Dynamics |
|
ICRISAT |
Legume-based Rotations |
|
|
CIMMYT |
Green Manure and Input Efficiency |
|
|
CIP |
Ecological Characterization and Collaboration |
|
|
FARMING SYSTEMS |
ICARDA |
Legume-based Rotations |
|
ILRI |
Crop-Livestock Interactions |
|
|
ICLARM |
Ecological Sustainability |
|
|
LAND RESOURCES |
ICRAF |
Soil Processes |
|
WARDA |
Cropping Systems |
|
|
CIAT |
Production Systems |
|
|
IITA |
Production Systems |
|
|
INSTITUTIONS |
IFPRI |
Decisions of Poor Farmers |
|
IIMI |
Management |
|
|
ISNAR |
Research Organization |
Against this background, the information supplied by Centres was analyzed in response to the three issues posed as questions for the study: target land types, scope of research on the systems' scale, and research approach. But before discussing the results for each of the three dimensions it is useful to examine the overall picture of Centres' allocation of resources to S&W research.
Table 4 shows the 1996 budgeted allocations of each of the 14 Centres.
Table 4: Resources Allocated to S & W Research
|
Centre |
in US$ '000 |
as % of Centre's Total |
|
CIAT |
3,538 |
9.4 |
|
CIMMYT |
1,299 |
4.1 |
|
CIP |
1,140 |
5.4 |
|
ICARDA |
1,903 |
8.2 |
|
ICLARM |
1,130 |
12.1 |
|
ICRAF |
7,139 |
40.4 |
|
ICRISAT |
4,923 |
16.2 |
|
IFPRI |
2,499 |
15.1 |
|
IIMI |
8,860 |
92.8 |
|
IITA |
5,587 |
17.5 |
|
ILRI |
938 |
3.7 |
|
IRRI |
7,336 |
16.8 |
|
ISNAR |
838 |
8.0 |
|
WARDA |
2,246 |
26.0 |
|
TOTAL: |
49,376 |
|
Allocation by the Centres to S&W research represents 17 percent of the total CGIAR funding for 1996 (estimated at 300 million USD). This is equivalent to two large "resources" centres of the size of IITA, fully dedicated to S&W research. Some Centres intimated that the study was following a "conservative" approach in its selection of activities under S&W research. Should the total figure indeed represent a conservative estimate, this would suggest that a substantive proportion of the total CGIAR funding is, in relative terms, allocated to S&W research. It should be noted that the share of efforts in water research, as represented by the ICLARM and IIMI budgets, accounts for 20 percent of the total S&W budget. It was not possible, however, to calculate the proportion corresponding to water-related research in soils studies.
As it can be seen, there are large differences among Centres on the proportion of budget allocated to S&W research, indicated by a Coefficient of Variation (CV) of 118 % on a mean of 19.7 percent. Even if IIMI is excluded, as the only "resources" Centre, the CV is still as high as 72.2 % on a mean of 14.1 percent. The proportion allocated by Centres ranges from minimums of 3.7 percent for ILRI and 4.1 for CIMMYT, to maximums of 40.4 for ICRAF and 26.0 for WARDA.
Table 5 indicates what are the main agricultural lands targeted by the CGIAR Centres. As expected, irrigated lands are the receptors of the largest investments, including almost all of IIMI's budget. If rainfed lowlands were considered as relatively high-potential lands and added to irrigated lands, 35 to 40 percent of total CGIAR investments in the field of S&W research would be allocated to research on well-endowed lands.
Table 5: Investments by Land Types
|
Agroecological Zone |
Land Types |
Investments |
|
|
(in US$ '000) |
(% of CGIAR Total) |
||
|
Warm arid and semi-arid tropics and subtropics |
Semi-arid |
6,581 |
13.5 |
|
Warm subhumid tropics and subtropics |
Savannas |
7,712 |
15.8 |
|
Hillsides |
2,577 |
5.3 |
|
|
Warm humid tropics and subtropics |
Rainfed Lowlands |
5,696 |
11.7 |
|
Forest Margins |
6,590 |
13.5 |
|
|
Cool tropics and subtropics |
Highlands |
4,306 |
8.8 |
|
Cool subtropics, winter rainfall |
Semi-arid |
2,084 |
4.3 |
|
Cross agroecozones |
Irrigated |
13,303 |
27.2 |
Note: In the case of ISNAR only those resources specifically allocated to the Highlands were included
Two investment-level groups can be distinguished among the other six land types, the so-called marginal or fragile lands. Highlands, hillsides and semi-arid lands (cool sub-tropics) are getting an average of 6 percent of the total S&W budget. The savannas, forest margins and semi-arid lands (warm tropics) get an average of 14 percent. This level of investments group could be joined by the highlands and hillsides, if these were to be grouped under a steeplands banner.
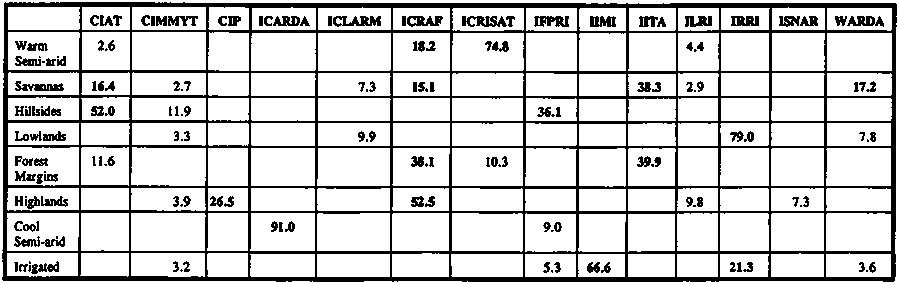
S&W investments across land types could also be seen from the point of view of Centres' funding commitments to research on their sustainable development. That perspective is represented in Table 6, where CGIAR investments are seen as a percentage of the total amount committed by each centre to that particular land type.
In many of the land types it is quite evident that particular Centres have a clear quantitative lead in efforts on S&W research. Thus, as expected, S&W research by ICRISAT and ICARDA in the warm and cool semi-arid lands respectively, IRRI in the rainfed lowlands and IIMI in the irrigated lands account for close to 70 percent or more of all CGIAR activities in those land types. In the highlands ICRAF and CIP account for almost 80 percent of such efforts, a similar figure to that accounted for by CIAT and IFPRI in the hillsides and IITA and ICRAF in the forest margins. It is only in the savannas where more than two Centres have a substantive share of the total CGIAR efforts in S&W research. There IITA holds close to 40 percent of the total "shares", followed by WARDA, ICRAF and CIAT with around 15 percent each.
Should TAC consider a landtype-based coordination of Systemwide S&W research efforts, Centres' current share of total commitments could provide a good rationale for the allocation of responsibilities.
As reflected by the discussion in Section 2.2 on the Scope of S&W Research, it was initially understood that the analytical framework should include four levels in the hierarchy of agricultural systems: field, farm, watershed and country/region. An analysis of available information indicated, however, that these four levels could be combined into two, to characterize on-site and off-site research. Table 7 presents the estimates of resources allocated by each centre to on-site and off-site research activities. The former brings together research focused on the field and farm levels, considering the farm as the basic unit for managing natural resources in agricultural production. Off-site constitutes research at the watershed/community levels, and relates to the effect of on-site practices (at farm levels) on off-site processes (i.e., reservoir sedimentation). We realize that in this case boundaries are not so clearly recognizable as at the farm level, but in it we include research on both other sub-systems affected by decisions made at the farm level, or viceversa, and institutional areas whose deliberations influence farmers' decision-making.
Table 6: Centres' Resource Allocation to S & W Research by Land Type
(as % of the total amount invested in each land type)
Table 7: Scale Focus of Research Efforts
|
Centre |
On-site |
Off-site |
|
(as % of the Centre's S & W Budgets) |
||
|
CIAT |
76.6 |
23.4 |
|
CIMMYT |
100.0 |
- |
|
CIP |
74.0 |
26.0 |
|
ICARDA |
71.5 |
28.5 |
|
ICLARM |
100.0 |
- |
|
ICRAF |
73.5 |
26.5 |
|
ICRISAT |
90.7 |
9.3 |
|
IFPRI |
40.0 |
60.0 |
|
IIMI |
28.5 |
71.5 |
|
IITA |
88.0 |
12.0 |
|
ILRI |
49.7 |
50.3 |
|
IRRI |
86.9 |
13.1 |
|
ISNAR |
3.0 |
97.0 |
|
WARDA |
73.8 |
26.2 |
In this case variation among Centres is not as large as that for resources allocated to S&W research. For all 14 Centres the average proportion of on-site research is 69 percent, with a CV of 41.9 %. When ISNAR is not included in the analysis, given the special nature of its activities, the average increases to 74 percent and the CV decreases to 30.6 %. Estimates range from minimums of 28.5 percent for IIMI and 40 for IFPRI to maximums of 90.7 percent for ICRISAT and 100 percent for CIMMYT. But even those figures would be misleading, given the social nature of the policy and management research carried out by both institutes (and therefore, off-site by definition). It would be more meaningful to examine those of ILRI (49.7 percent) or ICARDA (71.5).
Figures indicating the low proportion of total S&W resources being allocated to off-site research are of special concern, as off-site environmental costs of on-site unsustainable management practices are considered to be higher than their impact on productivity. It is precisely this type of information that led TAC to recommend activities on spatial or landscape level linkages as an essential component of the integrated approach to natural resources management research. In principle this would require that a higher proportion of funds are allocated to off-site studies, including interactions between land types in the watershed and property rights.
A positive finding is that agroecological characterization accounts for a significant proportion of current off-site activities (27 %), a necessary base to develop off-site research. But, although such activities are certainly essential to plan and implement research to predict off-site impacts of on-site management systems, they could also be used mainly for descriptive purposes instead.
Linkages between productivity-enhancing and resource-conserving research constitute another set of concerns that figures prominently in TAC's framework for the recommended integrated approach to natural resources management research. Questions posed to the Centres, unfortunately, were not specifically aimed at estimating that relationship. However, resources allocated to activities included in the field and farm scales could be used as proxies to estimate such a linkage in current research. Proportions of resources allocated to field and farm levels are presented in Table 8, as percentages of total on-site activities.
Table 8: Resources Allocated to Field and Farm Levels of Research
|
Centre |
Field |
Farm |
|
(as % of total on-site resources) |
||
|
CIAT |
55.7 |
44.3 |
|
CIMMYT |
55.2 |
44.8 |
|
CIP |
22.3 |
77.7 |
|
ICARDA |
56.5 |
43.5 |
|
ICLARM |
26.5 |
73.5 |
|
ICRAF |
77.9 |
22.1 |
|
ICRISAT |
52.0 |
48.0 |
|
IFPRI |
25.0 |
75.0 |
|
IIMI |
88.1 |
11.9 |
|
IITA |
71.2 |
28.8 |
|
ILRI |
40.0 |
60.0 |
|
IRRI |
57.7 |
42.3 |
|
WARDA |
61.1 |
38.9 |
|
Mean |
53.0 |
47.0 |
The assumption is that field activities focus essentially on resource-conserving research (see list in Table 2), while those at the farm level are mainly of a productivity-enhancing nature. It follows then that an even proportion of resources allocated to the two levels would indicate the existence of a linkage between the two research focuses. Average figures for percentages allocated to field and farm levels of research would indicate this to be the case, although the high CVs (38% and 43% for field and farm levels respectively) indicate large variation among Centres.
It is recognized that the information gathered from Centres does not specifically indicate linkages between the two levels of activities. But it seems fair to assume that Centres are focusing on the same problem when working at two scales along the systems hierarchy. Should these assumptions be correct, it could be said that the link between productivity-enhancing and resource-conserving activities is already part of the Centres operational framework, albeit with large variation among them.
Another important linkage in TAC's integrated framework is that between research and adoption. There are no proxies in this case that would allow us to estimate such a link. It could only be said that, judging by described activities, the majority of Centres appear to have incorporated a participatory approach in the design and evaluation of management practices.
As discussed above, this component of the study refers to the classification of research activities according to their applied or strategic nature, in relation to the system-and-process paradigm. Information was analyzed according to the framework presented in Table 2, with the qualifications discussed in Section 3. Table 9 presents the percentage of resources allocated by each Centre to the two research approaches.
Table 9: Centre Approaches to S & W Research
|
Centre |
Research Approach |
|
|
Applied |
Strategic |
|
|
(% of total S & W Research Budget) |
||
|
CIAT |
42.8 |
57.2 |
|
CIMMYT |
66.0 |
34.0 |
|
CIP |
64.9 |
35.1 |
|
ICARDA |
74.1 |
25.9 |
|
ICLARM |
100.0 |
- |
|
ICRAF |
61.1 |
38.9 |
|
ICRISAT |
87.7 |
12.3 |
|
IFPRI |
70.0 |
30.0 |
|
IIMI |
60.0 |
40.0 |
|
IITA |
52.4 |
47.6 |
|
ILRI |
91.9 |
8.1 |
|
IRRI |
56.7 |
43.3 |
|
ISNAR |
27.0 |
73.0 |
|
WARDA |
73.5 |
26.5 |
On the average Centres allocate two-thirds of the total S&W budget to applied activities, with a CV of 29.1 %. If, for the reasons already stated we do not include ISNAR, the average increases to 69 percent. In this case proportions of budgets range from minimums of 42.8 percent for CIAT and 52.4 for IITA to maximums of 91.9 percent for ILRI and 100 for ICLARM.
Location-specificity is a main characteristic of research on the management of natural resources, but the CGIAR has given renewed emphasis to focusing its activities on issues of an international public goods nature. In this context, knowledge of mechanisms and processes governing the sustainable management of S&W resources appears as the approach Centres should follow. The high proportion of funds allocated to applied research is then an issue that may require further deliberation by the Committee.
To contribute to such a deliberation it was decided to take the analysis a step further. We examined the approach followed by Centres according to both the system scale at which research is conducted and the land types on which such research focuses. Table 10 presents the percentages of the S&W budgets being allocated by Centres to applied and strategic research in their on-site and off-site focused activities.
Table 10: Research Approach by System-Scale Focus
|
Centre |
On-Site |
Off-Site |
||
|
Applied |
Strategic |
Applied |
Strategic |
|
|
(as % of total on-site activities) |
(as % of total off-site activities) |
|||
|
CIAT |
48.9 |
51.1 |
22.5 |
77.5 |
|
CIMMYT |
66.2 |
33.8 |
- |
- |
|
CIP |
56.2 |
43.8 |
89.6 |
13.4 |
|
ICARDA |
75.1 |
24.9 |
71.6 |
28.4 |
|
ICLARM |
100.0 |
- |
- |
- |
|
ICRAF |
62.3 |
37.7 |
57.6 |
42.4 |
|
ICRISAT |
86.4 |
13.6 |
100.0 |
- |
|
IFPRI |
100.0 |
- |
50.3 |
49.7 |
|
IIMI |
100.0 |
- |
43.6 |
56.4 |
|
IITA |
45.9 |
54.1 |
100.0 |
- |
|
ILRI |
100.0 |
- |
83.9 |
6.1 |
|
IRRI |
54.2 |
45.8 |
73.1 |
16.9 |
|
ISNAR |
100.0 |
- |
24.7 |
75.3 |
|
WARDA |
66.9 |
33.1 |
92.2 |
7.8 |
It should be noted that in this case the analysis examines each of the sites as independent sets of data, i.e. percentages allocated to applied and strategic research within each on-site and off-site activities add up to 100.
For on-site activities the average proportion of funds allocated to applied research is as high as 76 percent (CV 21 %). And even within the off-site category applied research accounts for 67 percent (CV 28%). Proportions between applied and strategic within on- and off-site activities are then consistent with the unbalanced picture seen for all S&W data.
When the analysis is taken to the allocation of funds within land types (see Table 11), percentages allocated to applied research within on-site activities also fall within the proportions for all S&W data (68 and 32 percent respectively, with CV of 17% and 37%). Within off-site activities percentages are slightly more balanced between applied and strategic research (63 and 37 percent respectively, with CV of 32% and 55%). This is influenced by considerably higher than average allocations to strategic research in the hillsides and irrigated lands. A closer look shows that such allocations correspond to heavier work on public systems management, a fundamental "tool" in the management of natural resources in both types of lands.
Table 11: System Scale and Research Approach by Land Types
|
Land Type |
On-Site |
Off-Site |
||
|
Applied |
Strategic |
Applied |
Strategic |
|
|
(as % of total CGIAR resources allocated to the land type within on- and off-site activities) |
||||
|
Warm Semi-arid |
85.6 |
14.4 |
52.1 |
47.9 |
|
Savannas |
61.9 |
38.1 |
77.7 |
22.3 |
|
Hillsides |
77.8 |
22.2 |
26.6 |
73.4 |
|
Lowlands |
61.6 |
38.4 |
86.7 |
13.3 |
|
Forest Margins |
49.0 |
51.0 |
82.2 |
17.8 |
|
Highlands |
62.0 |
38.0 |
66.8 |
33.2 |
|
Cool Semi-arid |
76.2 |
23.8 |
67.6 |
32.4 |
|
Irrigated |
73.5 |
26.5 |
45.9 |
54.1 |