![]()
![]()
![]()
The starting point for this part of the analysis is the derivation of a research production function for the three principal regions; Asia (including China), SSA and LAC.
The research production describes the relationship between the rate of annual growth in the output of rice attributable to the CGIAR research effort and the long-term sustained level of CGIAR core funding for rice research.
In deriving such a relationship, the following key points are used:
(i) in the absence of CGIAR core funding, the rate of annual output growth would be zero. This rather obvious point establishes that the function should pass through the origin;(ii) increased funding will lead to higher annual rates of growth. Were this not the case, the CGIAR could also add to the outputs of rice by cutting its funding;
(iii) those increments to output growth become successively smaller as research funding increases; i.e. there are diminishing returns to extra funding; and
(iv) the annual rate of output growth would not exceed same ceiling level determined by reference to maximum historical rates.
A simple functional relationship which captures these essential features is given by:
y = a[1 - exp (-bx)]
where
y = annual rate of output growth attributable to CGIAR core funding;x = level of CGIAR funding, where x = 1 compares to present funding levels;
a, b = parameters of the function, where a defines the upper ceiling, and b determines the shape of the function.
Given the value of parameter a, together with the growth rate when x = 1, we can solve for the unknown parameter b. This was done for each of the three principal regions. As in example, consider the values set out in Appendix Table B.1 below.
Table B.1: Estimates of the Research Production Function: by Region
|
|
Asia |
SSA |
LAC | ||
|
Asymptote (a) |
% |
1.0 |
5.0 |
4.0 | |
|
Growth rates of: |
|
|
|
| |
|
|
Area |
% |
0.0 |
2.0 |
2.0 |
|
|
Yield |
% |
2.0 |
2.0 |
2.0 |
|
|
Output |
% |
2.0 |
4.0 |
4.0 |
|
Share attributable to CGIAR |
% |
25.0 |
50.0 |
50.0 | |
|
Value of y when x = 1 |
|
0.5 |
2.0 |
2.0 | |
|
Estimate of the parameter (b) |
|
0.69 |
0.51 |
0.62 | |
It is recognized that the function may be discontinuous because of the problem of critical mass.
Consider the question of reallocating research expenditures, in this case from sub-Saharan Africa to Asia. The problem is illustrated in Figure B. 1.
Figure B.1 (a) Research Production Function for Asia
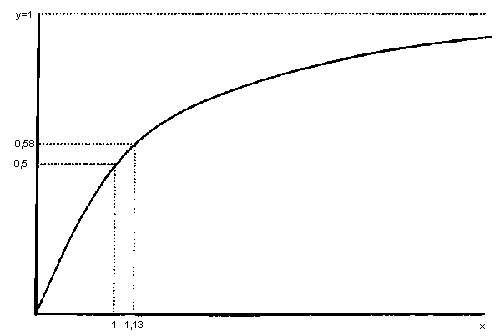
Figure B.1 (b) Research Production Function for SSA
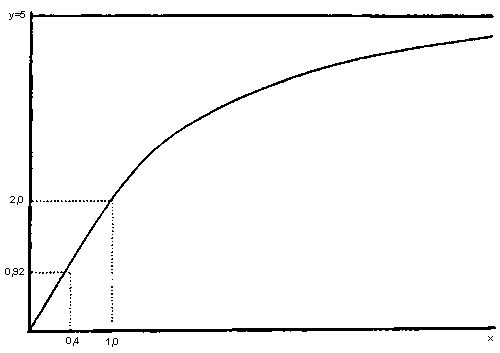
In Figure B.1, 60 percent of the present funding is transferred from sub-Saharan Africa [part (b)] to Asia [part (a)]. The result is to reduce the index of relative funding ® in sub-Saharan Africa to 0.4, and increases to x = 1.13 in Asia. Because of the different absolute sizes of initial funding (US$ 23.8 million for Asia and US$ 8.43 million for sub-Saharan Africa) the values of x do not rise and fall in proportion.
The value of y (the output growth rate) rises from 0.50 to 0.56 in Asia as a consequence of the additional funding, while declining from 2.00 to 0.92 in SSA, as the funding level is reduced.
Table B.2: Impact on Output Growth Rates in Asia and sub-Saharan Africa from a Reallocation of Funding
|
Share of SSA Funding Reallocated |
Value of x |
Value of y |
||
|
SSA |
Asia |
SSA |
Asia |
|
|
0.0 |
2.00 |
1.00 |
2.00 |
0.50 |
|
0.2 |
1.68 |
1.07 |
1.68 |
0.52 |
|
0.4 |
1.32 |
1.13 |
1.32 |
0.54 |
|
0.6 |
0.92 |
1.20 |
0.92 |
0.56 |
|
0.8 |
0.49 |
1.26 |
0.49 |
0.58 |
|
1.0 |
0.00 |
1.33 |
0.00 |
0.60 |
The values of y constructed in Table B.2, are based on the parameter estimates for the respective regions given in Table B.1.
Table B.3: Rates of Productivity Growth Needed in SSA and LAC for the Rate of Return on Investment in Rice Research to be Equated Across all Regions: 1987-2030
|
|
ASIA |
SSA |
LAC |
|
Growth Rates (%) | |||
|
Area (% pa) |
0.0 |
2.0 |
2.0 |
|
Yield (% pa) |
2.0 |
8.9 |
2.2 |
|
Output |
2.0 |
10.9 |
4.2 |
|
Assumptions | |||
|
Share of growth attributable to CGIAR (%) |
25.00 |
50.00 |
50.00 |
|
Research lag (years) |
10 |
10 |
10 |
|
Adoption lag (years) |
10 |
10 |
10 |
|
Annual research expenditures (US$ million) |
25.80 |
8.43 |
4.20 |
|
Maintenance research costs as share of base research expenditure (%) |
25.00 |
0.0 |
0.0 |
Based on rice price of US$284/ton.
![]()
![]()
![]()