![]()
![]()
![]()
4.1 Species composition and distribution
4.2 Abundance
4.3 Fishing experiments
4.1.1 Leiognathidae
4.1.2 Pelagic fish
4.1.3 Demersal fish
4.1.4 Rays and sharks
4.1.5 Crustacea and squids
The species composition in the demersal trawl catches in different depth intervals are shown in Table 4.1.
+) indicates less than 0.5%
According to Table 4.1 this group is very abundant in waters shallower than 50 m. About 20-40% of the catches in this depth belonged to this group. The most important species were Leiognathus leusiscus, L. equulus, L. fasciatus, Secutor insidiator and Gazza minuta. In the Zanzibar channel and about 20 nautical miles north of Kilwa Kiwinje catch rates of 900 - 1500 kg/hour were obtained.
In waters deeper than 50 m the catches of Leiognathidae were very poor. In Indonesian waters the Leiognathidae were most abundant at a depth of about 25 m (Pauly, 1977).
Pelagic fish families as Clupeoidea, Engraulidae, Carangidae and Sphyraenidae were most abundant in the demersal catches from waters shallower than 200 m (Table 4.1). The pelagic species observed in the Tanzanian waters were rather small sized fish. In the typical pelagic community various species of sardinella and scads contributed the main part. Sardinella sirm, S. gibbosa, S. albella and to some extent the S. leiogaster were the most abundant and widespread clupeoids in the shallower area. Some kingfish (Scomberomorus spp) and large jacks (Caranx spp) were present throughout the area. Important scads were Decapterus maruadsi, D. macrosoma, Atule mate and a variety of Carangoides spp. At the Mafia plateau during the last survey some schools of pelagic species mainly round scad (Decapterus russelli), were observed by the acoustic equipment as “knots” close to the bottom in daylight.
Pelagic trawl hauls were intended for identification of pelagic scattering layers. However, registrations of pelagic fish were poor. Such registrations were few and far apart, and therefore few pelagic trawl hauls were carried out for identification purposes. During the first survey a rather large pelagic catch was made in the Kilwa Kiwinje area. The main species in this catch of about 260 kg per hour were Sardinella albella, S. gibosa and Dussumiera acuta. North of Mafia about 80 kg per hour of Decapterus kurroides and Dussumiera acuta were taken. D. kurroides were relatively often caught in deeper waters. During the second survey about 50 kg of Stolephorus spp. larvae were caught in the Zanzibar channel North of Dar es Salaam. Some Stolephorus spp. larvae were also caught in the surface on the western coast of Zanzibar. During the third survey about 300 kg per hour of the anchovy Stolephorus punctifer were caught in the Zanzibar channel.
Catches and registrations of mesopelagic fish were very poor. The catch rates never exceeded 5 kg per hour. The registrations were made in the upper 200 m in the area outside the shelf.
The demersal species were most abundant in the trawl hauls from deeper waters. The demersal fish caught were mostly small sized. Only a few larger fishes were caught, mainly snappers (Lutjanidae) and sweetlips (Pomadasydidae). Rock cods (Epinephelus spp.) were present in small numbers in several catches. A big Epinephelus tauvina of about 150 kg and 2 m long was caught south of the Mafia Island during the first survey. Lizard fishes, mainly the brushtooth lizard fish (Saurida undosquamis) were present in fair numbers in most catches in shallow areas. Some were also caught in deeper waters and they were usually of a bigger size.
In the central part of the Zanzibar channel catches of 200-300 kg per hour of damsel fish (Teixeirichthys jordani) were made. This is a small fish (5-10 cm) without any commercial value.
During the two last surveys some trawl stations were made around the Latham Island. The best catches was made west of the island during the second survey at about 140 m depth. The catch rate was about 1700 kg per hour and the main species were Pristipomoides filamentosus and P. sidensis. The individual weights were 1-4.5 kg. This trawl haul was done due to good registration at the bottom on the acoustic equipment.
The main species caught in demersal trawl hauls in deeper waters were Saurida undosquamis, S. tumbil and Chloropthalmus agassizi.
Except for the third survey Table 4.1 demonstrates that the catch rates of rays and sharks increase with increasing depth within the investigated area. The highest observed average catch rate of rays and sharks were 144 kg in waters shallower than 20 m during the last survey. This was due to a big catch of devil rays (Mobulidae) east of Mbegani. The catch rate was 1800 kg per hour. Each of the rays weighed about 20 kg.
The most common species were Dasyatis spp., Rhizoprionodon acutus and Centrophorus moluccensis.
The catch rates of shrimp and prawns were rather poor. The biggest catch of shrimps was made east of Dar es Salaam during the first survey. The haul gave 130 kg per hour at 325 m depth.
The lobster and squid catches were also very small. Most of the catches especially in the shallower areas contained a small amount of squid. The largest catch of small-squids was taken in the northern part of the Zanzibar channel. This was in the deeper part of the channel, about 300 m, and the catch was about 50 kg per hour.
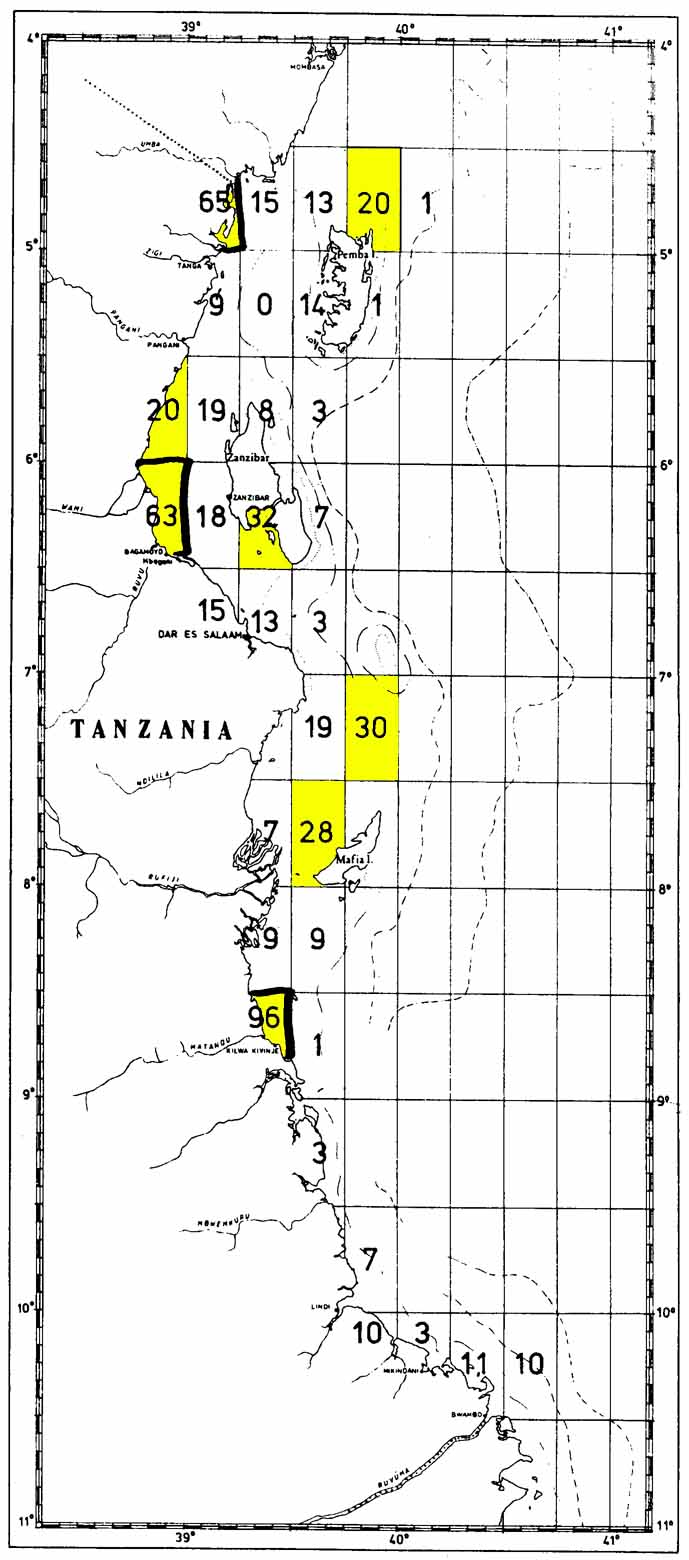
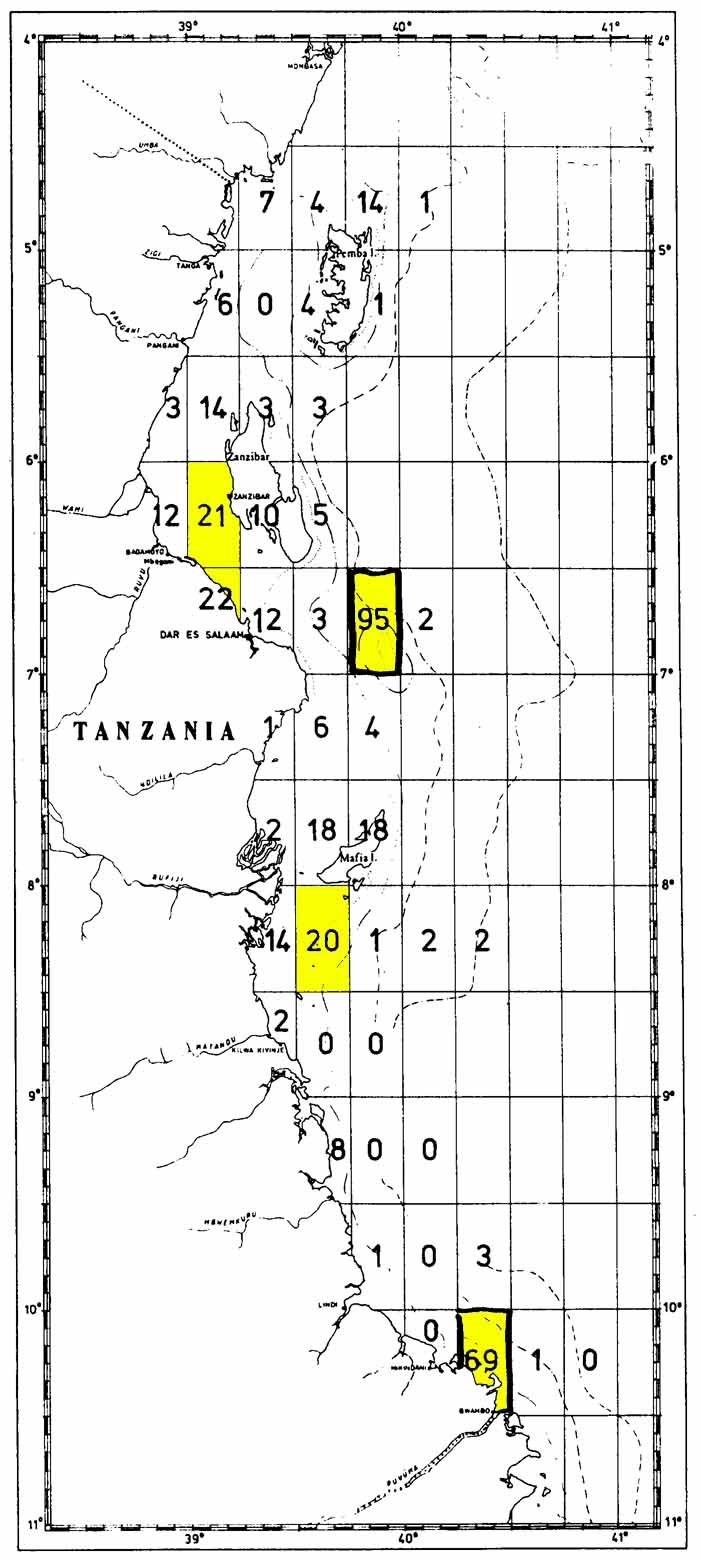
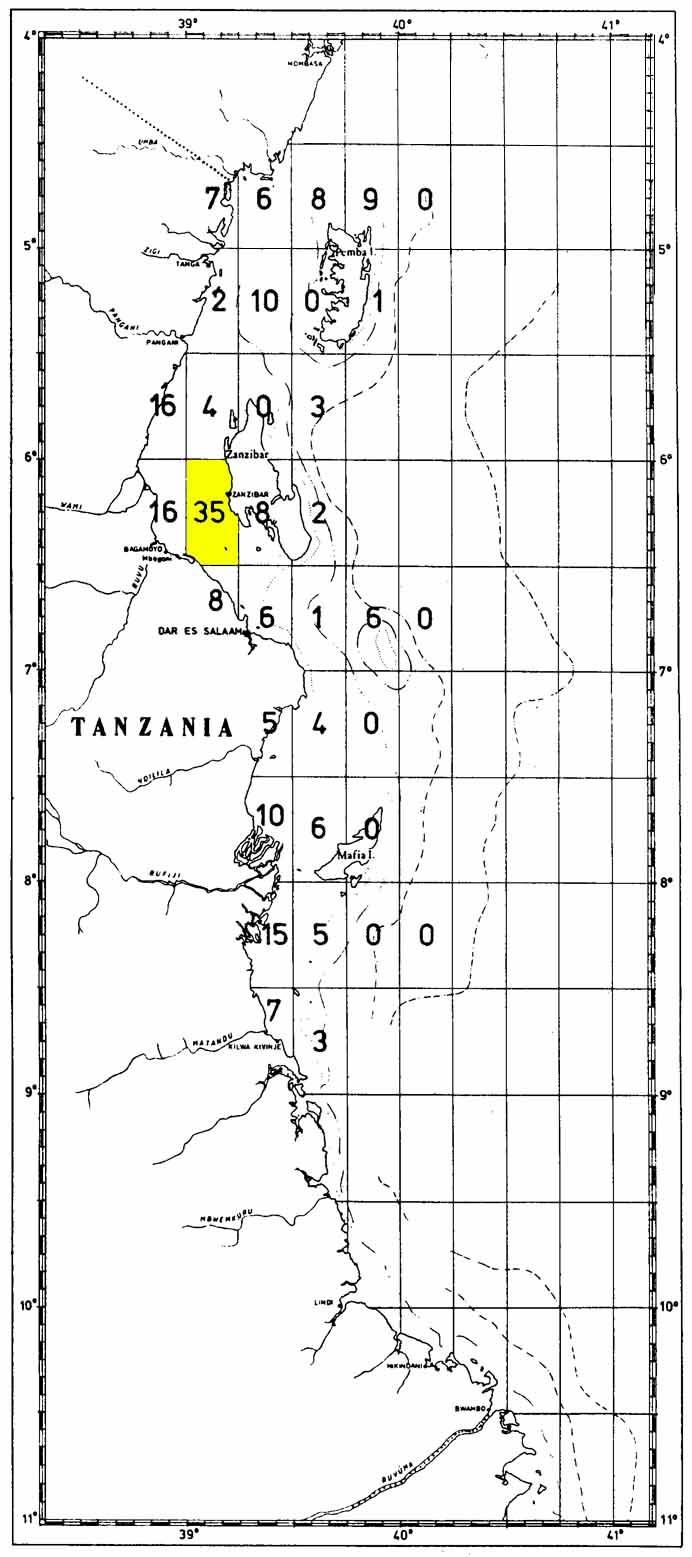
The average integrator readings for fish were calculated
within rectangles of 30 x 15 nautical miles for each of the three surveys as
shown in Figs. 4.2.1 - 4.2.3. During the three surveys rather good
concentrations of fish were obtained in the Zanzibar channel. In the deeper
parts of the investigated area the integrator values were low. The fish biomass
was estimated within each rectangle according to the formula:
 where B is biomass, C is a
conversion coefficient,
where B is biomass, C is a
conversion coefficient,  the
average integrator reading and A is the area of the rectangle. The C value was
calculated according to C = 0.8 -
the
average integrator reading and A is the area of the rectangle. The C value was
calculated according to C = 0.8 -
 where
is the average length of
the dominant species. Species from the most important contributed about 75% of
the total catch for the three surveys. Based on the weighed modal length of
these species the representative length to go into the formula was estimated at
14-17 cm. The biomass was estimated according to an average length of 15 cm. The
fish biomass estimates are shown in Table 4.2.1
where
is the average length of
the dominant species. Species from the most important contributed about 75% of
the total catch for the three surveys. Based on the weighed modal length of
these species the representative length to go into the formula was estimated at
14-17 cm. The biomass was estimated according to an average length of 15 cm. The
fish biomass estimates are shown in Table 4.2.1
Table 4.2.1 The estimated fish biomass in thousand tonnes for the three acoustical surveys.
|
Survey |
Investigated area |
Inshore waters |
||||
|
Area |
1 |
2 |
3 |
1 |
2 |
3 |
|
North of 9°S |
128 |
83 |
72 |
34 |
8 |
12 |
|
South of 9°S |
46 |
23 |
- |
4 |
5 |
- |
|
Total |
174 |
106 |
|
38 |
13 |
|
This indicate that the total biomass for the last survey is in the order of 90 000 - 100 000 tonnes. Therefore a similar fish biomass was observed during the two last surveys being about 40% lower than estimated during the first survey.
The acoustic estimates are probably underestimated due to several factors. The acoustical equipment is not able to observe fish close to the bottom or in the surface layer. The poor catches of the pelagic trawl in the surface layer indicate that the biomass was not seriously underestimated due to this. Investigations in other areas (Olsen et al, 1982) have demonstrated that the noise of the research ship might scare fish away, and thereby dilute the fish concentrations. The C value in the formula is very essential for the biomass estimate, and thereby the representative length to go into this formula. The estimates were carried out with an average length of 15 cm. By changing this length by 1 cm, the biomass estimate will increase or decrease by about 7%.
The inshore waters were not investigated during the four surveys. If the fish abundance in these waters is similar to the abundance observed in the western border of the investigated area, an estimate of the fish biomass in the inshore waters could be carried out (Table 4.2.1). According to this the fish biomass in the inshore waters and the investigated area is in the order of 100 000 - 210 000 tonnes.
The size of the strata within the standard survey area applied for estimating fish biomass based on the swept area method are shown in Table 4.2.2. The average catch rates and numbers of demersal trawl hauls for the different strata are shown in Table 4.2.3. The catch of sharks and rays are not included in the catch rates. The trawl hauls around Latham island have also been excluded because they were carried out according to fish observation on the acoustic equipment. For the southern area to few trawl hauls were carried out to give an estimate based on the swept area method. The biomass estimates for the area north of 9°S are given in Table 4.2.4.
Table 4.2.2 The area of the different strata in square nautical miles.
|
Depth interval (m) |
<20 |
20-50 |
50-200 |
>200 |
|
Area |
|
|
|
|
|
Pemba |
100 |
150 |
1000 |
850 |
|
Zanzibar |
150 |
800 |
910 |
370 |
|
Mafia |
600 |
600 |
770 |
2150 |
|
The Southern area |
10 |
10 |
100 |
2200 |
 = kg/hour) and numbers (N) of demersal trawl hauls for the three surveys in each
strata. (Exclusive rays and sharks).
= kg/hour) and numbers (N) of demersal trawl hauls for the three surveys in each
strata. (Exclusive rays and sharks).
Table 4.2.4. The estimated fish biomass in thousand tonnes for each of the three surveys based on the swept area method. Area north of 9°S.
|
Survey |
1 |
2 |
3 |
|
Biomass |
56 |
50 |
50 |
The estimates based on the acoustic method are 1.4 to 2.3 times greater than the swept area estimates. Therefore the efficiency of the trawl is probably less than one. The same difference between the acoustic estimates and swept area estimates were observed in similar investigations with “Dr. Fridtjof Nansen” in Kenyan waters (Iversen, 1984). The difference in biomass of about 40% from the first to the two next surveys as observed by the acoustic equipment, is not reflected in the swept area estimates. These estimates were quite similar for the three surveys. This was also observed in the Kenyan waters (Iversen, 1984). The acoustic estimates include fish located above the part of the water column fished by the demersal trawl. The opening of the demersal trawl is about 6 m. However, the acoustic estimates does not include fish close to the bottom. Fish in this blind zone is probably included in the estimates based on the swept area method.
According to (Iversen, 1984) the fish biomass is 5-6 times higher than in Kenyan waters. This difference in fish biomass is reflected in the catch statistics for the two countries. The average catch in Tanzanian waters during the period 1975-1980 was about 40 000 tonnes (Yonazi pers. comm.). The average catch in Kenyan waters during the same period was about 5000 tonnes.
The target strength of sharks and rays is rather low. Therefore for comparison with the acoustic estimate they were excluded in the biomass estimate based on the swept area method. The biomass of the elasmobranchs estimated by this method was about 5000 tonnes for the two first surveys and about 10 000 tonnes for the last survey. The relatively larger biomass estimated for the last survey was mainly due to a big catch of devil rays east of Mbegani (section 4.1.4).
4.3.1 Experiments with fish traps and long-lines
4.3.2 Comparative trawling
During the two last surveys 13 and 5 fish trap stations were made. In addition 3 long-line stations were carried out during the second survey. The traps were placed in chains of 5, 9 or 10 in depths ranging from 3 to 40 m. The catch rates were rather good. As much as about 3 kg fish per trap per night was caught. The largest specimens caught were Epinephelus spp. (9.3 kg/82 cm), and Lutjanus coccineus (7 kg/80 cm). However, the small Therapon theraps was the most numerous species in the trap catches. The bait was mainly small squids, but small fish was used in some of the traps. However, no difference in catch according to bait was observed. The long-lines caught rather well. They were in the water for about one hour, and the bait was squid. The best catch was taken about 25 nautical miles north west of Mafia. The main species were Arius thalassinus, Dasyatis jenkinsii and some Murenidae. Placed in proper areas the traps and long-lines fish very well.
Four trawl stations in the Zanzibar channel were worked together with “Mafunzo” during the second survey. The depth range was 20-43 m. The catch rates are shown in Table 4.3.1.
Table 4.3.1 Catch rates (kg/hour) for the comparative trawl experiments.
|
Depth (m) |
20 |
29 |
32 |
43 |
|
“Mafunzo” |
362 |
368 |
476 |
198 |
|
“Dr. Fridtjof Nansen” |
176 |
94 |
238 |
384 |
![]()
![]()
![]()