![]()
![]()
![]()
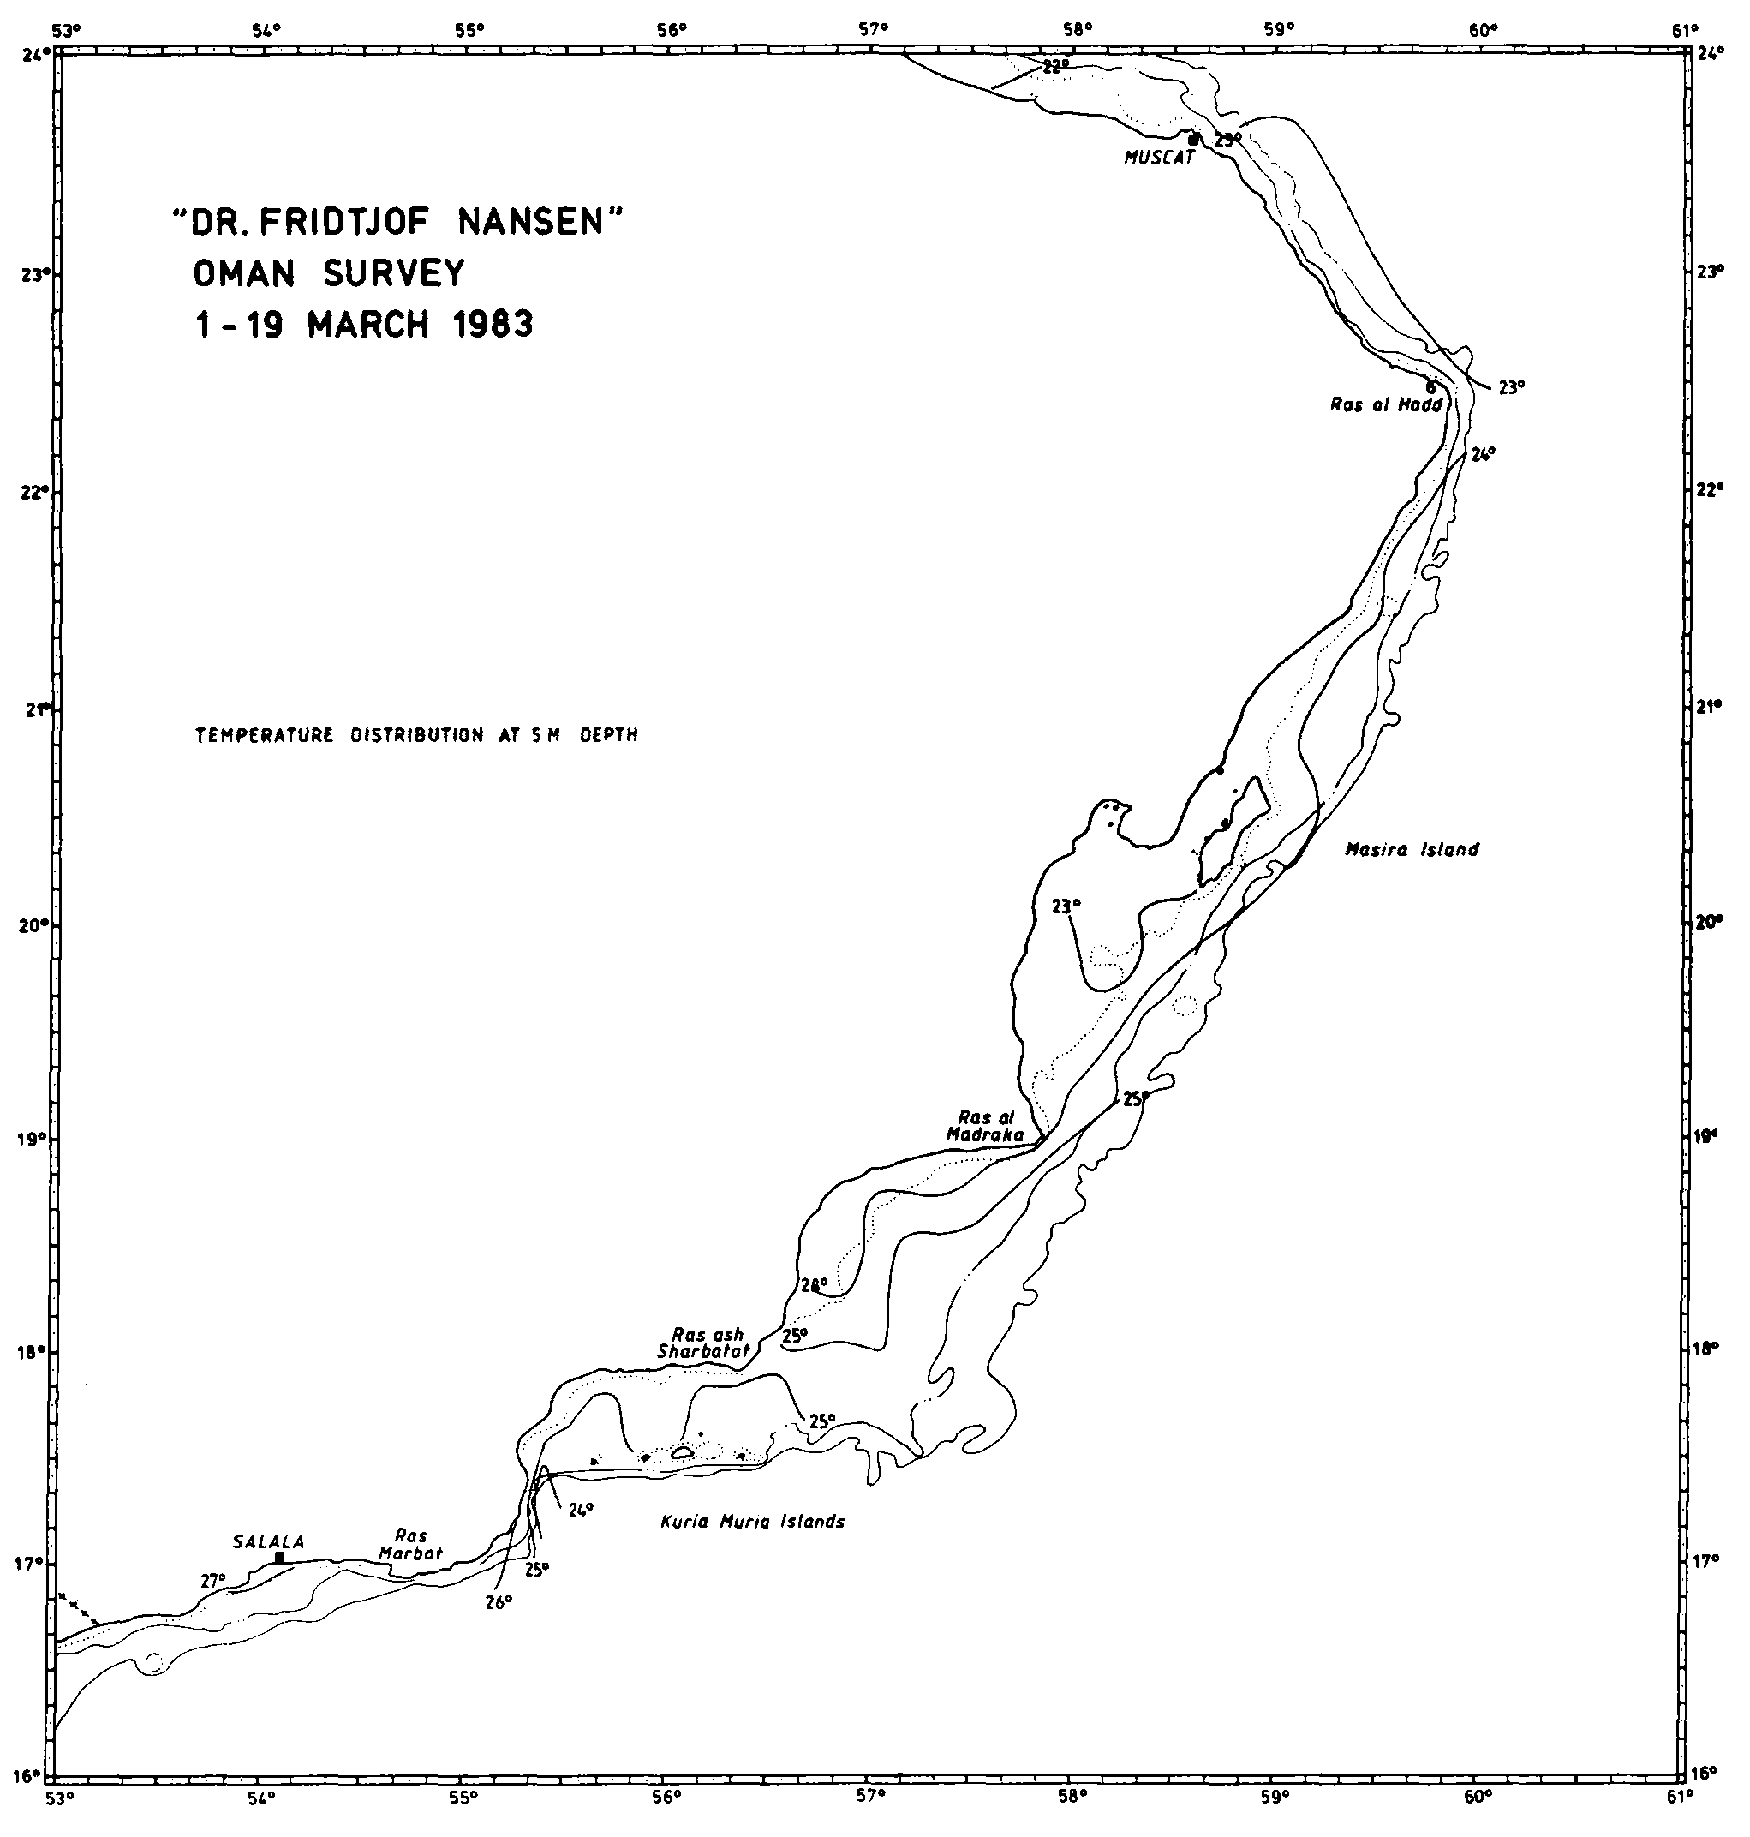
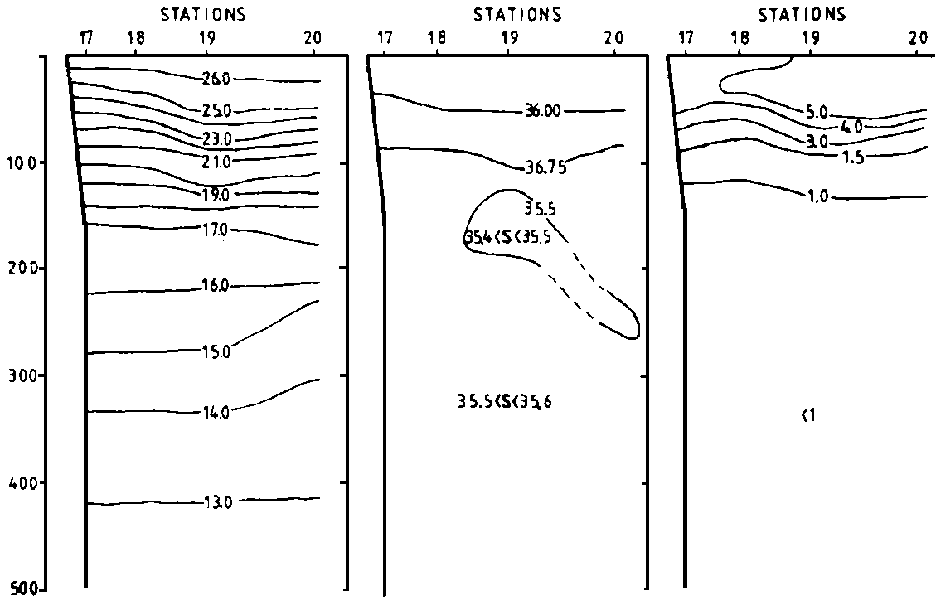
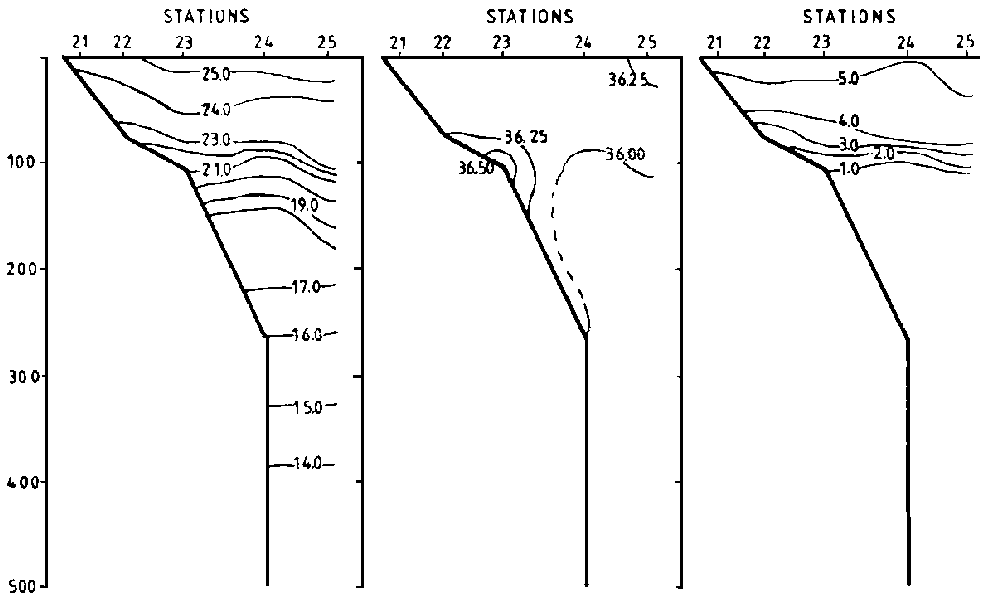
The sea surface temperature was continuously recorded by a thermograph, and the temperatures recorded along the coast are shown in Figure 2. An outstanding feature in the figure are the slightly lower temperatures in the nearshore waters from Sauqara Bay and northwards. From this an upwelling situation is suggested to be in an initial phase. Hydrographical section III (Figure 3) also gives a verification of this phenomenon.
Figure 2. Temperature °C in surface layer.
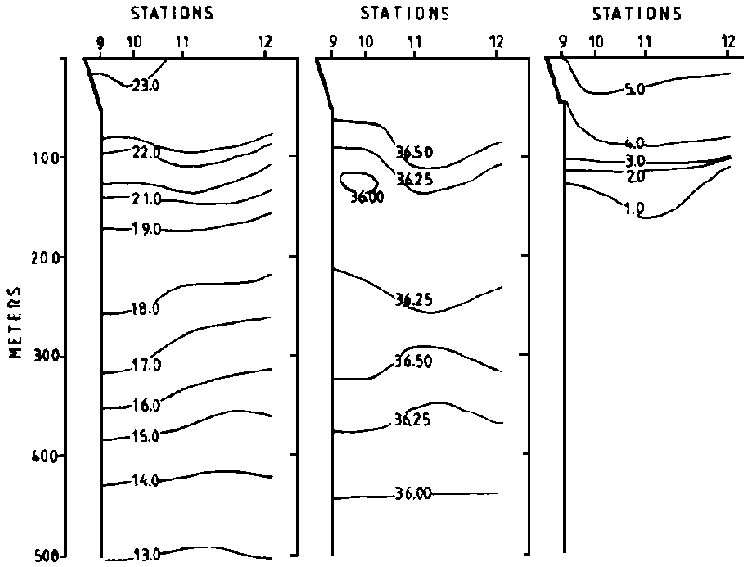
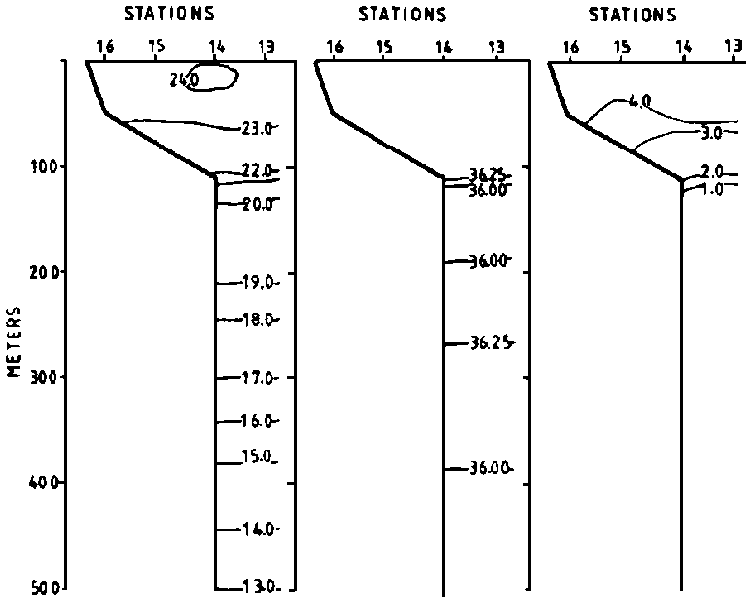
In the four hydrographical sections (Figure 3) the upper 100 meters consist of rather uniform water masses.
The thermocline was observed between 100 and 150 metres. The salinity down to 500 meter depth was within the range of 35.25 % to 36.5 %.
The 1 ml/L oxygen limit is located at about 100 m depth and forms an effective barrier for the common species to move below.
Figure 3. The hydrographical sections.
![]()
![]()
![]()