![]()
![]()
![]()
The cruise was originally planned in two legs, the first covering the coast of Togo, Benin, Nigeria, Cameroon and Fernando Poo and the latter the coast of Equatorial Guinea, Gabon, Congo and the islands Pagalu, Sao Tome and Principe. According to a plan agreed on at the CECAF meeting in Casablanca, February 1981, the first part focused on the sub-surface community in the depth zone 50-200 m, the second part had the broader aim of covering the whole shelf area both for pelagic and demersal resources. Due to a breakdown of a generator on R/V "Dr. Fridtjof Nansen" the survey time was shortened by over a week. In order to cover the whole area in the designated time, the survey intensity was less than originally planned.
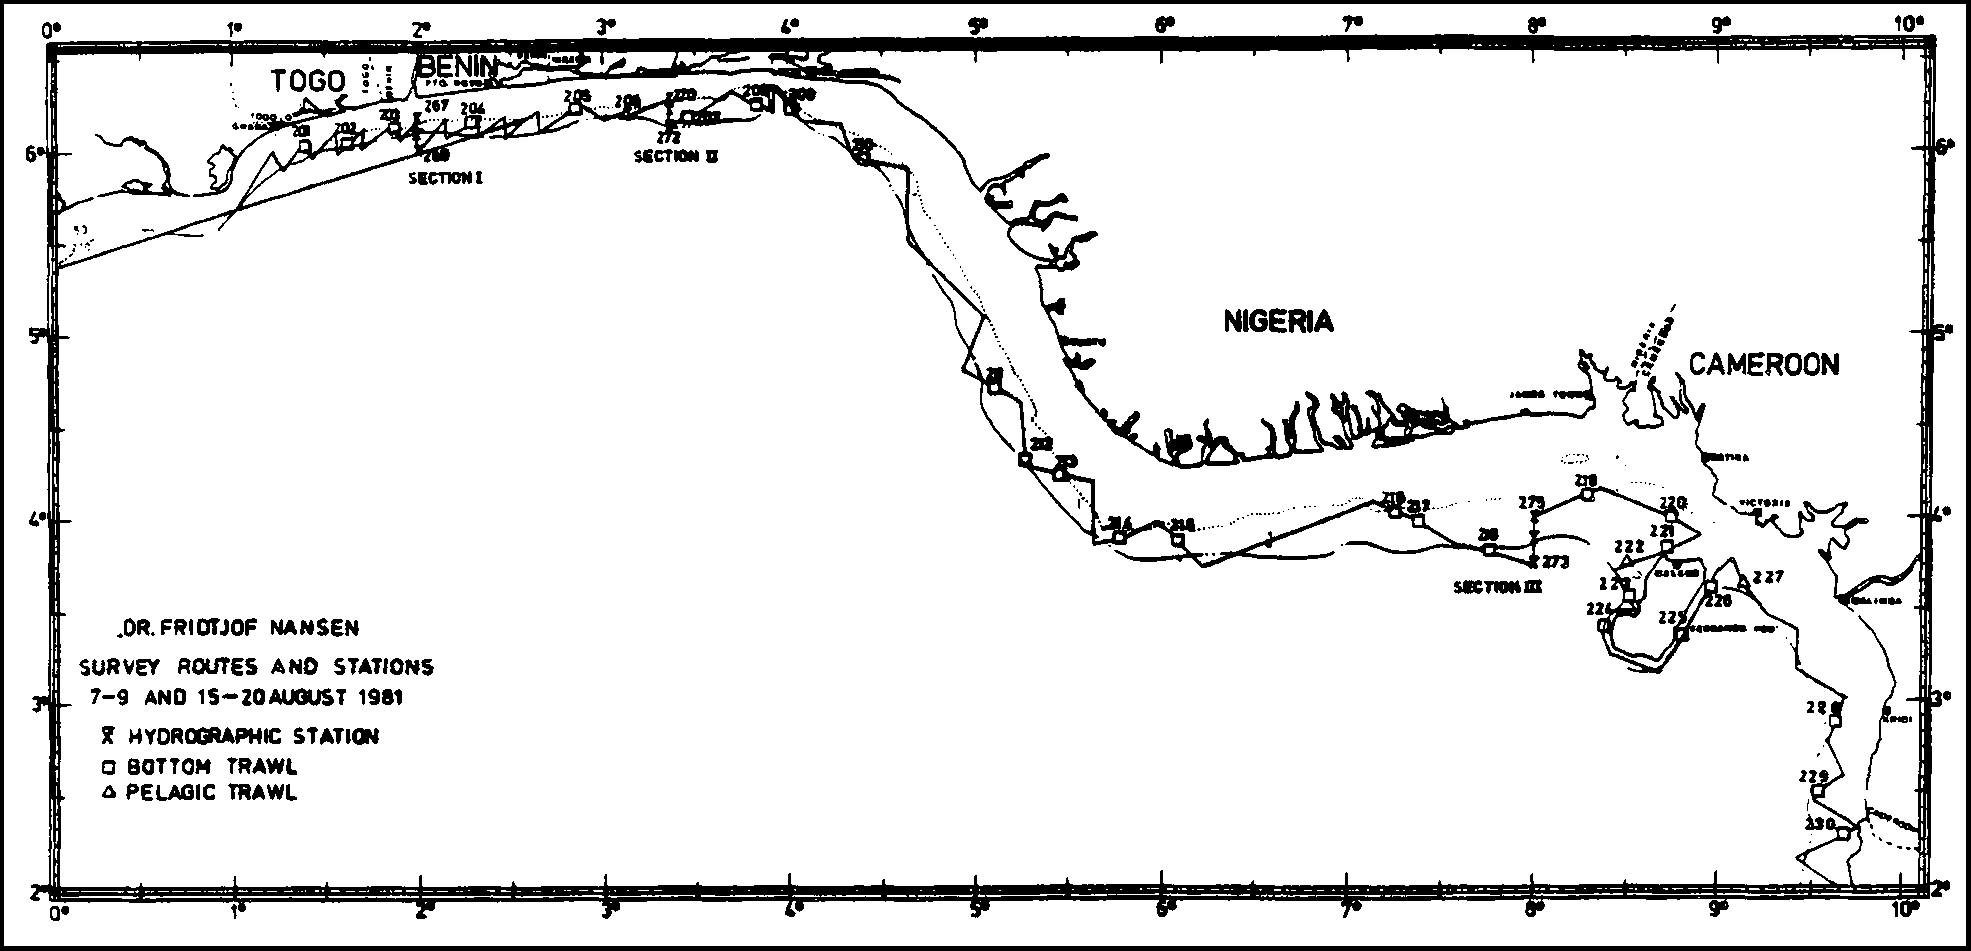
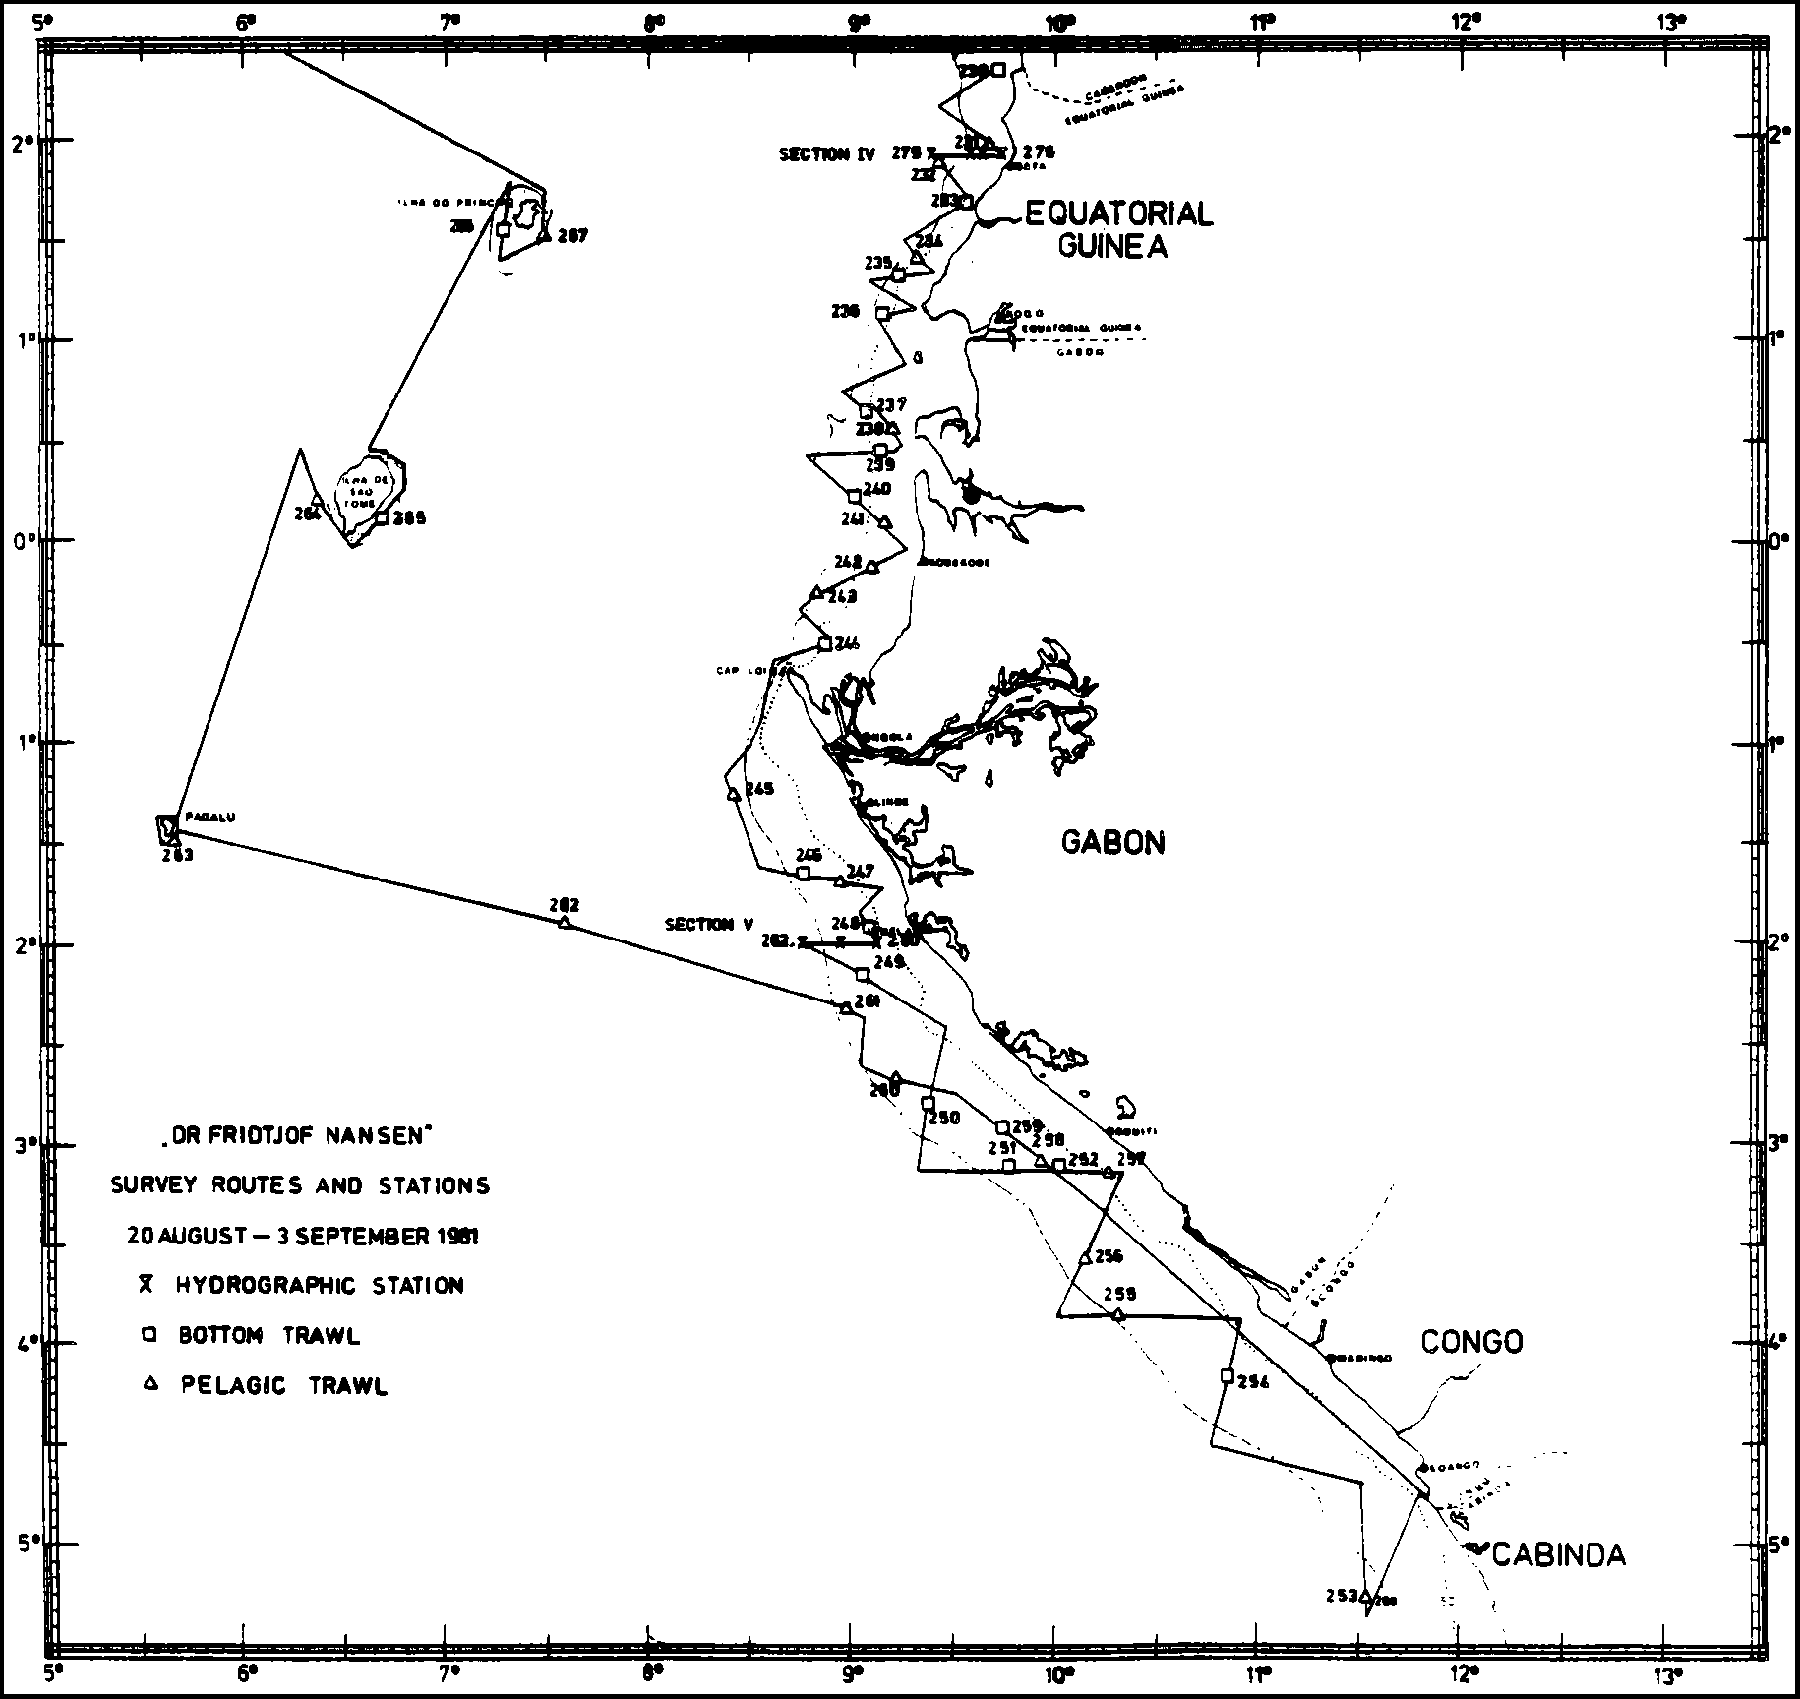
Figs. 1 and 2 show the survey routes, hydrographical stations and fishing stations. Five hydrographical cross-sections were worked during the cruise, totalling 16 hydrographical stations. 43 bottom trawl stations and 23 pelagic trawl stations were worked.
Fig. 1. Cruise track and stations 7-20 Aug. 1981.
Fig. 2. Cruise track and stations 20 Aug. - 3 Sept. 1981.
Description of the surveyed area
The shelf area off Togo, Benin and the western part of Nigeria is narrow with a very steep slope and a rocky edge. Although the shelf broadens eastward off Nigeria and Cameroon the area with depths between 50 and 200 m is still small, while the shallower parts not covered in the survey are extensive. The shelf off Equatorial Guinea and the northern part of Gabon is again narrow, while south of Cape Lopez off southern Gabon and off the Congo the shelf broadens. Typical for the whole area is the very steep rocky slope of the shelf.
The bottom conditions for trawling are difficult in parts of the shelf off Equatorial Guinea, Gabon and Congo. Even smooth bottom which after normal judgement of the echo-recordings should have been quite suitable for trawling turned out to contain physical obstacles to safe trawling-operations. Off Gabon and Congo there is a considerable oil exploration, and there are reasons to believe that some of our problems were caused by debris from the off-shore oil activities.
The shelf areas around the islands of Pagalu, Sao Tome, Principe and Fernando Poo are narrow and rocky, with steep slopes. Only on the south-western side of Principe and on the north-eastern side of Fernando Poo is there any shelf areas of importance.
Estimates have been made of the area covered by the investigations. These are based on the distribution of the survey grids shown in Fig. 1-2. Table 1 shows these estimates. Since the main fish distribution is limited to the shelf area, the parts of the shelf which were covered by the survey have also been calculated. The outer regions of the shelf (to the defined limit of 200 m depth) have generally been fully covered in the whole region, but the inshore shallow parts could often not be covered because of a depth limit of about 10 m for the safe operation of the vessel. Estimates have been made of the extent of the shallow inshore shelf which has been left uncovered in Gabon and Congo. The estimates of the total fish biomass will be adjusted for these areas which had to be left out of the surveys. In Table 1 are also shown values on survey intensity, given as ratios between nautical miles steamed and 100 nautical miles2 covered for the various countries. The average for the survey is 9.6 nm/100 nm2 which is considerable less than in surveys from the northern CECAF region (17-19 nm/100 nm2 , STRØMME et al. 1982). The reason is the lack of time caused by the breakdown of the generator.
Table 1. Main features on survey coverage.
|
Area |
Shelf area 0 - 200 m nm2 |
Area covered (nm2) |
Shelf area covered (nm2) |
Shallow shelf area not covered
(nm2) |
Nautical miles steamed |
Survey intensity-nm/100 nm2 |
|
Togo-Benin |
1430 |
825 |
825 |
605 |
70 |
8.5 |
|
Nigeria |
11470 |
4930 |
4930 |
6540 |
690 |
14.0 |
|
Cameroon & Fernando Poo |
4880 |
2115 |
2115 |
2415 |
335 |
15.8 |
|
Equatorial Guinea |
1260 |
1510 |
1210 |
50 |
170 |
11.3 |
|
Gabon |
11570 |
12775 |
9660 |
1910 |
910 |
7.1 |
|
Congo |
2060 |
2565 |
1660 |
400 |
200 |
7.8 |
|
Total Togo-Congo |
32670 |
24720 |
20400 |
11920 |
2375 |
9.6 |
![]()
![]()
![]()