![]()
![]()
![]()
MAURO GHIROTTI
Central Technical Unit, Directorate General for Cooperation and Development, Ministry of Foreign Affairs, via S. Contarini 25,00194 Rome - Italy
Introduction
Land degradation in the tropics is strongly associated with human population growth. The latter phenomenon is quite marked in humid areas and in the temperate highlands (Jahnke 1982). Notably in the plateaux of Sub-Saharan Africa and Asia, several pastoral systems have gradually evolved into mixed farming, in order to cope with such pressure (Ruthenberg, 1980). Land is more intensively utilized as population density increases since mixed systems are more efficient than specialized crop or livestock systems (McIntire et al.,1992). In fact, livestock crop integration allows:
Livestock provide not only draught power, manure, milk, meat and by-products. As in traditional pastoral societies, they have cash buffer and insurance functions. The former function also supports the use of inputs in crop cultivation which in turn generates higher on-farm productivity for both crops and livestock (Brumby, 1986).
On the other hand, human population growth is responsible for decreasing land plot size. In Rwanda and Burundi, this pressure led to stocking rates much lower than in other East African highlands (50 TLU/km2 vs. 100–130 TLU/km2, according to the zone) due to increasing conversion of pasture into cultivated land (de Leeuw and Reid, 1995). In these areas, the doubling time of human population is around 20 years. In Sidama, Southern Ethiopia, a similar pattern was already described in 1975 by Ayele who stated that “cultivation has been and is invading livestock grazing areas. As population increases, people prefer to cultivate crops rather than breed livestock”.
The progressive disappearance of livestock is a key destabilizing factor responsible for the involution of the system characterized by nutrients deficiencies and degradation. It may lead to conflicts between different groups sharing resources within the system. This trend is more evident in the absence of marketing opportunities for livestock and/or crop products (Ruthenberg, 1980; Steinfeld et al., 1997).
In Sidama Awraja (or district) a WHO/UNICEF Joint Nutritional Support Programme (JNSP) was implemented during the second half of the 1980's. The area was selected because it presented a variety of environmental, socio-economic and cultural situations. This study, carried out as part of the programme activities, illustrates the role played by livestock in alleviating land degradation, poverty and the resulting child malnutrition in integrated systems.
The Sidama Awraja
Located in the northern part of Sidama Province, the Sidama Awraja occupies some 5900 km2, with a human population of 1.5 million. The Awraja is one of the most densely inhabited areas of Ethiopia, with 254 people/km2, in contrast to the national average of 32 people/km2.
The region is divided into three main ecozones, each with different agricultural systems and development potential, (Figure 1). The lowlands are situated in the Rift Valley and range between 1100 m and 1600 m in altitude. Because of poor soil and an average annual rainfall of only 400 mm, the main human activity in this zone is pastoralism. The next belt, the midlands, ranges from 1600 to 2000 m and averages more than 1500 mm of precipitation annually. About 70% of the Awraja's human population is concentrated in this very fertile zone (Raya, 1987). It has sustained rapid population growth because it provides a favourable environment for agriculture and development. The farming system, a combination of horticulture and animal husbandry, is characterized by the cultivation of false banana (Ensete ventricosum), which is the principal staple food, and cash crops. Major cash crops include coffee (Coffea arabica, a wild shrub indigenous to southern Ethiopia) and chat (Catha edulis, whose leaves are chewed as a stimulant). Incomes in the midlands are considerably higher than in the other two zones and in the rest of Ethiopia (Anonymous, 1984). A tarmac road and the majority of the Awraja's dirt roads are found in the midlands, as are the main services and the regional and district capitals. The territory above 2000 m constitutes the highlands, whose potential for cereal production has not yet been fully exploited also because of poor communication networks. At present, abundant pasture allows highland farmers to raise large numbers of livestock, including horses that supply most of the transport in this zone.
The principal ethnic group in this zone is the Sidama, a Cushitic-speaking people. Traditionally cattle raisers, their way of life has changed, especially in the midlands, as cultivation is invading grazing areas. For example, seasonal movements towards neighbouring highlands in search of better pasture are practised no more. Nowadays, they live together with the Oromo pastoralists (the Guji) who used to be their traditional enemies. “Sidama”, which means “foreigner” was the name used by the Oromo during their expansion from the eastern Ethiopian highlands into the Awraja (Biasiutti 1959). Other ethnic groups found in the area are the Wolaita and the Amhara.
The study
JNSP activities were concentrated in the midlands of Sidama. According to the results of a baseline survey carried out by the programme, 36% of children in the Awraja had chronic and 41% acute malnutrition. The problem was surprisingly more severe in the midlands.
A key question still needed an answer: within the same community, which are the most vulnerable HHs and why?
Several studies have clearly pointed out the influence of the socio-economic status, as well of environmental factors, on child malnutrition (Payne, 1977; Nabarro, 1981; Victora et al., 1986). The proportion of malnourished children within a community is a powerful indicator of the level of access to basic resources from vulnerable groups. High prevalences are the symptoms of a system under stress and they are often associated with scarcity, degradation or mismanagement of available resources, including inequity. According to Jonsson (1984) the main underlying causes of the phenomenon are: insufficient HH food security, inadequate child care, and insufficient basic health care.
The present study was carried out in 1988 as part of programme activities in order to:
Materials and methods
The study design hinged upon:
The data were collected mainly through:
Further information about the study area and methodology can be obtained from a previous publication (Ghirotti, 1995).
Risks factors in child malnutrition
Ninety eight HHs, in the selected villages, fulfilled the basic criteria for being involved in a case - control study. All of them having a child below three years of age (13-24 months included) with weight for age above 90% of the median of the Harvard reference population (hence well nourished) or with weight for age below 65% of the median of the Harvard reference population (hence severely malnourished). They were divided in two extreme groups in order to identify main determinants of malnutrition. The study was performed as single blind: information on the nutritional status of the children belonging to the interviewed HH were deliberately obtained only at the end of all the interviews in the concerned PA. The two major working hypotheses were:
At the same time a parallel and integrated investigation analyzed the role of maternal care and mother knowledge/attitude in the same HHs (N. Zagaria, unpublished document).
The income of each HH was estimated by making a calculation of the farm gross output of the year (according to the recorded production parameters), of ownership of goods, livestock and other sources of HH income. Data were computed into a spread-sheet format. Items were converted into monetary figures, i.e. Ethiopian Birr (at the time of the study 1 US$=2.05 E. Birr), according to local market prices.
Income pro capita was calculated by dividing the estimated gross income for the total number of HH members. The coefficient for children below five years was 0. 4, for family members between 5 and 15 years of age was 0. 75 and for members above 15 years was 1.
Efficiency in agricultural production was estimated by dividing the gross income for the size of the land holding (Spedding, 1981). Management was evaluated by comparing the husbandry practices of the two groups (HHs of well-nourished and HHs of malnourished child) to identify differences in their behaviour, if any, associated with production improvement (e. g. ; use of inputs, frequency of weeding and other husbandry practices, level of livestock care, diversification of production strategy, priorities in expenditures).
Data analysis
Data were analysed either comparing means with ANOVA or using chi-squared to test hypotheses. A Mantel - Haenszel stratified analysis was then carried out. The correlation coefficient was calculated to establish eventual relationship between selected variables. P values less than 0. 1 (10%) were considered as statistically significant. A statistical package EPI-INFO was used for the analysis (WHO-CDC, 1990).
Results
The farming system
HH composition and land plot size:
The average HH size is 6.5 persons (S. D. = 2.24). Its composition is given in Figure 2.
Polygamy was found in 19 HHs. Three farms were led by a woman. 95.1% of the farmers
cultivate less than one hectare of land (see table 1). The average land plot is 0. 4 ha. Its size is
not associated with income (P>0. 1). The recorded population density in the area is 525
people/Km2 (see Table 2).
Income: The comparison between the means of the income recorded in HHs of the four villages, showed that the difference is not significant (P>0. 1). It was then assumed that the selected villages are rather homogenous. On-farm activities are the main source of income for 99 HHs (97.1%). Coffee and livestock production largely contribute to family income (over 80%), the former as a source of cash, the latter as an asset. The selling of cash crops (coffee, chat, sugarcane and other fruit) and dairy products provides most of the ready money available, on average 17% of the gross income, to buy farm inputs and to meet other HH expenditures. During the year of the study, 61 (59.8%) farmers worked either for other farmers or for the local producer co-operatives in order to obtain extra cash or, more frequently, food. Income generated from agricultural activities was integrated in 15 HHs (14.7%) with casual labour (e. g., brickwork), in 6 (5.9%) with handicraft production and in 4 HHs (3.9%) with alcohol sale. Income was not associated with the surface of cultivated land nor with the HH size (P>0. 1)
Crop Production: In the midlands, the garden is a combination of different food and cash crop species. The ensete plants form the higher canopy under which humidity is maintained and where coffee, kale (Brassica carinata), yam (Dioscorea abyssinica), sweet potato (Coleus edulis) and other vegetable and fruit trees are planted. The climate, with mild temperatures and water surplus for most of the year, is favourable to crops but also to weed growth. Soil fertility in the garden is kept and even increased by the daily spreading of the manure collected overnight. The floors of traditional housing are constructed in such a way that the urine of livestock kept indoor overnight drains into the garden. However, heaps of unused manure were noticed near some plots as well as land degradation in sloped or grazing areas. Maize is cultivated separately in rows, together with kale, beans and spice plants.
The frequency of the HHs cultivating the most important crops is summarized in table 3. Because of the small size of land plots, the main agricultural tool is a local bamboo hoe. The plough is used only by few farmers who cultivate more than one ha of land.
Ensete plays a central role in the life of Sidama people. It furnishes the main staple food which is potentially available throughout the year, fibre for handicrafts, ropes, leaves for shelter, by-products for animal feed. Preferably when the plant is 6-8 years old, the pseudostem is scraped in order to obtain “bula”, the most valuable food made from the juice, and “wasa”, which is obtained from fermentation of the solid residue and can easily be stored in the ground for over two years. Production per plant is about 30 kg though an eight years old plant can produce up to 40 kg of wasa.
All the farmers interviewed cultivate maize. Teff (Eragrostis teff), wheat and barley are cultivated by a few farmers (in seven, three and two HHs respectively) owning more than 0. 6 ha of land.
Production of coffee, the main cash crop, was not associated with plot size (P>0. 1). Fruits like orange, banana, avocado, guava and papaya have the function of cash crops, diversifying the HH economy and providing some petty cash when other sources are not available, especially for farmers in villages near the major markets and roads.
Because of the low but diversified production through the year, little is stored. Most food is eaten or sold within weeks from harvest, with the exception of was which can be prepared any time during the year.
Only 2.9% of the farmers interviewed use improved maize seeds. Fertilizers, mainly bought from free marketing, are employed by 21.6% of them and their use is associated with high income (P<0. 01). Nineteen (18.6%) farmers obtained information on how to improve their agricultural production, mainly coffee. Figure 3 shows the major constraints in crop production identified by the heads of HH. Among other causes, farmers mentioned the difficulty to obtain loans.
Livestock production: The recorded human/livestock ratios and density, in the study area as well in the whole Sidama and in the rest of Ethiopia, are given in Table 2. In spite of population pressure, livestock density in the area is higher than in the rest of the Awraja and of Ethiopia. On the other hand, the ratio of TLU per HH is lower.
Some 96% of the interviewed heads of HHs own livestock and about 89.2% own cattle (see Table 4). Cattle numbers are a good indicator of wealth, and ownership of more than three heads per HH is associated with an estimated annual income above E. Birr 1,000. In fact, the average herd size in a low income HH is 2.5 cattle, while in a wealthy one it is four cattle (P< 0. 001). The average herd structure is typically milk-calf production oriented (Figure 4). Oxen, as well as equine animals which are used as source of draught power, are owned only by farmers with larger land plots. The recorded production parameters are typical of a rather stable and productive traditional herd (Table 5). Farmers identified the main causes of losses in calves as diarrhoea and emaciation, while in adults poisoning, internal parasitism, clostridiosis and diarrhoea. Offtake comprises essentially sales.
Small ruminants are less diffused than cattle although they are probably more suitable to the local farming conditions (Tables 2 and 4). Animal production in the midlands is indeed milk-oriented and small ruminants cannot fulfil this important demand, especially sheep, because of a well-rooted food taboo. However, once this taboo is neglected, goats are gradually replacing other domestic ruminants. The recorded difference between lambing and kidding rates was significant (P<0. 01). The average flock size is not associated with income or land plot size (P>0. 1). Farmers say that the major causes of death in small ruminants are parasitism and predation. Offtake is in the form of sales. However on special occasions, such as birth of a child, special visits or sickness of a member, small ruminants are slaughtered to be consumed within the HH.
Chicken are bred independently of HH income as well. The mortality rate is quite high (39.2%) and affects mostly chicks. The major causes of death are predation by hawks (86.3%), diseases (12.1%) and accidents (1.6%). The recorded offtake was 22.7%. 3/4 of it was due to consumption by the members of the family.
Each beehive produces 3-3.5kg of honey which is used to produce local hydromel: “teij”. Fifty-nine percent of the cattle owners, regardless of their income, vaccinated their animals against major infectious diseases. In 44% of the herds there was a need for veterinary assistance during the year which, for the great majority, concerned cattle. Only two farmers obtained information on how to improve their livestock production. Of the 40 farmers who needed veterinary care during the reference year, 24 (60%) used traditional medicine, 10 (25%) modern medicine and 6 (15%) both. The choice was not associated with HH income level (P>0. 1). The major constraints in animal husbandry identified by farmers are given in Figure 5. Grazing areas are often limited to open meadow in front of the house and to scarce fallow land. By-products, mainly ensete leaves and maize stover, are given as feed to livestock in the dry season. However, according to farmers, an abundant diet of ensete leaves can cause severe enteritis, notably in young animals. Local coarse grass (Pennisetum scimperi), commonly found in common pastures and rich in silicates, is possibly responsible for early consumption of teeth in livestock.
Market prices: Seasonal dynamics of the price of common agricultural products are given in figures 6 and 7. Prices are higher in villages near the main tarmac road and the Awraja capital, Yerg' Alem (i.e., Weinenata and Ferro).
Food habits: Vegetable products are gradually replacing food of animal origin as maize is gradually replacing wasa in the diet. In families owning cattle, wasa is eaten with milk or butter. The latter food is considered as being very nutritive and used by well off families for weaning their children. Vegetables and fruit, on the other hand, are considered as being of little nutritive value. 45% of the farmers interviewed believe that good nutrition is based on food of animal origin and 28.4% believe that malnutrition is caused by the absence in the diets of such food. These beliefs are probably linked to the traditional pastoral life-style of local ethnic groups. However, 63.7% of the heads of HHs are aware that an unvaried diet is an important cause of malnutrition.
Expenditures: The main expenditures in the HH throughout the year are, in order of priority: food (82.1%), clothes (14.7%), taxes and contributions (2.9%). Priority in expenditure items is not related to the HH income (P>0. 1).
Risk factors in child malnutrition
As shown in Table 7 child malnutrition is strongly associated with an estimated income of less than 1100 E. Birr (P<0. 001). The mean gross income in HHs with a well nourished child is E. Birr 1471 (C. L. 92.9) while in the other group this is E. Birr 893 (C. L. 71.3). This difference is significant (P<0. 001). Income pro capita was not associated with malnutrition (P>0. 1). Moreover, the average size of HHs with a malnourished child was 6.8, while for HHs with well-nourished children it was 6.2. This difference was not significant (P>0. 1). Therefore, larger families are not more vulnerable.
Cattle ownership is a good indicator of wealth and a predictor of the child nutritional status (P<0. 01). Ownership of more that three cattle is associated with high income levels and good nutritional status of the child (respectively P<0. 001 and P<0. 005), see table 8. There is no confounding effect between the two factors. The correlation coefficient between income and herd size is 0. 73.
The association between different house conditions and levels of income, and between house conditions (hence of a income proxy) and malnutrition were both highly significant (P< 0. 001), see table 9. Bed or radio ownership are poor wealth or malnutrition indicators (P<0. 01), may be because of the small sample size.
The combination of number of cattle owned and house condition is an excellent predictor of nutritional risk, with an odd ratio of 15.5.
Malnutrition was not associated with number of wives nor with land plot size (P>0. 1). On the other hand, it was related to lower levels of efficiency in land utilization (Table 10).
No significant difference in agricultural practices or in awareness of nutritional problems was observed between the two groups of HHs.
At the time of the interviews, the gardens belonging to low income farmers presented most of the maize already harvested, hence before its optimal maturation. Ensete plants older than five years were also more frequently found in the garden of wealthy HHs.
Conclusions
Caution is needed while interpreting data obtained from official statistics or questionnaires (see for example, Chambers, 1983 and Gill, 1993). Bearing this in mind, the study, of which the results are consistent with the demographic and productive patterns recorded by broader surveys carried out by the Ministry of Agriculture (1984) and by JNSP, points out that:
A major conclusion of this study is that livestock play a protective role against land degradation and poverty. Such role against poverty and hence child malnutrition is associated with the possibility to diversify HH production and diet. There is no major difference in the skill and knowledge of members from low or high income HH. The main difference lies in the possibility to modulate their production and marketing strategies. High income farmers have a good area of manoeuvre within which they can adapt their decisions according to rapidly changing conditions. On the contrary, in order to cope with their immediate survival needs, low income farmers have to sell products soon after harvest, when prices are low, or consume them before they become ripe and reply on traditionally standardized husbandry techniques developed when pressure on local natural resources was less intense. The latter HHs have limited choices that are reduced every year or in every round of the “spiral of necessity” shown in Figure 8.
Acknowledgements
This paper is dedicated to the Ethiopian field workers, an example of devotion in performing their tasks, and to the memory of: Reginald Bark Griffiths (1920 – 1997), John William Coltrane (1926 – 1967), and Sophie Ali (1954 – 1990).
The study was performed within the field work programme of the “International Course for Primary Health Care Managers at District Level in Developing Country” (Istituto Superiore di Sanità, Rome), supported by the Italian Technical Cooperation. The author is very grateful to: R. Guerra, course supervisor; E. Tekle, Ethiopian Nutritional Institute, and the staff of the UNICEF/WHO Joint Nutritional Support Programme, Sidama; S. Sanford, ILCA; D. Nabarro; S. Babsa, typist; G. Beccaloni, FAO documentarist; and Zebenay I., interpreter.
References
Ayele G. M. (1975) The Forgotten Aborigines Livestock and Meat Board, Addis Ababa.
Biasiutti R. (1959) Razze e Popoli della Terra, III vol., UTET, Torino.
Brumby P. J. (1986) The International Livestock Centre for Africa: objectives, activities and future International Livestock Centre for Africa, Addis Ababa.
Chambers R. (1983) Rural Development: Putting the Last First. Longman, London.
Conway G. R. (1985) Rapid Rural Appraisal for Agroecosystem Analysis. Aga Khan Foundation (UK), London.
de Leeuw P. N. and Reid R. (1995) Impact of human activities and livestock on the African environment: an attempt to partition the pressure. In: Proceedings of the Joint FAO/ILRI Roundtable on Livestock Development Strategies for Low Income Countries, Addis Ababa, 27 February-2 March 1995, 29–39.
English J. , Tiffen M. and Mortimore M (1993) Land Resource Management in the Machakos District, Kenya 1930–1990. World Bank Environment Paper n. 5. World Bank, Washington D. C. .
Ghirotti M. (1992) Rapid Rural Appraisal Techniques: a tool for planning and managing animal health and production development programmes. In: Proceedings of the Conference of the Society for Veterinary Epidemiology and Preventive Medicine, Edinburgh: 1–3 April 1992, 190–206.
Ghirotti M. (1995) Farming practices and patterns in coffee-growing midlands of Sidama - Ethiopia Riv. Agr. Subtrop. e Trop., 89, 5–28.
Gill G. J. (1993) O.K., the Data's Lousy, but It's All We've Got (Being a Critique of Conventional Methods). Gatekeeper series n. 38. International Institute for Environment and Development, London.
Hamer J. H. (1987) Humane Development-Participation and change among the Sadama of Ethiopia The University of Alabama Press, Tuscaloosa.
Hurni H. (1988) Ecological issues in the creation of famine in Ethiopia, Paper presented at the National Conference on Disaster Prevention and Preparedness Strategy for Ethiopia, Addis Ababa, 5–8 December 1988.
Jahnke H. E. (1982) Livestock Production Systems and Livestock Development in Tropical Africa. Kieler Wissenschaftsverlag, Kiel.
Jonsson O. (1984) Child Survival and Development, a Proposed Conceptual Approach. In: the Programming Workshop for the preparation of the next UNICEF Board Recommendations. Dar es Salaam, 11–15 June 1984.
McEntire J., Bouzat D. and Pingali P. (1992) “Crop- livestock interaction in sub-Saharan Africa” The World Bank, Washington D. C.
Ministry of Agriculture (1984) “General Agriculture Survey, Preliminary Report, 1983/84” Planning and Programming Dpt., Addis Ababa.
Nabarro D. (1981) “Social, economic, health and environmental determinants of nutritional status” Food. nutr. Bull., 6, 38–47.
Payne P. R. (1977) “Socioeconomic cause of malnutrition”. In: Nutrition in Developing Countries, ed. by Korte R., GTZ, Eschborn, 93–114.
Raya A. (1987) “Report of the Diagnostic Survey of Sidama Farming Systems Zone”, Institute of Agriculture Research, Awasa, Ethiopia.
Ruthenberg H. (1980) “Farming Systems in the Tropics” Clarendon Press, Oxford.
Spedding C. W. R. (1981) “An Introduction to Agricultural Systems” Applied Science Pub., London.
Steinfeld H., de Haan C. and Blackburn H. (1997) “Livestock - Environment Interactions: Issues and Options”.
Victora C. G., Vaughan J. P., Kirkwood B. R., Martines J. C. and Barcelos L. B. (1986) “Risk factors for malnutrition in Brazilian children: the role of social and environmental variables”, WHO Bull., 64, 299–309.
Von Braun J., de Haen H. and Blanken J. (1991) “Commercialization of Agriculture under Population Pressure: Effects on Production, Consumption and Nutrition in Rwanda”. Research Report n. 85. International Food Policy Research Institute, Washington D. C. .
Westphal E. (1975) “Agricultural Systems in Ethiopia”, PUDOC, Wageningen.
Table 1: Land holding frequency per household in Sidama midlands (n=102)
| cultivated land (hectare) | frequency |
|---|---|
| <0. 5 | 81 |
| 0. 5–1 | 17 |
| >1 | 2 |
Table 2: Human and livestock population densities in Ethiopia, Sidama and sampled Midlands (Sources: UN, JNSP and study data)
| Ethiopia | Sidama | Midlands | |
|---|---|---|---|
| Population/Km2 | 32.7 | 254.2 | 525* |
| cattle/people | 0. 65 | 0. 65 | 0. 48 |
| small rumin. /people | 1 | 0. 14 | 0. 11 |
| equines/people | 0. 18 | 0. 04 | 0. 02 |
| TLU/HH** | 4.15 | 2.99 | 2.17 |
| cattle/Km2 | 21.3 | 165.8 | 252.6 |
| small rumin. /Km2 | 32.7 | 34.6 | 55.4 |
| equines/ Km2 | 5.7 | 9.1 | 8.7 |
| TLU/Km2 | 22.6 | 126.6 | 190. 1 |
* estimate which includes the population of main urban centres
Table 3: frequency of households cultivating major crops (n = 102)
| crops | no of HHs | crops | no. of HHs |
|---|---|---|---|
| ensete | 102 | banana | 69 |
| maize | 102 | sugarcane | 67 |
| coffee | 100 | chat | 65 |
| kale | 95 | red pepper | 65 |
| pumpkin | 88 | sweet potatoes | 47 |
| yam | 79 | avocado | 38 |
| orange | 73 | guava | 11 |
Table 4: number of households breeding livestock (n = 102)
| species | no of HHs | total number in the sample |
|---|---|---|
| cattle | 91 | 319 |
| goats | 18 | 42 |
| sheep | 17 | 28 |
| donkeys | 10 | 10 |
| horses | 1 | 1 |
| chicken | 62 | 214 |
| beehives | 14 | 43 |
| no livestock | 4 | --- |
Table 5: Production rates recorded in cattle of Sidama Midlands (n = 369)
| Calving % | Mortality % | Off take % | |
|---|---|---|---|
| calf | adult | ||
| 61.5 | 24.2 | 2.8 | 6.2 |
Table 6: Production rates in small ruminants of Sidama Midlands (n = 33 + 57)
| Birth | Mortality | Off take | |
|---|---|---|---|
| sheep | 58.8* | 0 | 12 |
| goats | 95.4* | 3.3 | 9.6 |
Table 7: Child nutritional status and estimated household income
| Estimated household income | ||
|---|---|---|
| <1,100 E. birr | >1,100 E. birr | |
| Well nourished | 17 | 40 |
| Malnourished | 32 | 9 |
P < 0. 001 O. R. =8.37 C. L. =95%
Table 8: Child nutritional status and number of owned cattle (n = 98)
| Owned cattle | ||
|---|---|---|
| 0–3 | >3 | |
| Well nourished | 27 | 30 |
| Malnourished | 31 | 10 |
P < 0. 05 O. R. =3.44 C. L. =95%
Table 9: Child nutritional status and productivity per hectare (n = 98)
| E. Birr/0. 1 hectare | |
|---|---|
| Well nourished | 51.63(+3.9) |
| Malnourished | 27.63(+2) |
P<0. 001 C. L. =95%
Table 10: House condition and children nutritional status (n = 98)
| house condition | |||
|---|---|---|---|
| poor | average | good | |
| well nourished children | 4 | 15 | 38 |
| malnourished children | 22 | 8 | 11 |
P<0. 001 O. R = 15.34 95% C. L.
Figure 1: Map of Sidama (*=sampled village)
Figure 2: Household age-sex distribution
% of the different age-sex group in the interviewed households, average value
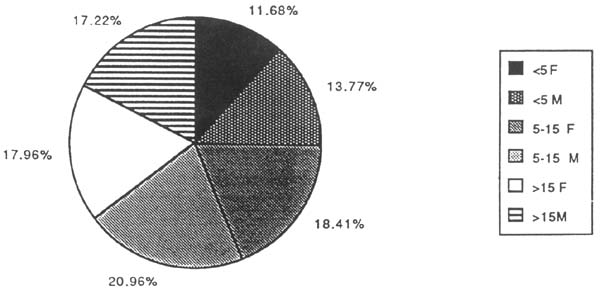
Figure 3: Main problems in crop production
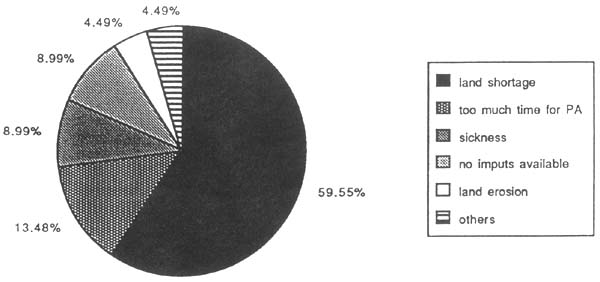
Figure 4: Average herd composition

Figure 5: Main problems in livestock production
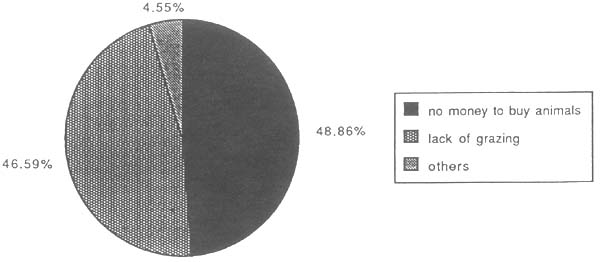
Figure 6: Monthly variation of the price for one horse load of ensete

Figure 7: Monthly variation of the price for one qt of coffee or barley in Aleto Wondo
Figure 8: The spiral of necessity
PETER ORAM
Research Fellow Emeritus, IFPRI, Washington D. C., USA
Abstract
The paper reviews the dynamics of change in the WANA region over the last forty years, with a particular focus on their impact on agricultural policy, the livestock sector, and the environment in the Mashreq and Maghreb (M&M) countries of the region, for which recent information is available from an ongoing project.
This project, which is supported by the International Fund for Agricultural Development (IFAD) and the Arab Fund for Economic and Social Development (AFESD), involves two international research centers - the International Food Policy Research Institute (IFPRI) and the International Center for Agricultural Research in the Dry Areas (ICARDA), in close collaboration with national biological and social scientists from those eight countries. 1 Its principal goal is to find ways of reconciling growth, poverty alleviation, and sustainable natural resource management in the low rainfall farming areas of those countries with mean annual precipitation (MAP) below 400 mm, the steppe rangelands with MAP below 200 mm, and the upland watersheds.
These zones which cover a huge area, including a significant share of the arable land, and virtually all of the natural grazings in those countries (Table 1), are at high risk from climatic hazards, and represent the main locus of rural poverty. Livestock, particularly small ruminants, have a pivotal social and economic role in land use, farming systems, and employment there, and are the mainstay of family income and savings from agriculture. Livestock also contribute significantly to the national economies, representing between 30 percent and 35 percent of agricultural GDP in the eight countries.
Nevertheless, their governments, faced with large food and feed imports to meet the needs of rapidly growing populations, have given priority in research and investment policies to the higher rainfall areas, and particularly to the expansion of irrigation. Support to agriculture in the low rainfall areas has been mainly aimed at mitigating the impact on the ruminant livestock sector of the frequent droughts which are endemic to the dominant semi-arid winter rainfall Mediterranean climate there.
These drought relief policies, which have been largely of an ad hoc reactive nature, have created social and economic dependencies among people in the low rainfall areas; which are proving financially costly to governments, and difficult to escape from. Together with broader sector and national policies, they have encouraged escalation of animal numbers and had perverse effects on the natural environment. This paper reviews the factors which have created this situation, and suggests measures to restore sustainable management of livestock based farming systems in these low rainfall environments, while alleviating poverty.
Demographic change and income growth in WANA over the last fifty years, and their influence on the livestock sector
Since the end of the second world war there have been sweeping social and economic changes in the WANA countries including:
a demographic explosion: population in some countries has grown at around 3 percent annually, and for the M&M regions as a whole it has increased two and a half times between 1960 and 1995, from 44 million to 112 million (Table 2).
rapid urbanization, and migration of rural population to the cities or to work in other countries, especially from the impoverished low rainfall areas. Recent farm surveys in these areas of Morocco and Tunisia2 indicate that out-migration is a very important source of family income, particularly for small farms, with up to fifty percent of male household members, including heads of households, being absent part of each year in urban employment in-country or out-migration to work in other countries. The agricultural population in those countries had declined dramatically in proportion to the total population over the three and a half decades; from 58.5 percent of the total in 1960 to only 24.9 percent in 1995, nevertheless in absolute numbers it has not fallen, being actually 2 million higher overall in 1995 than in 1960. The future implications of these trends for land use, farm and flock size, the labor force, and income distribution from agriculture in the low rainfall areas merit careful study.
rising incomes in most countries, both as a result of expanding exploitation of oil and mineral resources, and other factors, including irrigation development, construction, industrialization and tourism, but with significant pockets of poverty remaining, particularly in the low rainfall areas. (World Bank 1992).
These factors influence livestock and the environment in several ways.
population growth alone raises demand for staple foods and livestock products, but particularly for cereal grains. In an agricultural land-tight environment such as prevails in the M&M countries, cereal production for human consumption competes for existing arable land with production for animal feed; or, it may encroach on land previously used for grazing. In most WANA countries no scope remains for expansion of cultivation in the higher rainfall regions and the irrigation potential is almost exhausted. The low rainfall areas are virtually the last frontier.
income growth shifts the emphasis of demand for food from diets mainly based on starchy products--especially cereals in the Mediterranean environment, towards income elastic commodities, i.e., vegetables, fruits, oilseeds, meat, and dairy products, with rising demand for animal feed. The latter mainly affects the lower rainfall areas, where cereals dominate land use; for example, aggregate barley area in the M&M countries has expanded by 3.66 million hectares (79 percent) between 1969–71 and 1989-91, principally for feed; whereas the area of wheat, the main food grain, has stagnated (Table 3). However, yields of wheat, which is grown principally in more favorable environments, have risen by 53.0 percent due to technological change; whereas those of barley--the key crop of the low rainfall areas have fallen by 12 percent. This reflects the limited adoption of yield increasing technology by farmers in these risky drought-prone areas, which is an important contributory factor to environmental degradation.
urbanization tends to raise demand for processed foods and foods of convenience. When accompanied by income growth it also provides access to a more diverse diet, because of the broader range of choice available in a market-oriented environment.
Tunisia: Small Farmers, Potential and Prospects. The World Bank, March 1991
All of the above forces are at work in the M&M countries, as a result of which demand now exceeds domestic production capacity for several important commodities, especially cereals, meat, and milk, generating rising imports to offset declining self-sufficiency per capita. (Tables 4 and 5). Barley imports in 1992-94 were almost double those a decade earlier. Imports of ruminant meat and live animals cost almost 900 million US dollars in 1982-84, a period of severe drought in several countries; for 1992-94, when climatic conditions were more favorable, this fell to 462 million US dollars. Recent projections for WANA as a whole indicate that the region will be the world's largest cereal importer by 2020, with feed grains representing 28 percent of the total requirement; while sheep and goat meat deficits would rise from 0. 34 million m. t. in 1993 to between 0. 67 and 0. 69 million m. t. in 2020. (Rosegrant et al. 1995).
Despite large increases in domestic sheep and goat numbers in several M&M countries with sheep populations increasing by about 26 million (64%) between 1961 and 1991, (Table 5) and rising feed imports, per capita consumption of red meat has gone down, reflecting the inability of the small ruminant sector to meet current demand generated by population and income growth. Had it not been for the rapid expansion of the domestic poultry industry in these countries in the last fifteen years, imports of red meat would have been considerably larger or rising domestic prices would have restrained demand. Despite these developments, levels of dietary animal protein in all WANA countries are still well below the 33 percent considered nutritionally desirable. (Economides 1995).
Closing this dietary gap while maintaining calorie intakes at their present high per capita levels of around 3,000 kcal/day, in the face of a projected population growth to 180 million by 2020 and without degrading the environment, presents a tremendous challenge to governments.
Government interventions to achieve food security and their impact on livestock and the environment
Macroeconomic and sectoral policies
To meet this challenge, and to maintain social stability, government policies in the M&M countries have emphasized import substitution for key food commodities, and have adopted a range of input and output subsidy, exchange rate, tariff protection, price control, credit, and other incentive measures to stimulate domestic food production, as well as investing heavily in irrigation and in research in the higher rainfall areas to intensify and diversify production and increase employment opportunities through value added agriculture-based industries. Until recently most governments also intervened massively to control purchase, marketing, and processing of strategic commodities and of farm inputs, as well as supporting consumers through pricing policies.
Although these sectoral policies were directed primarily to increasing productivity of crops in the higher potential regions rather than in the low rainfall areas, where both the scope for diversification of crop production and the use of yield increasing technology are limited by aridity and high risks of drought, they have, nevertheless, had a negative impact on the environment in those areas in several ways.
by subsidizing cereal prices without targeting them to specific ecoregions, governments have encouraged farmers to expand their production into areas which are marginal for cultivation, including sloping lands in upland watersheds without any soil conservation measures, and steppe range lands down to 150 mm MAP. Once these areas have been invaded by mechanized cultivation it is difficult to turn the clock back, both for social reasons, and because the natural vegetation has been degraded or destroyed. 3
by facilitating the purchase of farm machinery, trucks, and water tankers through cheap fuel, subsidized imports, tax relief, and credit policies governments have made it easier to cultivate marginal lands in low rainfall areas for barley production, whether for sale or, more commonly, for in-situ livestock feed. This has also enabled flocks to access areas of rangelands for extended periods of the year, which until recently, they could only remain on for limited periods; or, because lack of user rights, not at all. 4 5 Damage to vegetation from overgrazing, vehicular compaction, trampling, and fuelwood collection is widely reported.
by nationalizing rangelands, undermining tribal authority, and enforced settlement of nomadic people, without substituting alternative effective systems of management, and establishing clear property rights (whether communal or private), some governments have opened the door to the abusive uses of the resource described above. The land belongs to everyone and to no one! For example, where security of tenure is lacking, individuals may cultivate barley on rangelands as a means of claiming title to the land, even when they recognize that continuous barley cropping without a fallow or legume break to conserve moisture fertility is degrading the environment (Oram et. al 1994). Perhaps of even greater importance, the absence of clear property rights is a major disincentive to private investment in sustainable land management (shrub plantations, range reseeding or phosphate application, fencing, soil conservation, terracing, and water harvesting. ) (Ngaido 1997)
Prior to the 1970's there were forty percent fewer sheep in the M&M countries, and they were able to obtain a large share of their sustenance from the natural grazings. However, in the absence of large-scale feed supplementation their numbers fluctuated widely with precipitation, and losses in drought years kept population from rising in good years to a level which seriously degraded the resource. Even in the 1950's, however, concern was being expressed about the state of the rangelands (FAO 1959).
An important consequence of the demand pressures discussed above, combined with price incentives and other government interventions, even when they are not specifically directed either at the low rainfall areas or the livestock sector, has been to create economic and social situations which encourage farmers to keep more and more sheep in those areas (and often for longer periods) than the natural grazings can support. Increasing concentration on one species of the animal population is also detrimental.
This has had two significant results. First, there has been a progressive decline in the contribution of the rangelands to small ruminant diets and a concomitant increase in flock owners' reliance on other sources of roughage (especially cereal straw and stubbles, and by-products of crops grown in higher rainfall or irrigated lands); and on supplementation with grains and concentrates. (Nordblom et al. 1995). While this is partly a reflection of the substantial increase in the number of animals on a shrinking area of rangelands, it is also widely attributed to resource degradation from overstocking.
Second, the risks of catastrophic losses of animals from disease and drought (particularly the latter) have been greatly enhanced by the escalation of ruminant numbers. Over the years drought has caused grave social, economic, and political problems in the M&M regions, which have affected entire nations. For example the severe 1995 drought in Morocco led to a 40 percent decline in national GDP and the loss of 100 million work days nation-wide (Iovanna 1996).
Nevertheless, it is the agriculture of the low rainfall areas, which are heavily dependent on cereals and small ruminant livestock as the main sources of agricultural income which is the most immediately and devastatingly hit by drought. Livestock are both affected directly through loss of feed and water supply and indirectly by increased vulnerability to disease. For example:
In Morocco, 25 percent of the cattle and 30 percent of the sheep perished or were sold prematurely in the 1981-82 droughts. Data for livestock in 1995 are not yet published, but cereal production fell that year to a third of the ten-year average, while food and feed imports doubled.
In Tunisia, meat and milk production dropped by 35 and 22 percent respectively in the 1978–79 droughts (Boughanni et al. 1996); while cereal output for 1979–81 was only half that for 1991–92.
In Syria, the national sheep flock declined by 25–30 percent (2.5 million head) in the 1983–84 droughts due to starvation, crisis slaughter, and emergency export. (World Bank 1986). Meat prices collapsed and grain prices rose: this caused a serious crisis in the nascent private sector poultry industry, with numerous bankruptcies (USDA 1985).
In Iraq, there was almost complete failure of cereal crops and range vegetation in the devastating 1983 drought, resulting in premature sale, slaughter, or smuggling to neighboring countries of a high proportion of the flocks. Loss of many ewes seriously retarded recovery. (Adary 1997).
In Jordan, 70 percent of the camels perished from drought between 1958 and 1962 (Lancaster 1981).
Drought mitigation policies
In an attempt to limit the social and economic damage from drought, governments have instituted a range of measures, beginning in the 1980's, which have tended to become more complex over time. Of all the policies affecting livestock and the environment in the low rainfall areas these are probably the most important, and they will, therefore, be reviewed in some detail here, based on a synthesis of the drought mitigation programs in Jordan, Morocco, Syria and Tunisia. While these vary in detail they have many common features, for example:
Concentrate feed purchase and distribution to owners of ruminant livestock under government auspices is a key element in all countries. Generally this feed is provided at prices well below subsidized national producer prices, but not necessarily below border prices for imported feed. The main components are barley, sorghum or maize, and bran; although baled hay and lucerne is important in North Africa. Some domestic cereal producers who own sheep may receive a double subsidy - on prices of grain which they sell to the government and on supplementary feed provided for their stock under the drought mitigation programs.
While this feed was originally intended as a drought emergency measure it has tended to become institutionalized and is proving a political and social embarrassment to some governments, particularly those involved in structural adjustment commitments.
The feed has generally been distributed to flock owners on an untargeted per head of livestock basis, leading both to an escalation of animal numbers and to moral hazards. (Blench 1995). In countries with a majority of the animals in the hands of a few owners-- as is the case in Jordan, the wealthier farmers have clearly benefitted most. Capital accumulation has facilitated the purchase of tractors, water tankers and trucks as well as more stock--thus creating an upward spiral of demand for supplementary feed as the rangeland contribution per capita declines.
The quantities of feed sold at subsidized prices or distributed through emergency programs have been considerable. In Jordan the annual average rose from 96,000 m. t. of barley, 95,000 m. t. of bran, and 65,000 m. t. of corn/sorghum for the 1982–90 period to an average of 552,000 m. t. barley, 167,000 m. t. of bran, and 35,000 m. t. of corn/sorghum for 1993–95. The cumulative subsidy cost for 1991-96 totaled about 116 million US dollars. (Salem and Sweiti 1996). Stroebel (1996) describes this as a subsidy for overgrazing and the destruction of the environment! In Syria numbers of sheep increased by 7.6 million between 1975 and 1983, while consumption of concentrates rose concurrently from 6% to 25% of total feed supply, and the contribution of rangelands fell from 65% to 33% of supply. (World Bank 1986). In Tunisia concentrates, which averaged under 10% of total feed requirements up to the mid-1980s, have risen subsequently to 30% in ‘normal’ years and 50% in drought years. (World Bank 1991). In the 1993–95 drought period 991,000 m. t. of barley and 704,000 m. t. of bran were distributed to farmers and/or sold to the feed industry. Imports of feed barley averaged about 500,000 m. t. in 1994 and 1995, compared to 256,000 m. t. in 1993 and only 55,000 m. t. in 1996. (M&M Project 1997). There were also considerable imports of bran, sorghum, oats and lucerne in 1994 and 1995, while none were recorded for 1993 or 1994. In Morocco 751,000 m. t. of barley and mixed feeds were provided during the 1995 drought, plus tax and custom free importation of 210,000 m. t. of bran, and 316,000 m. t. of dry lucerne and sugar-beet pulp. The total cost of subsidies and transport of feed between 1981–1995 was almost 1.4 billion dirhams(about 165 million US dollars). Relative to the size of the national sheepflock, however, this is a smaller per capita allocation than in Jordan or Tunisia, and an ongoing survey indicates that Moroccan farmers found the quantities allocated to be insufficient.
Most countries have embodied veterinary prophylaxis measures, as a means of reducing losses of stock rendered more vulnerable to diseases and parasites by drought. Syria achieved a notable success in the early 1980's by eradicating sheep pox under the program, a major source of past losses. The establishment of 80 mobile field clinics contributed greatly to this achievement, as well as to preventing heavy cattle losses from a rinderpest outbreak in 1983. Vaccine availability in Syria, Jordan, Tunisia, and Morocco has been expanded - 8 million doses were provided in the latter during the 1995 drought. In Tunisia the costs of the disease prophylactic campaign between 1992/3 and 1995/6 were 34.2 percent of the total Sauvegarde program costs, exceeding those of barley subsidies which were nominal because of cheap imports.
Most programs involve measures to improve access to credit for purchase of feed, often through the cooperatives which are usually a principal agent for the local distribution of feed. 6 Provision to defer repayment of farmers' debts to credit banks is often included, although in severe droughts this has caused problems with the capitalization of the banks. 7 A further negative result is to boost livestock numbers in good years by easy access to cheap capital.
While detailed costs of the feed itself, including imports, are often specified, those of the importation, storage, transport, distribution, and sale of feed are rarely indicated. In some cases — for example Morocco, distribution of feed is provided down to farm level. The loss of revenue from tax, tariff and custom free imports of feed must also be taken into account. Nor are administrative costs identified, although they must be considerable: because of the heavy government involvement in drought emergency measures hence governments have been trying to reduce their direct involvement in managing the feed component of the programs by granting more responsibility to cooperatives and local authorities.
In most countries the state still maintains central responsibility for the planning, financing, importation, and administration of feed distribution and drought relief measures, especially with respect to ruminant livestock in low rainfall areas. In some cases the programs are managed by an inter-ministerial committee (Tunisia and Syria), in others principally by a specific ministry (the Ministry of Supply in Jordan). Decentralization is achieved through regional and local authorities, and/or cooperatives, with feedback to the responsible government agencies on progress and problems. Increased private sector involvement is developing in transport and distribution of feed.
As the programs have evolved over time they have in some respects become more innovative. Examples of this include:
Establishment of revolving funds derived from sales of feed, interest payments on credit, taxes on slaughter of animals etc., to maintain and replenish strategic reserve of feedstocks against future emergencies.
Welfare provisions, such as aid-in-kind to small farmers, or food-for-work, including improvement of rural infrastructure.
Drought early warning systems are under consideration as well as crop or rainfall insurance against drought. An experimental crop insurance scheme was launched in Morocco in 1995 on 94,000 hectares in 22 communes.
Range improvement measures form part of most programs, including water point development, communal range improvement measures, and considerable government investments in shrub plantations. In some cases sequestration of grazings for the latter has caused resentment among local people, although this is gradually being defused over time through granting of permits to allow access of flocks to the plantations on a per capita payment basis. 8 However there is relatively little individual private investment in shrubs, because of their cost and lack of secure property rights, while governments seem to have done little to foster communal grazing associations.
Conclusions with respect to the impact of government policies on livestock and the environment
Redressing the balance: priorities for the future management of low rainfall agriculture
Create a permanent institutional base to manage drought.
There is an urgent need for countries to treat drought as an integral component of the production function rather than as an unpredictable emergency, and to give a high priority to developing national drought management strategies with strong central planning and administrative support; appropriate technical backstopping and predictive capability including early warning and rangeland monitoring systems; and decentralization of planning to the regional and municipal level. Without such an institutional base governments are largely flying blind and policies for dealing with drought will remain ad hoc and reactive.
Increase investment in the development of the low rainfall areas.
Governments have concentrated investments in infrastructure on the higher rainfall and irrigated areas and have largely neglected the economic and social development of the low rainfall areas. This is a major cause of poverty and high rates of migration from those areas. There is strong evidence (from a recent review of about sixty agricultural projects) that national investment in infrastructure and social services is a key incentive to achieving their financial and environmental objectives - provided that those objectives have been formulated in close participation and agreement with local people and not thrust on them from above. (Oram and de Haan 1996). As well as improving levels of living, health, education and incomes through access to markets, infrastructural investment may also create employment, directly and indirectly, thus helping to stabilize incomes and reduce out-migration; and it may help to sweeten the pill of changes in government policies to reduce the untargeted subsidies and other handouts to which farmers and flock owners have become accustomed. In terms of the foregone opportunities for investment in social infrastructure in the low rainfall areas, the costs of these subsidies appear high; if the damage to the environment could be vectored in they would probably be enormous.
Review national and agricultural policies in terms of their potential impact on the environment.
Governments still exert a strong influence on food and feed imports, prices, credit, and purchasing, storage and sale of cereals, despite moving towards market liberalization and structural adjustment agreements with the Bretton Woods Institutions in Algeria, Jordan, Morocco, and Tunisia, and some relaxation of government controls in Syria. As part of their review of current macro and sectoral policies, it would be valuable for governments to examine their role in creating intractable problems in the low rainfall areas; especially those which provide perverse incentives to increase small ruminant numbers and mechanized cultivation of rangelands. Success should not be measured in terms of stabilizing maximum numbers of animals on a deteriorating natural resource base by distribution of subsidized feed, but rather by creating conditions which enable fewer but more productive stock to be maintained sustainably through mobility and range-crop-livestock integration.
Encourage participation of the private sector in agricultural development of the low rainfall areas.
Crop management: For the higher rainfall and irrigated areas the private sector generally plays a major role in the provision of seed, fertilizer, and other inputs for crop production as well as in purchase, processing, and marketing of products. As rainfall declines and the scope for crop diversification decreases this role diminishes as farmers become increasingly averse to risking expenditure on modern yield-increasing technology. Recent studies in the M&M countries show that there has been very limited adoption of modern cereal varieties, forage legumes, fertilizer, herbicide, or other inputs below 300 mm MAP, where farmers remain wedded to low input, barley-dominant cereal culture. (Oram et al., 1994; Tutwiler 1996).
Under these circumstances the principal current role of the private sector in crop production is in mechanization of cereal cultivation and harvesting, principally through contractual services. This may help to reduce vulnerability to drought and in this sense should be encouraged: however there are indications that it is also proving environmentally damaging due to inappropriate choice of machinery and cultivation of sloping land without any soil conservation measures. Governments should monitor these practices and could act to ban cultivation on soils or slopes at high risk; however, they could also play a more constructive role by regulating the type of machinery sold and training contractors and private owners in its appropriate use.
Ruminant livestock management: Of great importance is better understanding of the current nature and capacity of the private sector with respect to the purchase, transportation, marketing, storage, and refrigeration of meat and milk, and fattening of live animals purchased from the low rainfall areas. A modern and well-equipped marketing system could play a major role in facilitating destocking and restocking of rangelands in relation to drought (for which there appears to be no provision in any of the drought mitigation programs); as well as in importation, purchase and distribution of feed. The poultry industry offers an example of successful private enterprise. The key question is whether the private sector is able to take on more responsibility for small ruminant support, and the governments are willing to help them. It is difficult to identify any studies on these issues: this seems to be a black hole in knowledge.
Substantially strengthen research on key issues affecting the low rainfall areas.
Governments have generally accorded low priority to research on the problems of the low rainfall areas, and especially to understanding their socio-economic constraints and examining possible solutions. Tinkering with technology on scattered plots is unlikely to solve many of the problems discussed in this paper.
It is critical that this lacuna is redressed: there are a number of interesting but controversial approaches to raising productivity and alleviating poverty in those areas while reducing damage to the environment, which cannot be adequately explored without a mix of technological and socio-economic disciplines, including modeling. These include:
Trade and price issues
What would be the effect of removing all input and output subsidies on cereals, and fixing market prices at approximately border levels, on land use, domestic production and imports, animal numbers, and farm incomes: especially in the low rainfall areas where barley is grown mainly for feed on-farm?
It has been suggested that traditional sheep production systems based on sale of animals for slaughter at low weights off the low rainfall areas are inefficient. Yet although ‘stratification’ across ecozones for fattening young range-reared animals to larger weights on farms or feedlots in higher rainfall or irrigated areas has long been advocated, both as an efficient way of taking pressure off the range and of increasing output per animal, it does not seem to have taken off. What are the reasons? Better opportunities for land use in high rainfall areas? Price preferences for lean meat? Should governments give higher priority to promoting stratification; if so, by what means?
Drought emergency schemes and social issues
How can governments get off the hook of costly untargeted feed subsidies which mainly benefit larger farmers, without causing social distress to small livestock producers in drought years? Can rationing, with tighter flock registration rules and feed cards, provide a viable basis for targeting, without creating moral hazards? Morocco has been developing a system for feed allocation based on expectations of drought severity and targeting of areas most severely affected. (Laamari and El Mourid 1997).
Are there alternative means than feed subsidies of helping farmers to bridge feed gaps in emergencies — a feed revolving fund to maintain a government reserve for sale at border prices, subsidies on transport for its distribution, better credit access regardless of collateral? Should small marginal producers be helped financially or by other means such as job training to leave agriculture? The Australian Rural Adjustment Scheme may merit study as a possible model. (Musgrave 1990).
Environmental Issues: Alternatives to barley-barley-barley
Alternatives to the environmentally damaging barley-barley system of feed production currently preferred by farmers in the low rainfall areas need to be found. These could involve a moratorium on barley and/or mechanization below a given MAP or on terrain unsuited to cultivation, and reversion to natural or reseeded rangeland. Perhaps ‘set-aside’ payments could be considered for legal owners of such land; alternatively, a barley-forage legume system; barley-alley cropping with a perennial, or shrubs/cactus could be promoted. These may be more viable options than range reseeding and rotational grazing in areas where property rights are at issue. How could their adoption be encouraged? Options might be to introduce acreage payments for forage legumes on a time-specific basis; special credits for investment in shrubs; and some form of insurance (probably based on rainfall) to mitigate drought risks. Unfortunately, current knowledge on the feed potential of the barley-barley system, and of these options as alternatives to barley or to properly managed rangelands, is inadequate for well-judged recommendations to governments.
Property Rights Issues
It is widely recognized that uncertainties over property rights in the low rainfall areas are a major constraint, both to environmentally sound land management and investment in technology and land improvement.
This is a major problem for governments, especially with respect to rangelands, where animals are owned privately but the resource may be common; involving difficult decisions of control over land, and whether and under what circumstances solutions can be found through promotion of grazing associations, issuance of grazing permits, other special measures to support community action, or through privatization. A key issue is how to enthuse and empower local people, and engender a sense of responsibility for the resource. These problems and related legislative or other reforms will take time to resolve. (Ngaido 1997).
However, there are some technological options which do not depend on clear property rights for success, including the use of feed blocks and straw treatment to improve sheep nutrition, and various animal health measures. These may merit priority where some longer-term or more costly options are constrained by risk and legal or other uncertainties, especially in view of reports of increased incidence of metabolic and parasitic diseases of sheep in some countries. (Blench 1995).
Monitoring and Evaluation Issues
Monitoring and evaluation of farming, livestock management, and the environmental health of the resource base in the low rainfall areas is crucial to their sustainable development and to providing essential data for answering the key questions of reconciling growth with poverty alleviation and environmental sustainability there, for example with respect to resource degradation and the resilience of the rangelands. This has been neglected by governments and development projects; and putting modern well-equipped monitoring and evaluation systems in place staffed by well-trained inter-disciplinary teams on a long-term basis should have very high priority.
References
Adary, Adnan. 1996. Drought management in the Jazeera of northern Iraq. Paper Contributing to Mashreq and Maghreb Project. Baghdad, Iraq: IPA Agricultural Research Center.
Blench, Roger. 1995. Baseline survey of socio-economic and animal production data. Report to IFAD. Jordan: National Program for Range Rehabilitation and Development.
Cocks, P. S., E. F. Thomson, K. Somel, and A. Abd El-Moneim. 1980. Degradation and rehabilitation of agricultural land in north Syria. Aleppo, Syrian Arab Republic: International Center for Agricultural Research in the Dry Areas (ICARDA).
Boughanmi, Houcine. 1996. Drought Management and Public Policy. Draft report on Tunisia. Contributing to the Mashreq and Maghreb Project. INRA: Settat, Morocco.
Economides, Soterios. 1995. Animal production. In Sustainable range-dependent small ruminant production systems in the Near East Region. Cairo: Regional Office for the Near East, Food and Agriculture Organization.
Food and Agriculture Organization. 1959. Mediterranean Development Project. Main Report. Rome.
Food and Agriculture Organization. 1967. FAO Mediterranean Development Project. Jordan Country Report. Rome.
Food and Agriculture Organization. 1972. FAO Production Yearbook Vol. 26. Rome.
Food and Agriculture Organization. 1978. FAO Production Yearbook Vol. 32. Rome.
Food and Agriculture Organization. 1981. FAO Production Yearbook Vol. 35. Rome.
Food and Agriculture Organization. 1984a. FAO Trade Yearbook Vol. 35. Rome.
Food and Agriculture Organization. 1984b. FAO Production Yearbook Vol. 38. Rome.
Food and Agriculture Organization. 1988. FAO Production Yearbook Vol. 42. Rome.
Food and Agriculture Organization. 1990. FAO Production Yearbook Vol. 44. Rome.
Food and Agriculture Organization. 1995. FAO Production Yearbook Vol. 49. Rome.
Food and Agriculture Organization. 1994. FAO Trade Yearbook Vol. 48. Rome.
Iovanna, Richard. 1996. Sustainable drought management in Morocco. Report prepared for the World Bank Personal Communication.
Laamari, Abdelah, Mohamed El Mourid, and Nabil Chaherli. 1997. Secheresse et Interventions d l'Etat. Draft Report. Contributing to the Mashreq and Meghreb Project. INRA: Settat, Morocco.
Leybourne, Marina. 1993. Links between the steppe and cultivated areas through migration. Dipl^me de Rechereche. No: 78. Geneva: L'Institut Universitaire d'Etudes Du Developpement.
Musgrave, W. F. 1990. Rural adjustment. In Agriculture in the Australian Economy, ed. D. B. Williams. Sydney: University Press.
Nordblom, Thomas L., A. V. Goodchild, and Farouk Shomo. 1995. Working Paper prepared for the Joint FAO/ILRI Roundtable on Livestock Development Strategies for Low Income Countries, March 1995. Addis Ababa, Ethiopia.
Oram, Peter A. and Cornelis de Haan. 1995. Technologies for rainfed agriculture in Mediterranean climates: A review of World Bank experiences. World Bank Technical Paper Number 300. Washington, D. C. : World Bank.
Salem, Mahmoud and Rasmi Sweiti. 1996. Review of past and recent government drought relief programs. Jordan. Paper contributing to the Mashreq and Meghreb Project. NCARTT: Jordan.
Shideed, Kamil. 1996. The impact of price support policies on cereal production in Iraq. Report contributing to the Mashreq and Maghreb Project. INRA: Settat, Morocco.
Stroebel, M. 1996. Macro-economic prospects of small ruminant production in Jordan. Seminar on Livestock Production. Hashemite Kingdom of Jordan and Deutsche Gesellschaft Fuer Technische Zusammenarbeit (GTZ) GMBH. Amman.
Tadros, Kamal. 1993. Grazing management in Jordan. Proceedings of the ICARDA Grazing Management Workshop, November 1993. Amman, Jordan: ICARDA.
U.S.Department of Agriculture, Foreign Agricultural Service. 1985. Syria: Grain and feed. Washington, D. C.
World Bank. 1991. Tunisia: Small farmers potential and prospects. A technical study. Washington, D. C.
World Bank. 1992. Development and the environment. World Development Report. Washington, D. C.
World Bank. 1995. Rangelands development in arid and semi-arid areas: Strategies and Policies. North Africa and Iran Main Report. Washington, D. C.
World Bank. 1996. From plan to market. World Bank Development Report. Washington, D. C.
TABLE 1. LAND USE IN THE MASHREQ AND MAGHREB COUNTRIES, 1991, AND CHANGES SINCE 1970
| Area (000 ha) | Percent change in area, 1970–91 | ||||||||
|---|---|---|---|---|---|---|---|---|---|
| Total Land | Cultivated Area | Permanent Pasture | Forest & Woodland | Other Land | Cultivated Land | Permanent Pasture | Forest & Woodland | Other Land | |
| Iraq | 43,737 | 5,450 | 4,000 | 1,880 | 32,407 | 9.1 | 0 | 0. 1 | -0. 1 |
| Jordan | 8,893 | 402 | 791 | 70 | 7,630 | 24.1 | 0 | 6.6 | 1.2 |
| Lebanon | 1,023 | 306 | 10 | 80 | 627 | -6.1 | 0 | -15.8 | 5.7 |
| Syria | 18,392 | 5,625 | 7,750 | 730 | 4,287 | -4.7 | 2.6 | 55.0 | -5.4 |
| Mashreq Region | 72,045 | 11,783 | 12,551 | 2,760 | 44,951 | -6.0 | 7.6 | 7.9 | -2.0 |
| Algeria | 238,174 | 7,653 | 31,000 | 4,050 | 195,471 | 11.6 | -17.9 | 67.1 | 2.3 |
| Libya | 175,954 | 2,160 | 13,300 | 695 | 159,799 | 6.6 | 20. 9 | 30. 4 | -1.6 |
| Morocco | 44,630 | 9,420 | 20,900 | 9,050 | 5,260 | 26.0 | 67.2 | 75.30 | -73.0 |
| Tunisia | 15,536 | 4,875 | 4,335 | 668 | 5,658 | 8.7 | 70. 0 | 14.4 | -28.6 |
| Maghreb Region | 474,294 | 24,108 | 69,535 | 14,463 | 366,188 | 15.6 | 9.0 | 66.2 | -3.9 |
Source: FAO Production Yearbooks, Vol. 26, 1972 and Vol. 49, 1995.
TABLE 2. POPULATION DYNAMICS: M & M COUNTRIES 1960 – 1995
| Year | Total Population | Agricultural Pop'n | % Share Ag: Total | |||
|---|---|---|---|---|---|---|
| Mashreq | Maghreb | Mashreq | Maghreb | Mashreq | Maghreb | |
| 000's | 000's | 000's | 000's | % | % | |
| 1960 | 15,311 | 28,378 | 8,034 | 17,534 | 52.4 | 61.8 |
| 1970 | 20,382 | 35,981 | 8,745 | 20,067 | 42.9 | 55.8 |
| 1980 | 26,556 | 47,549 | 7,375 | 20,407 | 27.8 | 42.9 |
| 1990 | 36,252 | 61,894 | 7,694 | 19,948 | 25.2 | 32.2 |
| 1995 | 42,302 | 69,270 | 7,830 | 19,926 | 18.5 | 28.8 |
| M & M Regional Totals | ||||||
| 1960 | 43,689 | 25,568 | 58.5 | |||
| 1995 | 111,572 | 27,756 | 24.9 | |||
Source: FAO Production Yearbooks: 1972, Tables 3 and 5; 1981, Table 3; 1995, Table 3. Eight countries.
TABLE 3: CHANGES IN AREAS OF KEY CROPS IN M&M REGION, 1969–71 TO 1989–91 (000 HA)
| Barley | Wheat | Pulse | Total Arable | Permanent Crops | Arable + Perm. Crops | |
|---|---|---|---|---|---|---|
| Iraq | 796 | 122 | -29 | 401 | 55 | 456 |
| Jordan | 23 | -108 | -22 | 22 | 56 | 78 |
| Lebanon | 4 | -20 | 5 | -24 | 5 | -19 |
| Syria | 1,625 | 59 | -16 | -771 | 495 | -276 |
| Mashreq region | 2,448 | 53 | -62 | -372 | 611 | 239 |
| Algeria | 527 | -581 | 26 | 798 | -1 | 797 |
| Libya | 87 | 32 | 6 | 83 | 50 | 133 |
| Morocco | 332 | 578 | 54 | 1,750 | 191 | 1,951 |
| Tunisia | 270 | 137 | 23 | -345 | 737 | 392 |
| Maghreb region | 1,216 | 102 | 109 | 2,286 | 977 | 3,273 |
| M&M Aggregate region: | 3,664 | 155 | 47 | 1,914 | 1,588 | 3,512 |
Total arable includes other crops (summer cereals, roots, sugar, oilseeds, vegetables, cotton, etc. ).
Sources: FAO Production Yearbooks, Vol. 35, 1981; Vol. 46, 1992.
TABLE 4. BARLEY: IMPORTS AND EXPORTS FROM THE MASHREQ AND MAGHREB REGIONS 1982–84, 1986–88, 1992–94 AND PERCENT TOTAL CEREAL IMPORTS 1992–94
| Country | Imports 1982–84 MT | Exports 1982–84 MT | Imports 1986–88 MT | Exports 1986–88 MT | Imports 1992–94 MT | Exports 1992–94 MT | Imports 1992–84 000$ | Exports 1992–84 000$ | Total Imports 1992–84 Mill MT | All Cereals 1992–84 Mill US$ |
|---|---|---|---|---|---|---|---|---|---|---|
| Iraq | 311,667 | -- | 136,666 | 99,436 | 90,000 | -- | 9,800 | -- | 4,006 | 699 |
| Jordan | 88,845 | -- | 118,770 | -- | 416,113 | -- | 42,726 | -- | 846 | 140 |
| Lebanon | 19,410 | -- | 24,330 | -- | 45,000 | -- | 3,733 | -- | 519 | 76 |
| Syria | 99,791 | 204,216 | 11,590 | 59,053 | 27,386 | 132,000 | 1,930 | 37,500 | 1,120 | 151 |
| Total Mashreq | 519,713 | 204,216 | 291,356 | 158,489 | 578,499 | 132,000 | 58,189 | 37,500 | 6,491 | 1,066 |
| Algeria | 484,009 | -- | 205,380 | -- | 426,796 | -- | 71,399 | -- | 4,868 | 687 |
| Libya | 169,308 | -- | 566,661 | -- | 958,333 | -- | 95,833 | -- | 1,549 | 239 |
| Morocco | 96,843 | -- | 2,780 | 87,873 | 387,213 | 5,950 | 38,721 | 1,593 | 1,830 | 200 |
| Tunisia | 24,185 | -- | 219,220 | -- | 136,890 | 28,146 | 13,689 | 3,373 | 1,532 | 194 |
| Total Maghreb | 774,345 | -- | 994,041 | 87,873 | 1,909,232 | 34,096 | 219,642 | 4,966 | 9779 | 1,320 |
| Total M&M | 1,294,058 | 204,216 | 1,285,397 | 246,362 | 2,487,731 | 166,096 | 277,831 | 42,466 | 16,270 | 2,386 |
Source: FAO Trade Yearbooks
| Country | Year | Meat, Fresh & Frozen: Imports | Live Animals: Imports | Live Exports Sheep | |||||||
|---|---|---|---|---|---|---|---|---|---|---|---|
| Cattle | Sheep | Cattle | Sheep | Sheep | |||||||
| Metric tons | US$(000) | Metric tons | US$(000) | Head | US$(000) | Head | US$(000) | Head | US$(000) | ||
| Iraq | 1982–84 | 70,000 | 134,000 | 18,666 | 34,333 | 10,333 | 11,833 | 383,333 | 23,333 | C | -- |
| 1992–94 | 18,666 | 29,833 | 233 | 233 | C | C | C | C | 2,566 | 160 | |
| Jordan | 1982–84 | 9,032 | 24,037 | 12,316 | 35,039 | 3,630 | 2,575 | 527,405 | 32,242 | 258,767 | 13,285 |
| 1992–94 | 20,392 | 27,149 | 16,951 | 36,365 | 19,430 | 13,065 | 585,850 | 25,059 | 583,970 | 18,551 | |
| Lebanon | 1982–84 | 16,000 | 33,000 | 5,966 | 11,767 | 103,333 | 41,000 | 340,000 | 24,333 | 6,666 | 533 |
| 1992–94 | 7,900 | 12,900 | 183 | 467 | 109,333 | 57,333 | 426,370 | 49,150 | 65,000 | 4,633 | |
| Syria | 1982–84 | C | C | 5,168 | 12,114 | 5,316 | 3,678 | 134,684 | 9,920 | 183,500 | 22,415 |
| 1992–94 | C | C | 1,479 | 1,100 | 6,627 | 3,875 | 1,200,620 | 8,149 | 1,145,063 | 91,572 | |
| Mashreq Region | 82–84 | 95,032 | 191,037 | 42,116 | 93,253 | 122,612 | 59,086 | 1,385,422 | 89,828 | 448,933 | 36,233 |
| Total | 92–94 | 46,958 | 69,882 | 18,846 | 38,165 | 135,390 | 74,273 | 2,212,840 | 82,358 | 1,796,599 | 114,916 |
| Algeria | 1982–84 | 17,432 | 29,376 | 13,204 | 39,536 | C | C | 3,126 | 213 | C | C |
| 1992–94 | 20,238 | 31,292 | 314 | 651 | 11,292 | 13,602 | 101,950 | 5,039 | C | C | |
| Libya | 1982–84 | 14,311 | 31,774 | 3,823 | 13,970 | 156,405 | 119,545 | 2,210,772 | 167,091 | C | C |
| 1992–94 | 3,800 | 11,733 | 331 | 986 | 126,666 | 61,100 | 12,000 | 17,267 | C | C | |
| Morocco | 1982–84 | 4,497 | 4,983 | 5 | 25 | 14,624 | 11,768 | C | C | C | C |
| 1992–94 | 5,473 | 7,583 | 870 | 1,265 | 21,803 | 23,745 | C | C | 36 | 12 | |
| Tunisia | 1982–84 | 13,258 | 14,703 | 546 | 1,333 | 59,302 | 29,618 | 33,859 | 1,635 | 1,666 | 300 |
| 1992–94 | 10,043 | 16,682 | 538 | 1,136 | 6,025 | 5,276 | 100 | 31 | C | C | |
| Maghreb Region | 1982–84 | 49,498 | 80,836 | 17,578 | 54,864 | 230,331 | 160,481 | 2,247,757 | 168,939 | 1,666 | 300 |
| Total | 1992–94 | 39,554 | 67,295 | 2,053 | 4,038 | 165,786 | 103,723 | 114,050 | 22,337 | 36 | 12 |
| Mashreq-Maghreb | 1982–84 | 144,530 | 271,873 | 59,694 | 148,117 | 352,943 | 219,567 | 3,633,179 | 258,767 | 450,599 | 36,533 |
| Totals | 1992–94 | 86,512 | 137,177 | 20,899 | 42,203 | 301,176 | 177,996 | 2,326,890 | 104,695 | 1,796,635 | 114,928 |
TABLE 6. SHEEP PRODUCTION: M&M REGIONS 1961–65 TO 1993–95 (000 HEAD)
| Country | 1961–65 | 1969–71 | 1979–81 | 1989–91 | 1993–95 | INDEX 1965–95 (1965=100) |
|---|---|---|---|---|---|---|
| Algeria | 4,634 | 7,940 | 13,111 | 17,302 | 18,169 | 392 |
| Libya | 1,378 | 2,125 | 5,046 | 5,100 | 4,766 | 346 |
| Morocco | 10,957 | 17,087 | 15,228 | 13,528 | 14,119 | 129 |
| Tunisia | 8,255 | 5,167 | 4,651 | 5,935 | 7,270 | 88 |
| Total Maghreb | 25,224 | 32,319 | 38,036 | 41,865 | 44,324 | 176 |
| Iraq | 10,138 | 12,000 | 10,399 | 7,804 | 6,157 | 61 |
| Jordan | 752 | 736 | 950 | 1,660 | 2,067 | 275 |
| Lebanon | 200 | 233 | 137 | 222 | 377 | 188 |
| Syria | 4,035 | 5,866 | 9,311 | 14,571 | 11,068 | 274 |
| Total Mashreq | 15,125 | 18,835 | 20,797 | 24,257 | 19,669 | 130 |
| Total M&M | 40,349 | 51,154 | 58,833 | 66,122 | 63,993 | 158 |
Source: FAO Production Yearbooks: Vol. 26,1972; Vol. 32, 1978; Vol. 44, 1990; Vol. 49, 1995.
TABLE 7. BASIC SOCIO-ECONOMIC INDICATORS M&M COUNTRIES1
| Country | Population 1994 | Population Growth 1995–2020 | GNP per capita 1994 | GDP 1994 | Agriculture as % of GDP 1994 | Agricultural Growth Per Annum | Cereal Imports | Increase | ||
|---|---|---|---|---|---|---|---|---|---|---|
| 1980–90 | 1990–94 | 1974 | 1990 | 1974–1990 | ||||||
| 000s | % per annum | US$ | Mill US$ | % | % | % | 000 MT | 000 MT | 1974 = 100 | |
| Algeria | 27,325 | 1.85 | 1,650 | 41,941 | 12 | 4.5 | -0. 2 | 1,816 | 5,185 | 285 |
| Libya | 5,225 | 3.05 | N | N | N | N | N | 612 | 2,290 | 374 |
| Morocco | 26,488 | 1.43 | 1,140 | 30,803 | 21 | 6.7 | -1.5 | 891 | 1,578 | 177 |
| Tunisia | 8,733 | 1.45 | 1,790 | 15,770 | 15 | 2.8 | 0.5 | 307 | 1,439 | 469 |
| Iraq | 19,925 | 2.60 | N | N | N | N | N | 870 | 2,834 | 326 |
| Jordan | 4,023 | 2.90 | 1,240 | 6,105 | 8 | 4.7 | 13.2 | 171 | 1,491 | 872 |
| Lebanon | 2,915 | 1.35 | N | N | N | N | 354 | 356 | 0.5 | |
| Syria | 14,171 | 2.20 | 1,000 | 14,730 | 282 | -0.6 | N | 339 | 2,091 | 6.7 |
| Sources: | FAO Production Yearbook Vol 49, 1995; Population. Population Projections.U.N.Medium Variant World Population Prospects: the 1996 Revision. FAO Trade Yearbook Vol 8, 1994: Cereal Imports. World Bank: World Develop Reports 1992 and 1984: GNP,GDP, Agricultural Growth. |
TABLE 8. SHARE OF ARABLE AREA OCCUPIED BY MAJOR CROPS: MOROCCO AND SYRIA 1989/90
| MOROCCO 1989 | SYRIA 1989 | ||||||||||||
|---|---|---|---|---|---|---|---|---|---|---|---|---|---|
| Ecozones | Sub-humid >400 mm | Semi-arid 300–400 | Arid 200–300 | Mountain Variable | Total No. Reporting % | Sub-humid >350mm | Semi-arid 1 250–350 | Semi-arid 2 250 | Marginal 200–250 | Steppe | Total No. Reporting | ||
| Crops | |||||||||||||
| % | % | % | % | N | % | % | % | % | % | % | N | % | |
| Barley | 76 | 96 | 83 | 100 | 901 | 87 | 95.0 | 99.0 | 100.0 | 100.0 | 100.0 | 770 | 99.2 |
| Wheat | 99 | 84 | 42 | 74 | 737 | 72 | 92.0 | 71.3 | 45.3 | 35.4 | 41.7 | 456 | 58.8 |
| Grain legumes | 67 | 39 | 1 | 26 | 289 | 28 | 81.0 | 76.3 | 7.8 | 4.4 | 2.1 | 218 | 28.2 |
| Forage legumes | 11 | 6 | 0.5 | 0 | 48 | 5 | 23.0 | 14.7 | 10.6 | 2.7 | -- | 92 | 11.8 |
| Maize | 2 | 46 | 10 | 0 | 220 | 21 | -- | -- | -- | -- | -- | -- | -- |
| Oilseeds | 9 | 0 | 0 | 0 | 20 | 2 | -- | -- | -- | -- | -- | -- | -- |
| Vegetables | 9 | 4 | 2 | 0 | 42 | 4 | 25.0 | 8.5 | 2.5 | -- | -- | 54 | 7.0 |
| Other annuals (melons etc.) | 6 | 5 | 8 | 0 | 62 | 6 | 57.0 | 23.2 | 3.7 | 0.9 | -- | 130 | 16.8 |
| Fruit trees & Olives | 36 | 5 | 9 | 47 | 161 | 16 | 450 | 26.1 | 11.9 | 0.9 | -- | 146 | 18.8 |
| Fallow | 28 | 29 | 28 | 44 | 310 | 30 | 22.0 | 47.8 | 49.4 | 33.6 | 29.2 | 234 | 41.8 |
| Total Farmers in each zone | 224 | 379 | 368 | 61 | 1032 | 776 | |||||||
Source: Morocco - Oram et.al.1994; Syria - Oram and Hojjati 1995. Based on analysis at IFPRI of farm surveys supervised by Nabil Khaldi.
FIGURE 1. AREA AND YIELD OF BARLEY:SYRIA 1961–1994
![]()
![]()
![]()