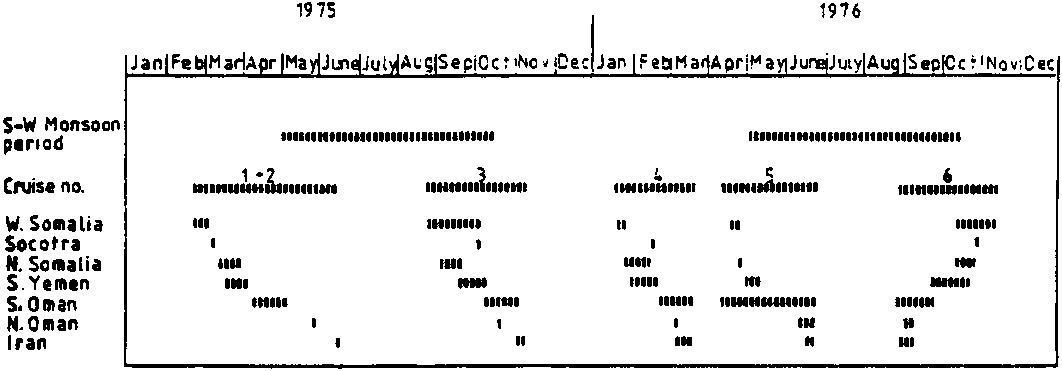
Figure 1. Timing of the survey work
in each sector of the surveyed region.
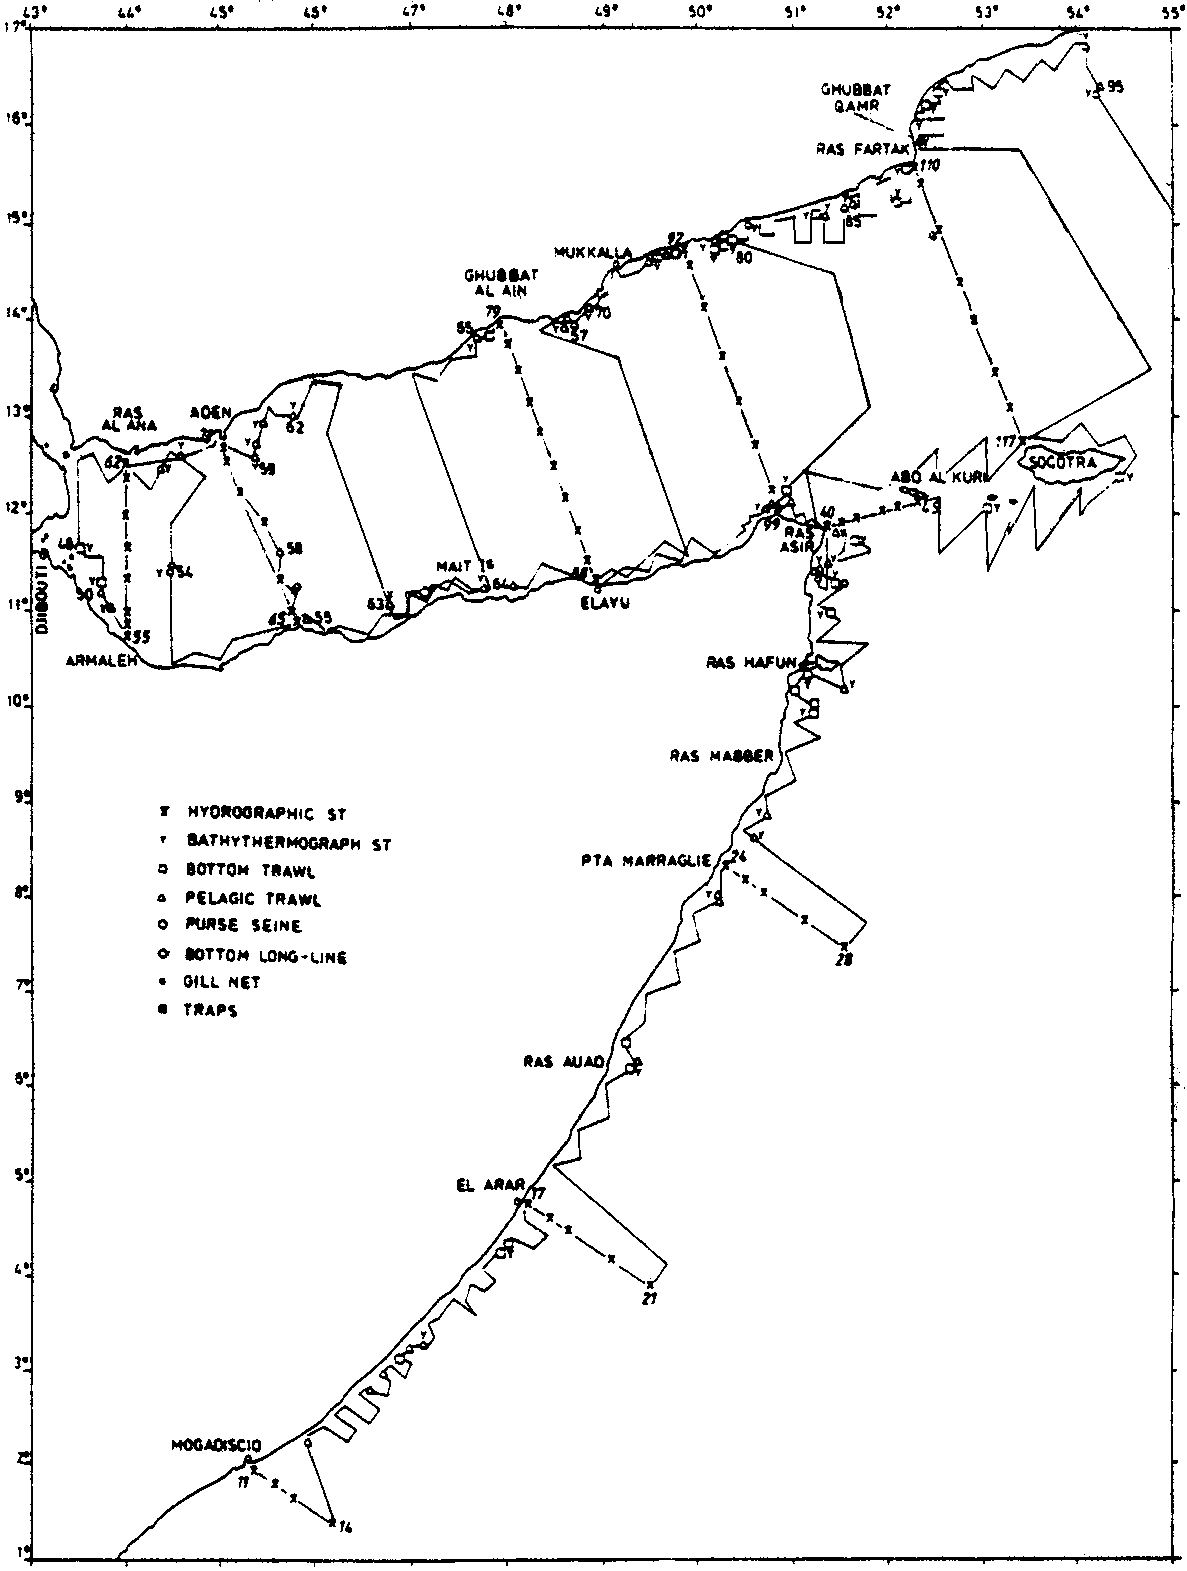
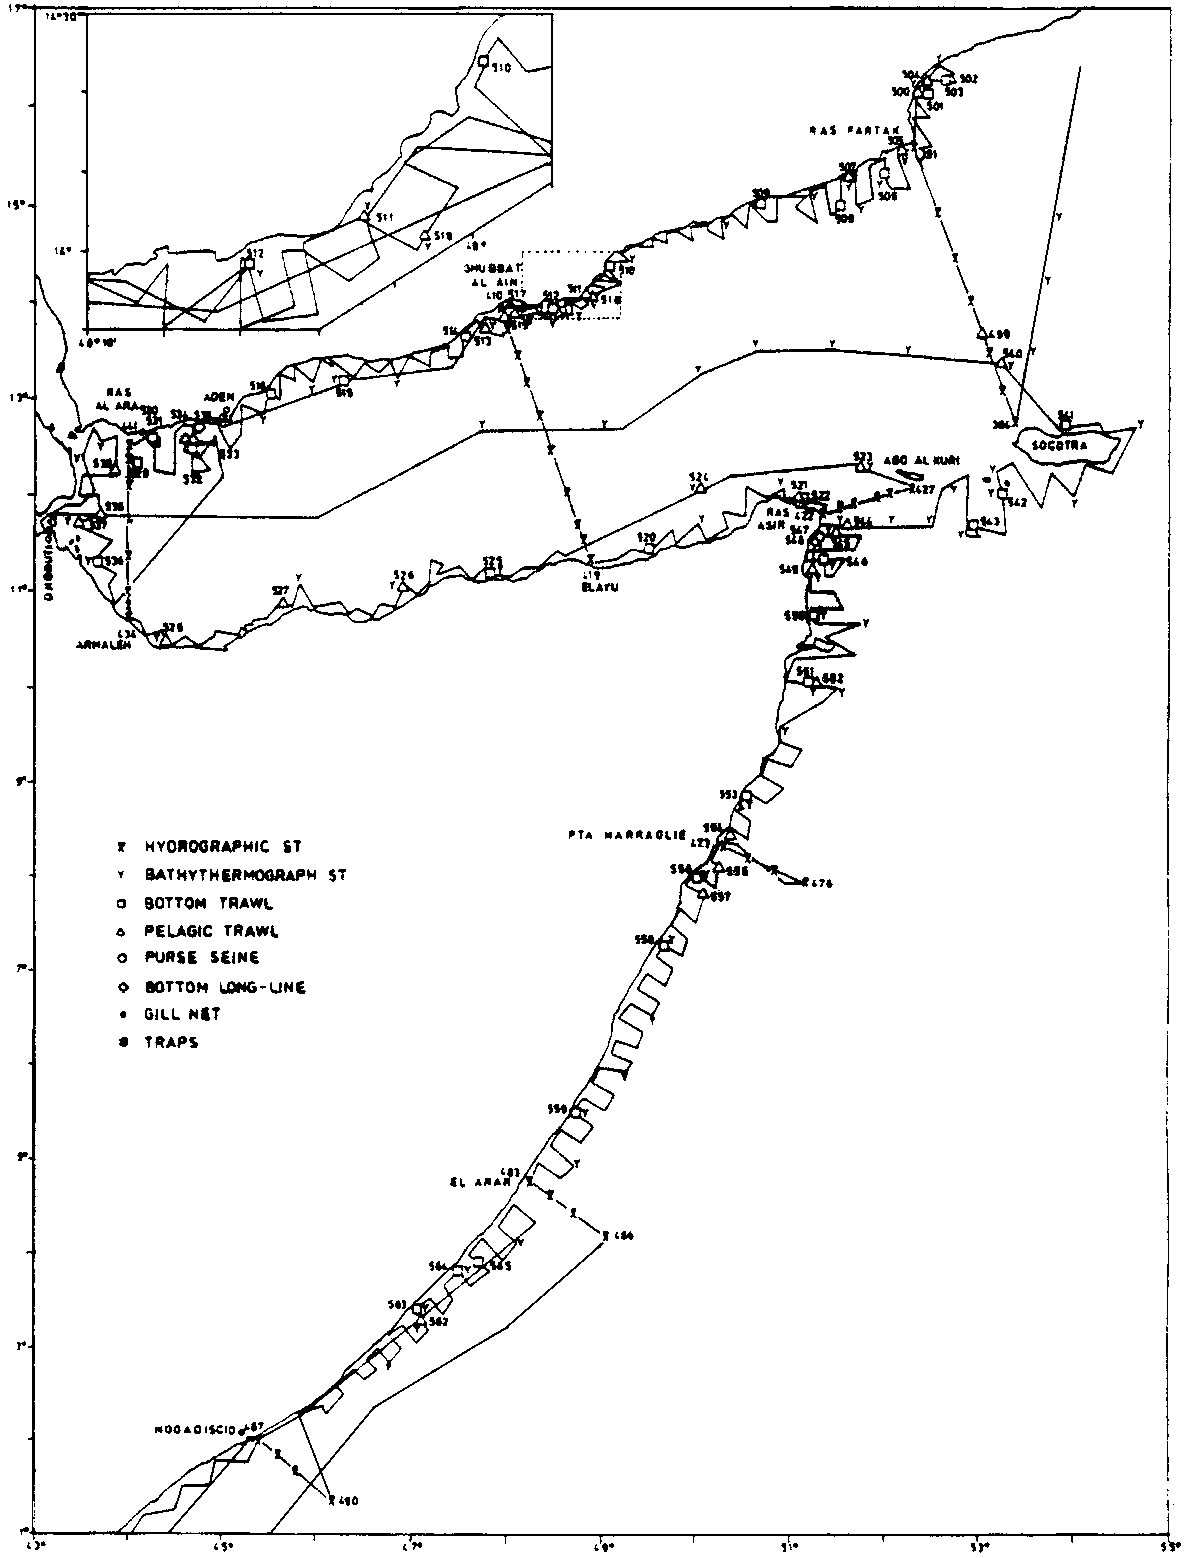
Figure 2a. Survey grid and stations
Cruise 1&2, Feb-Mar 1975, Somalia East Coast - Gulf of Aden.
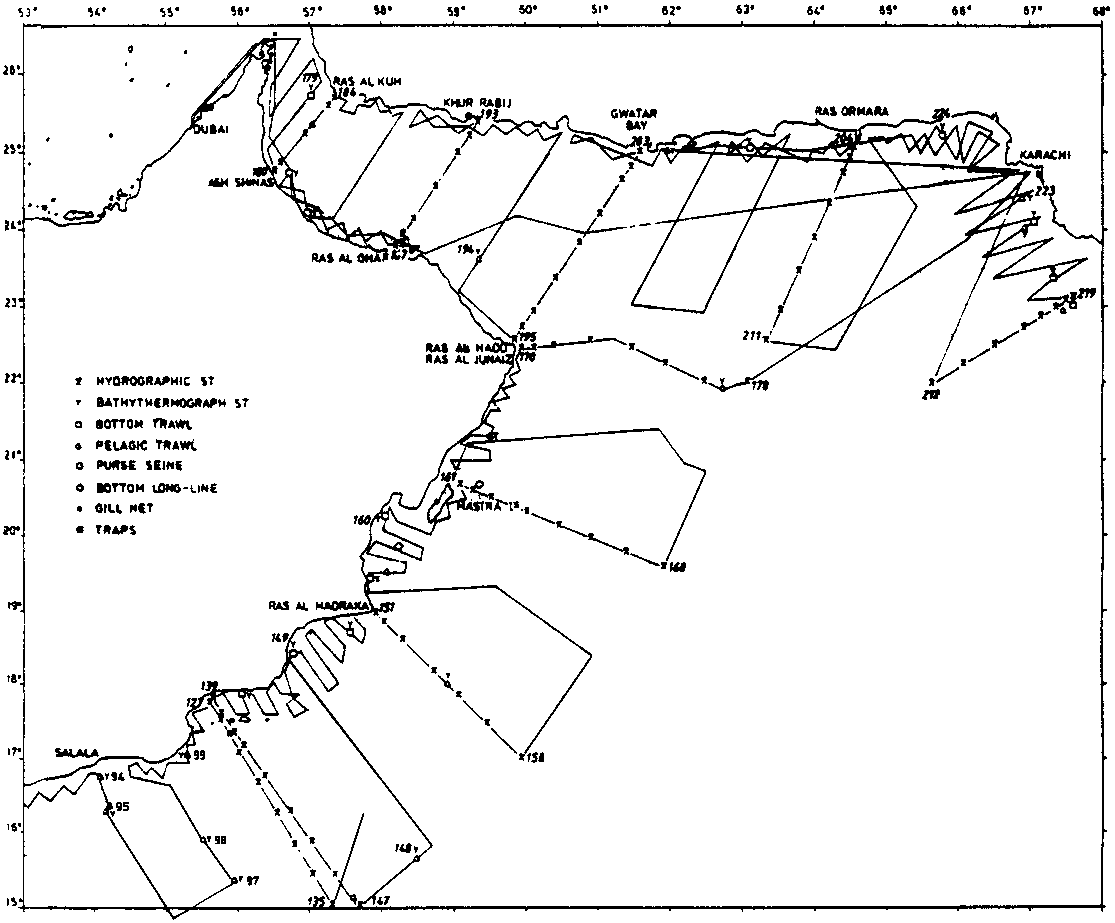
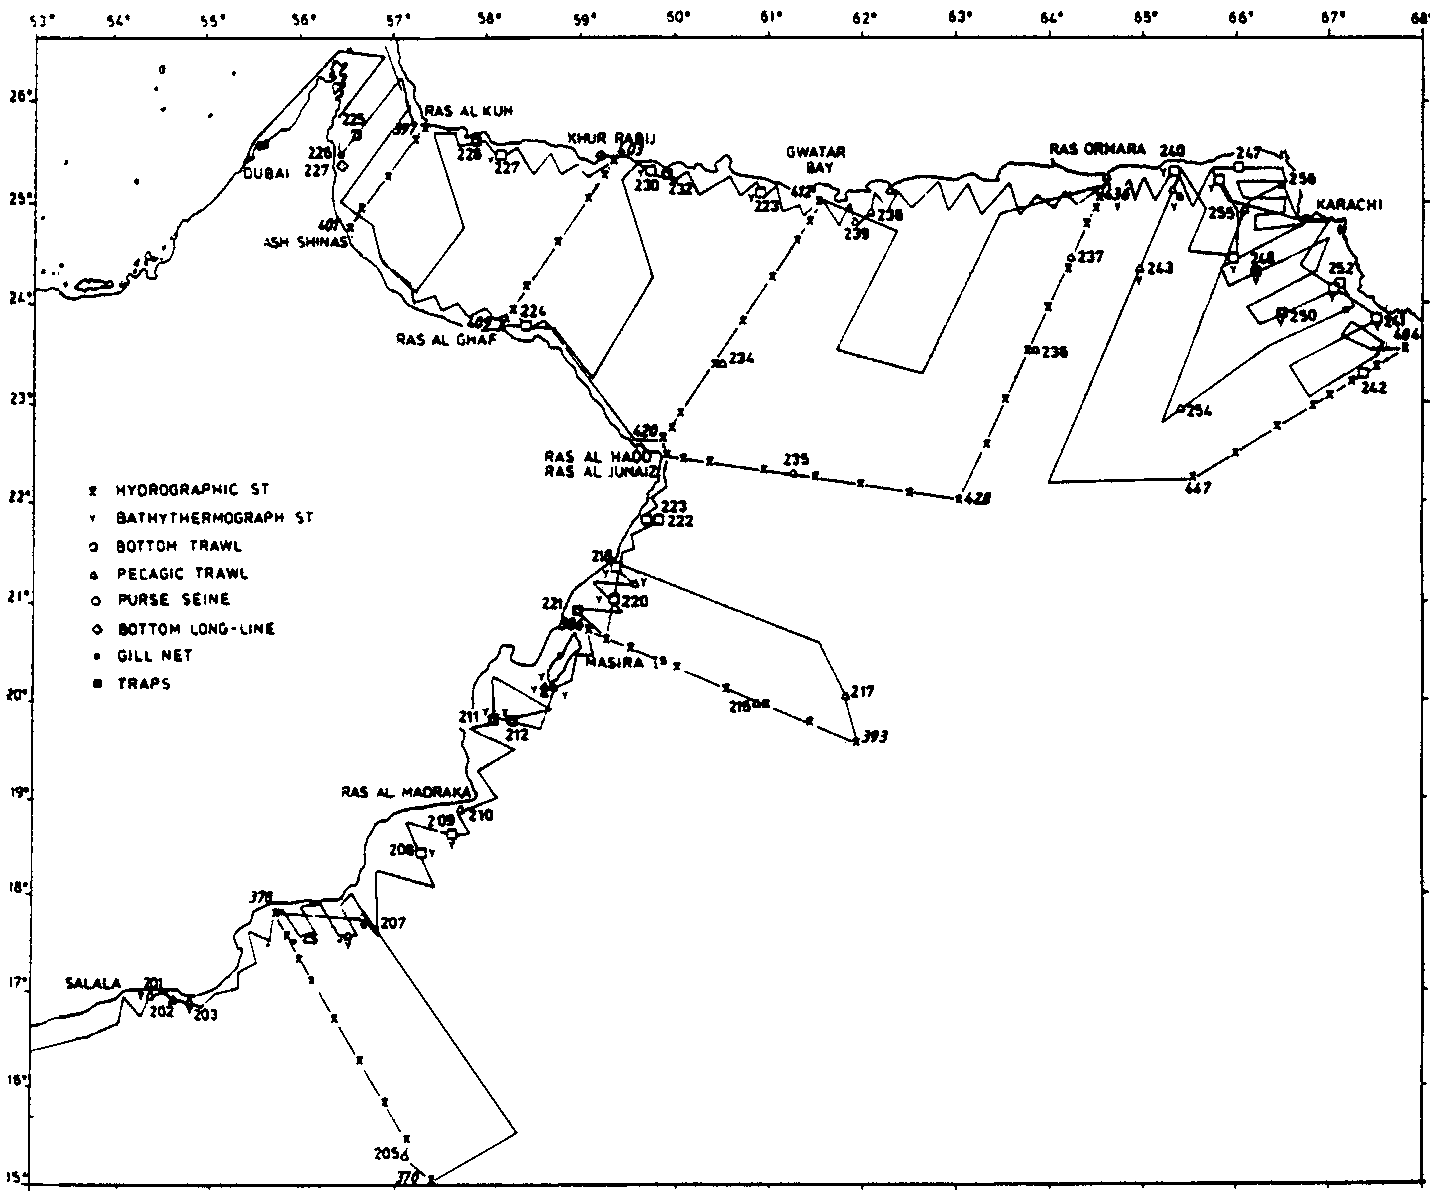
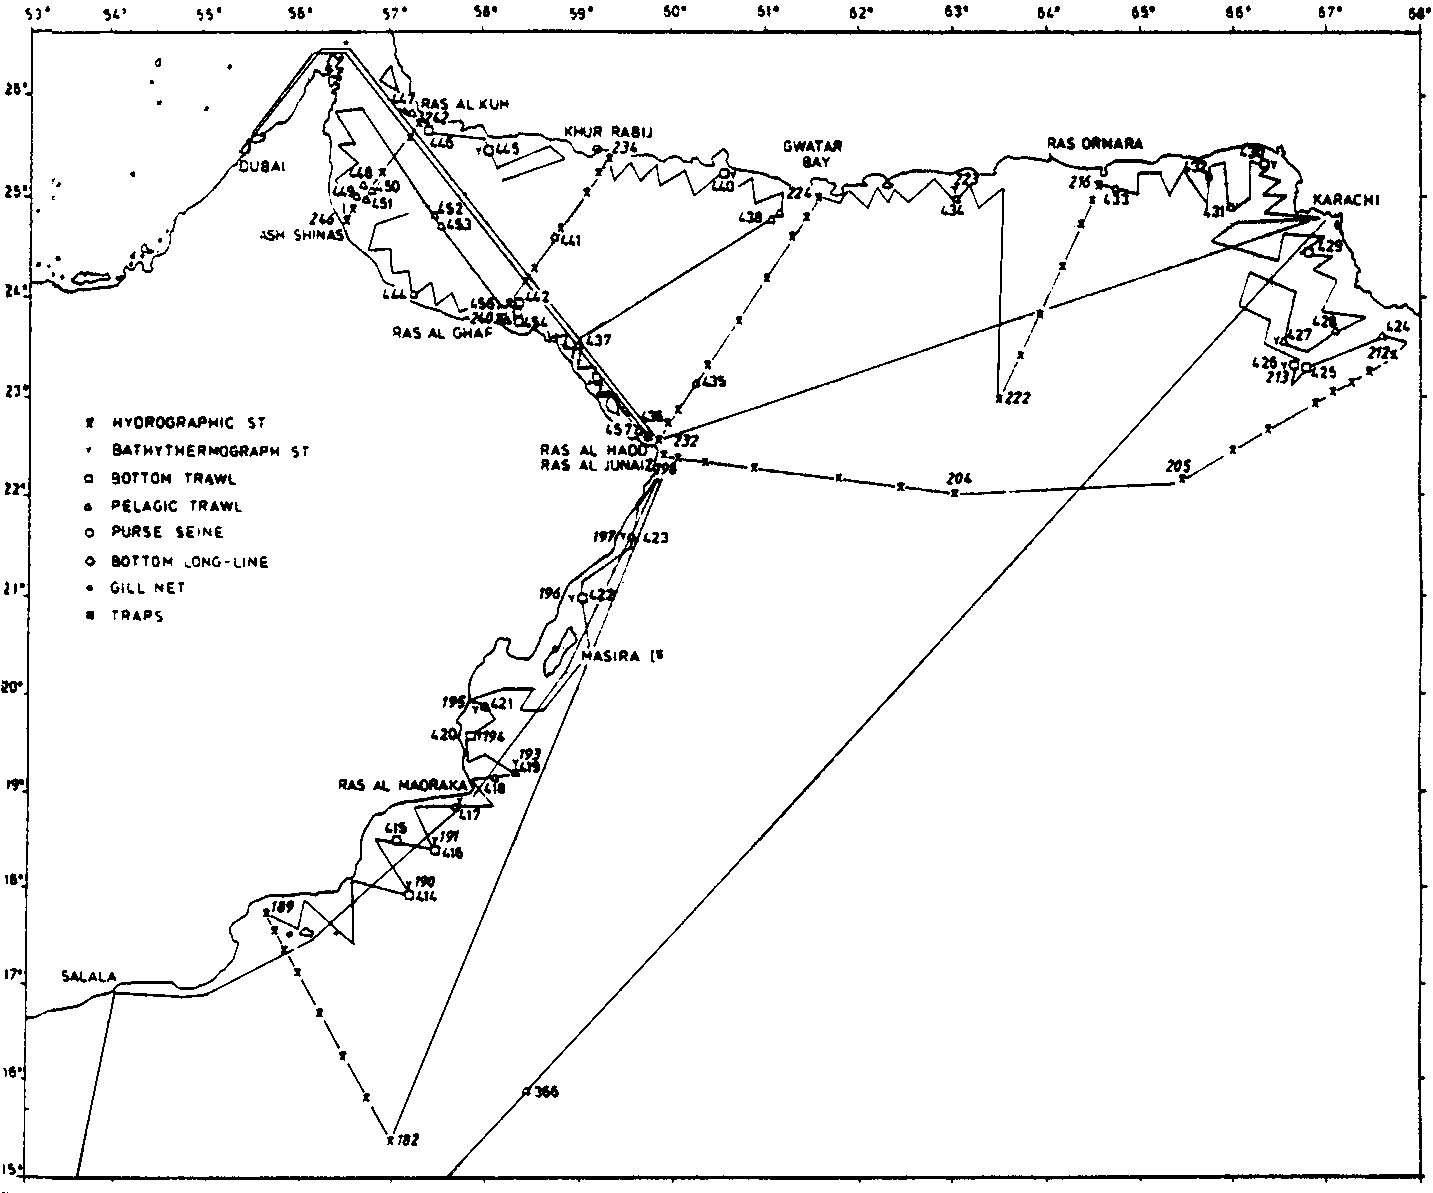
Figure 2b. Survey grid and stations
Cruise 1&2, Apr-Jun 1975, Oman Coast - Gulf of Oman - Pakistan
Coast.
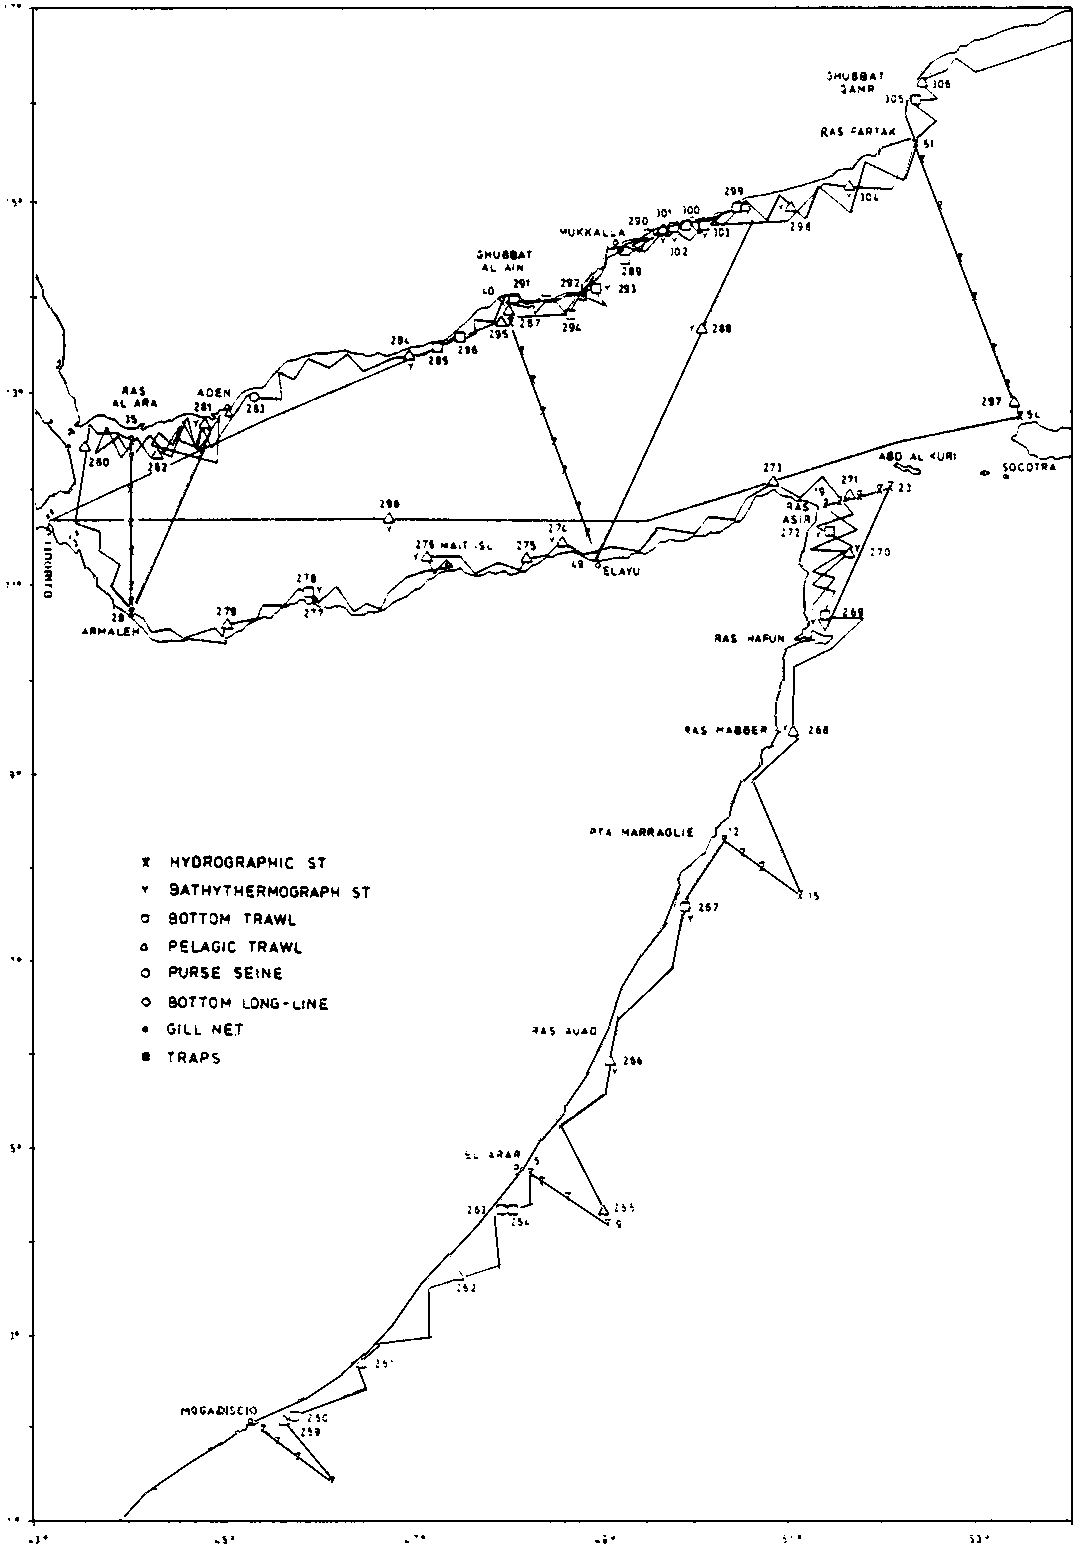
Figure 3a. Survey grid and stations
Cruise 3, Aug-Oct 1975, Somalia East Coast - Gulf of Aden.
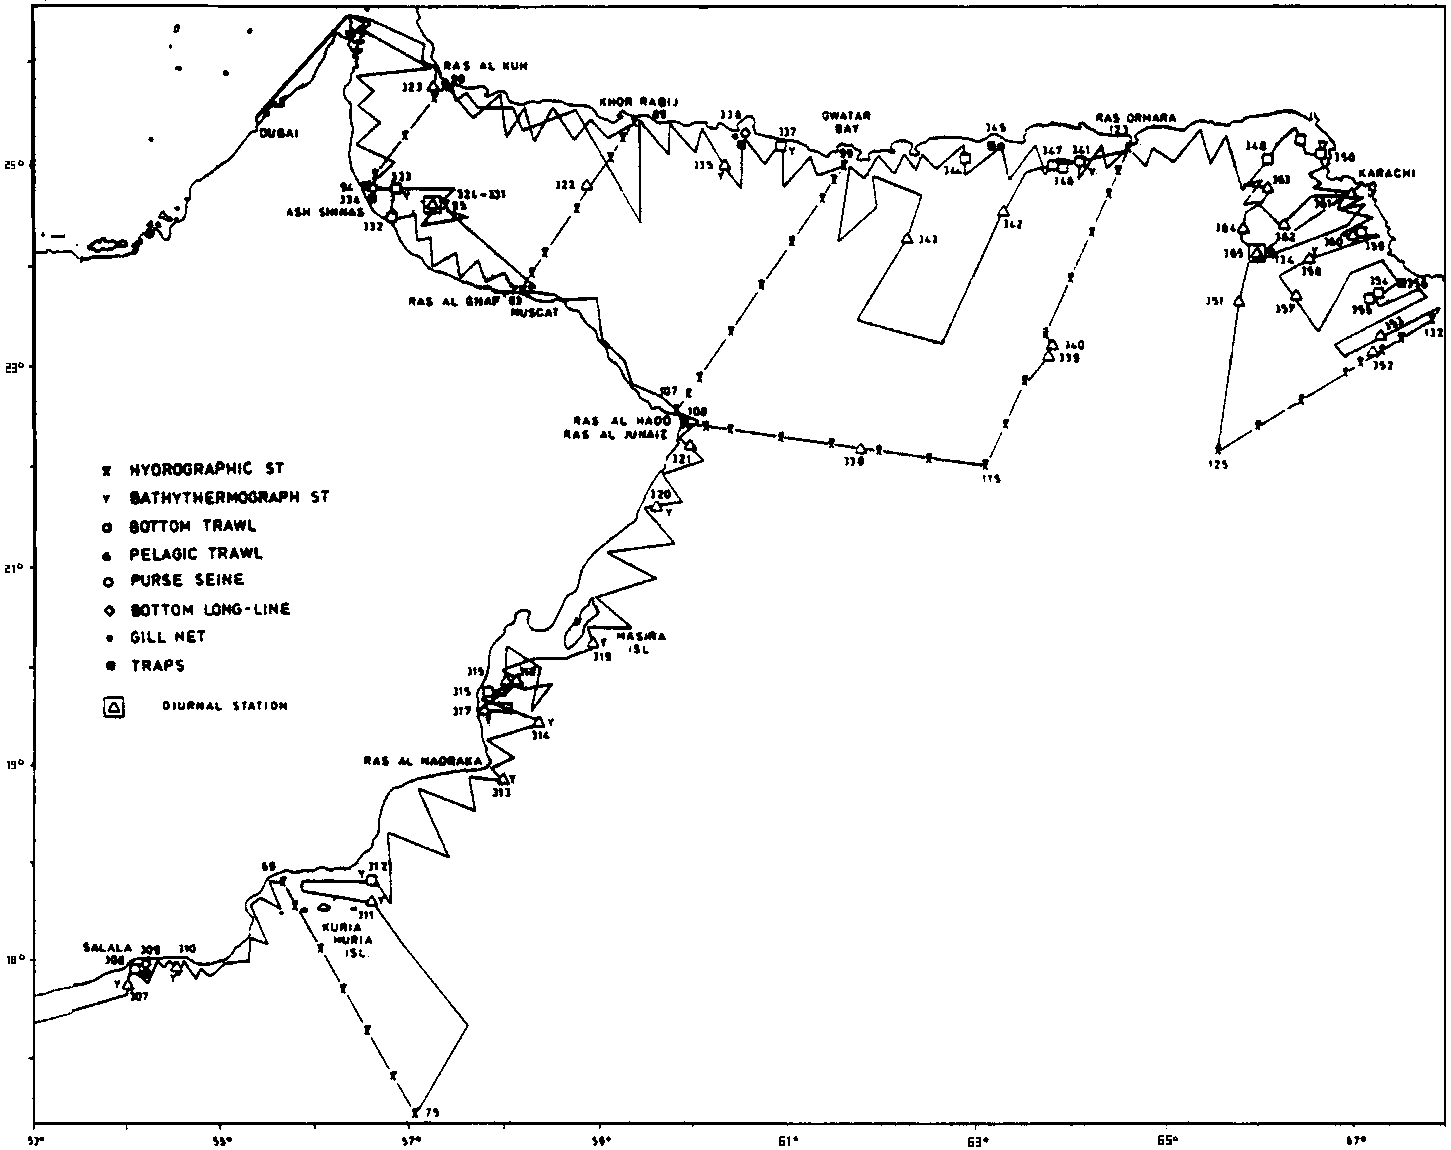
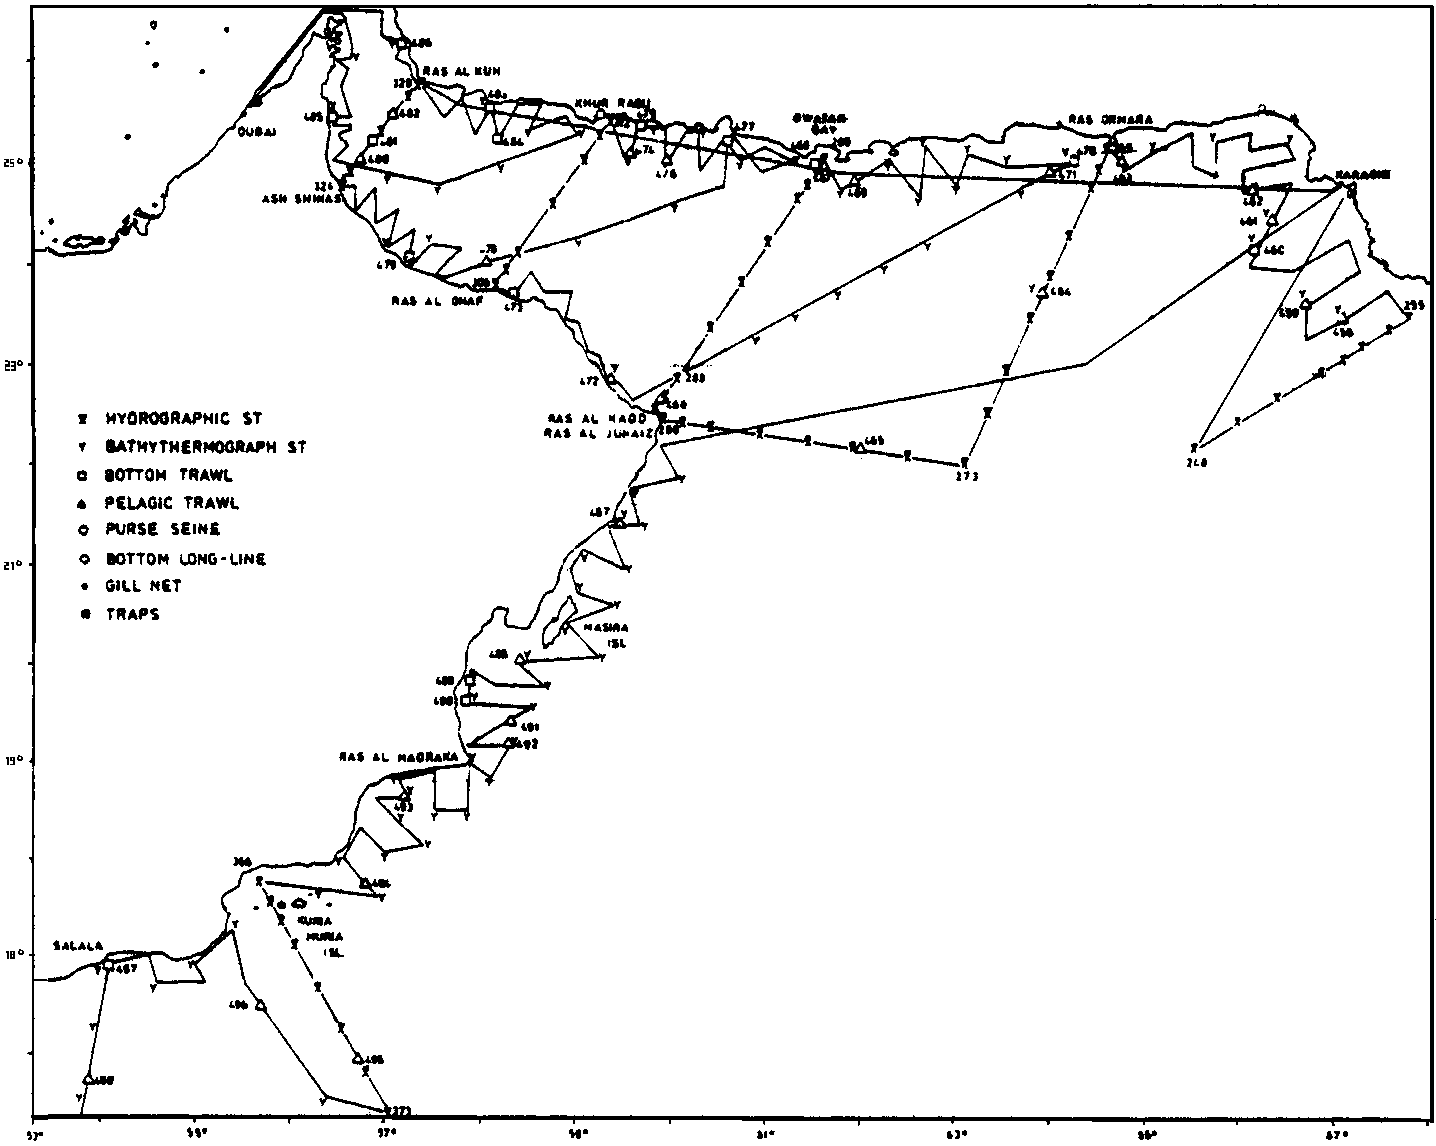
Figure 3b. Survey grid and stations
Cruise 3, Oct-Nov 1975, Oman Coast - Gulf of Oman - Pakistan Coast.
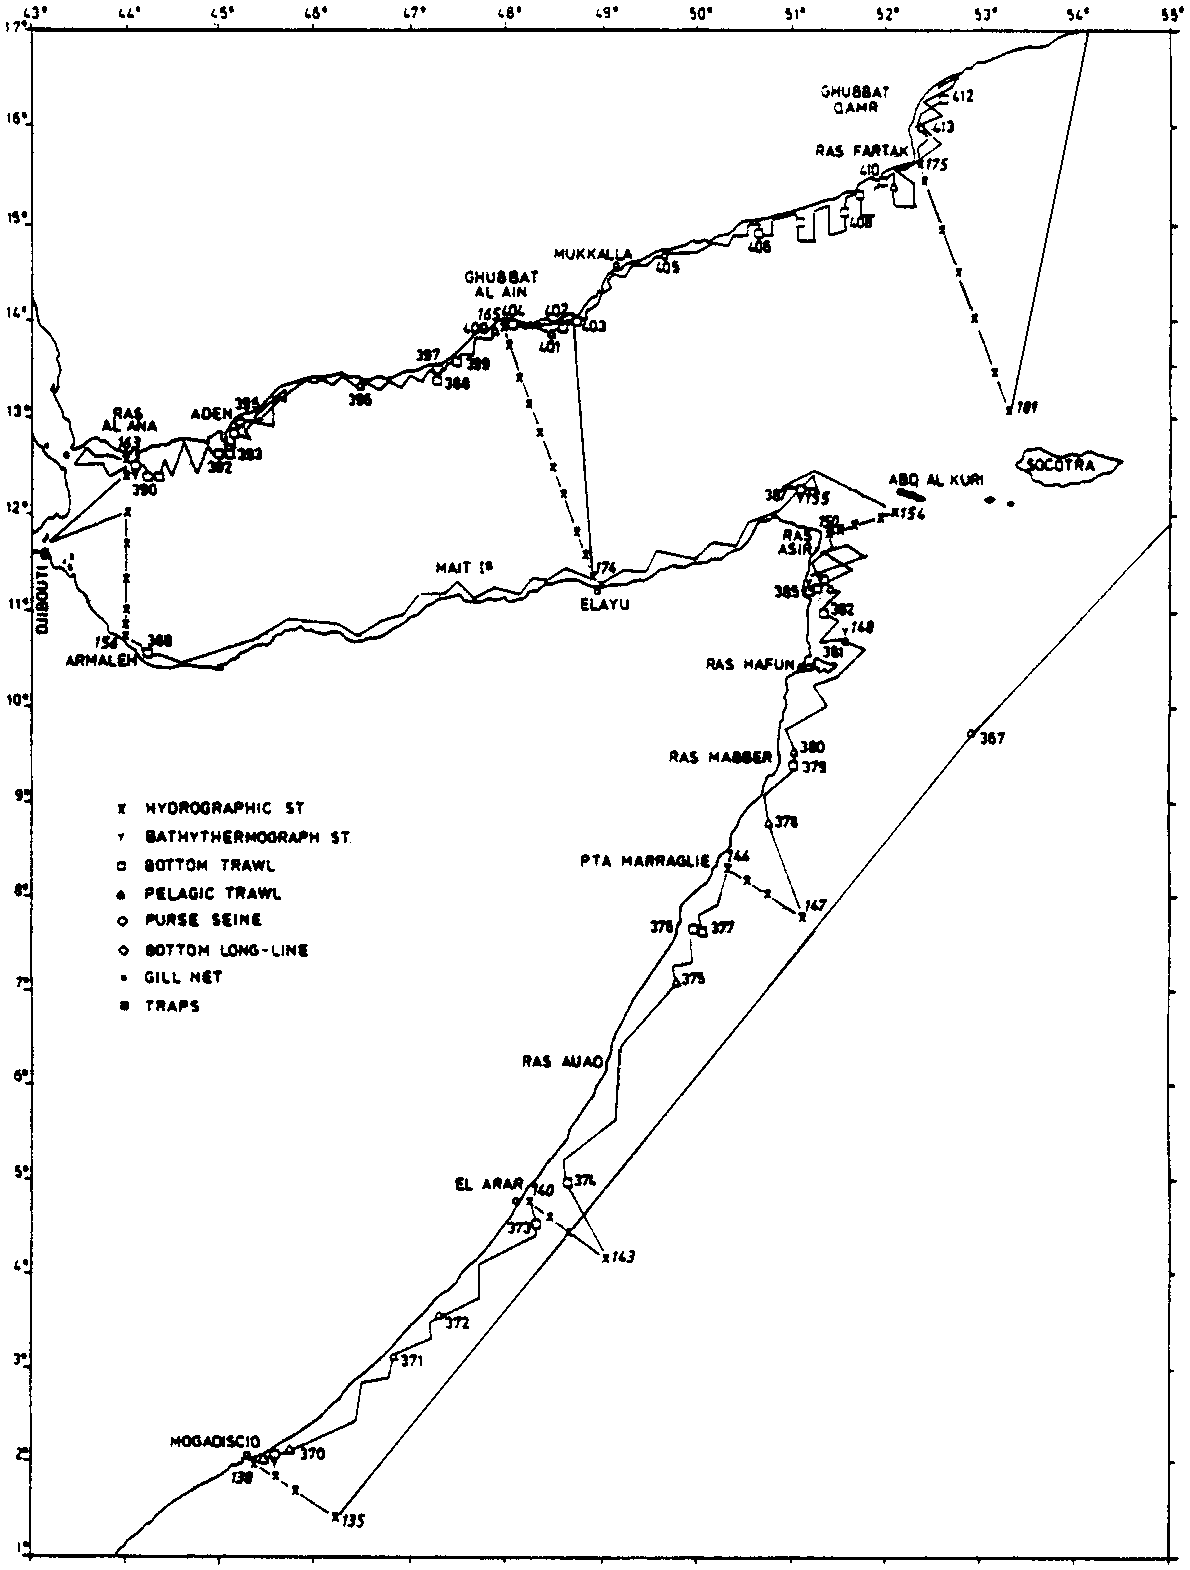
Figure 4a. Survey grid and stations
Cruise 4, Jan - Feb 1976, Somalia East Coast - Gulf of Aden.
Figure 4b. Survey grid and stations
Cruise 4, Feb-Mar 1976, Oman Coast -Gulf of Oman - Pakistan Coast.
Figure 5a. Survey grid and stations
Cruise 5, Apr-May 1976, Somalia East Coast - Gulf of Aden.
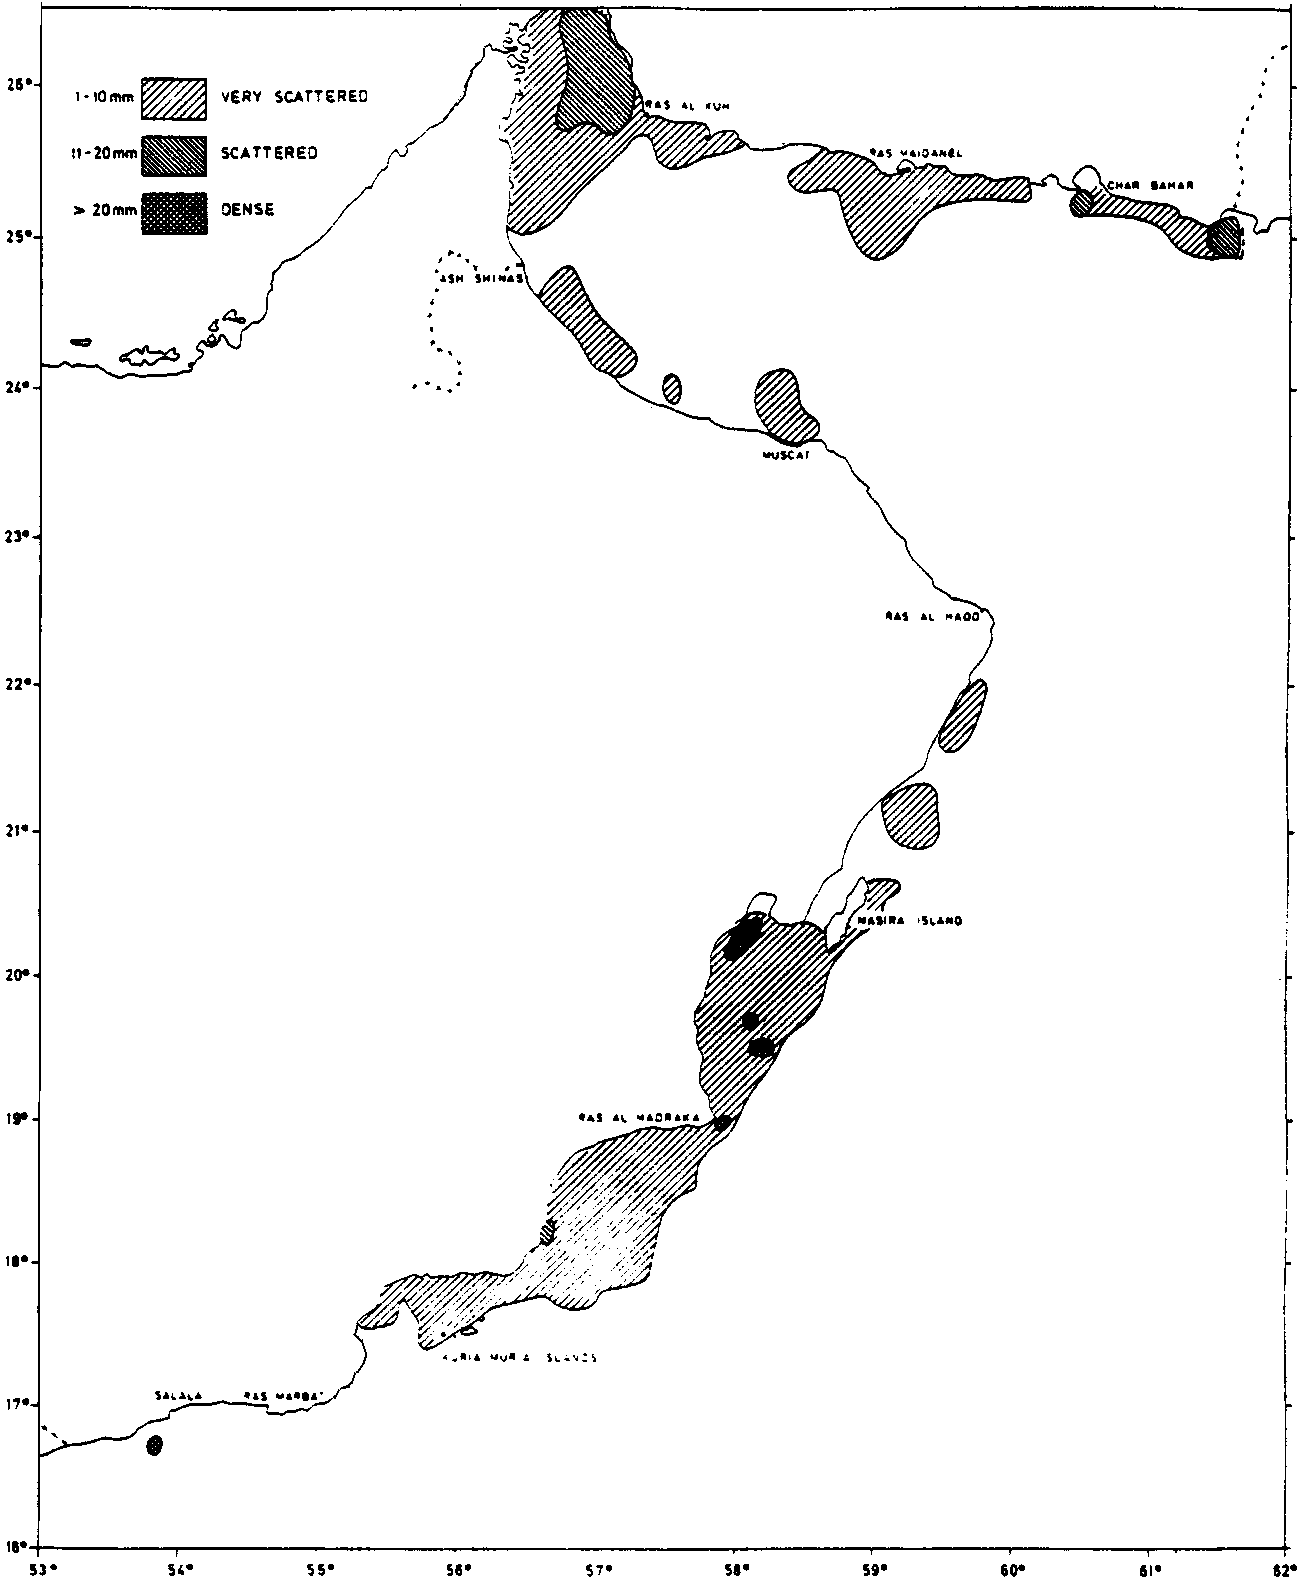
Figure 5b. Survey grid and stations
Cruise 5, Apr-Jun 1976, Oman Coast - Gulf of Oman - Pakistan Coast.
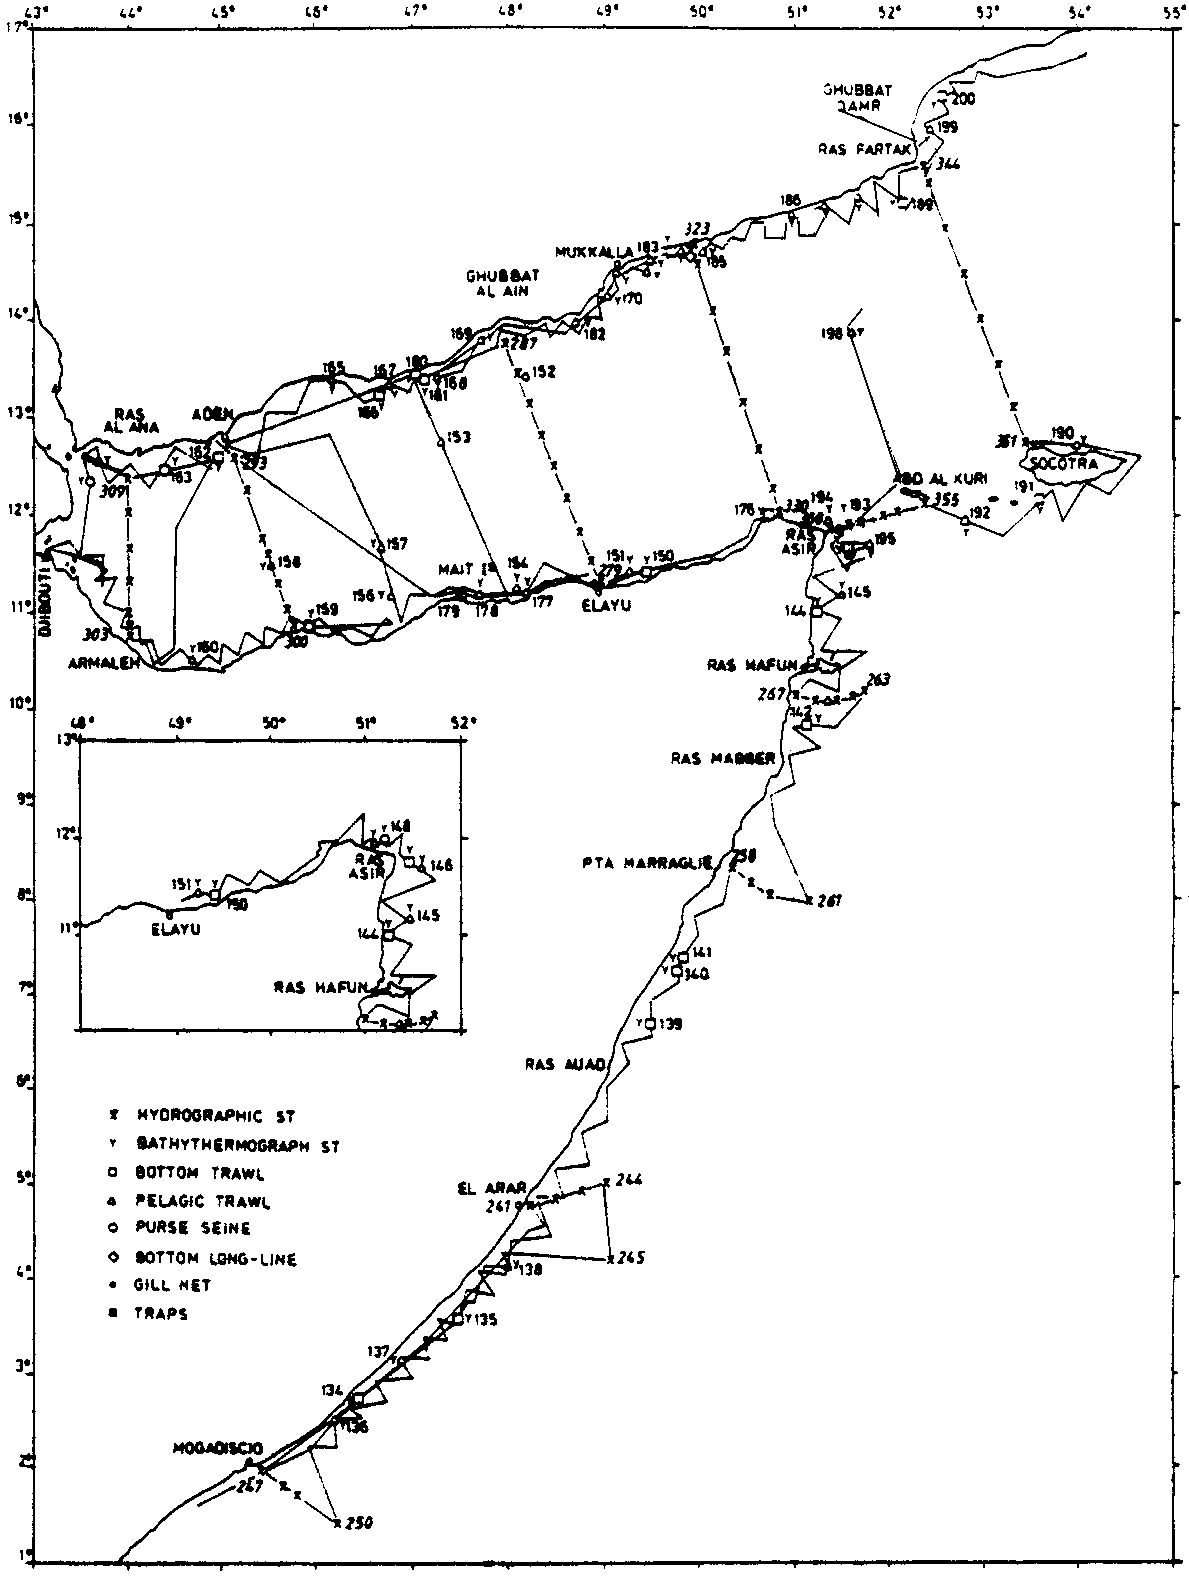
Figure 6a. Survey grid and stations
Cruise 6, Sep-Nov 1976, Somalia East Coast - Gulf of Aden.
Figure 6b. Survey grid and stations
Cruise 6, Aug-Sep 1976, Oman Coast - Gulf of Oman - Pakistan Coast.
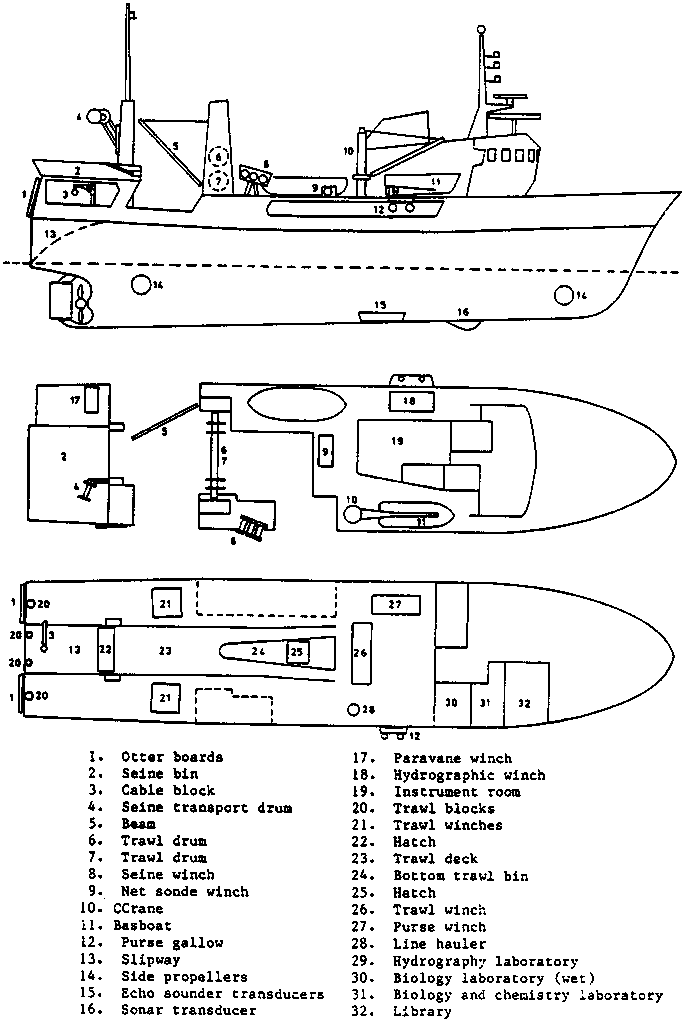
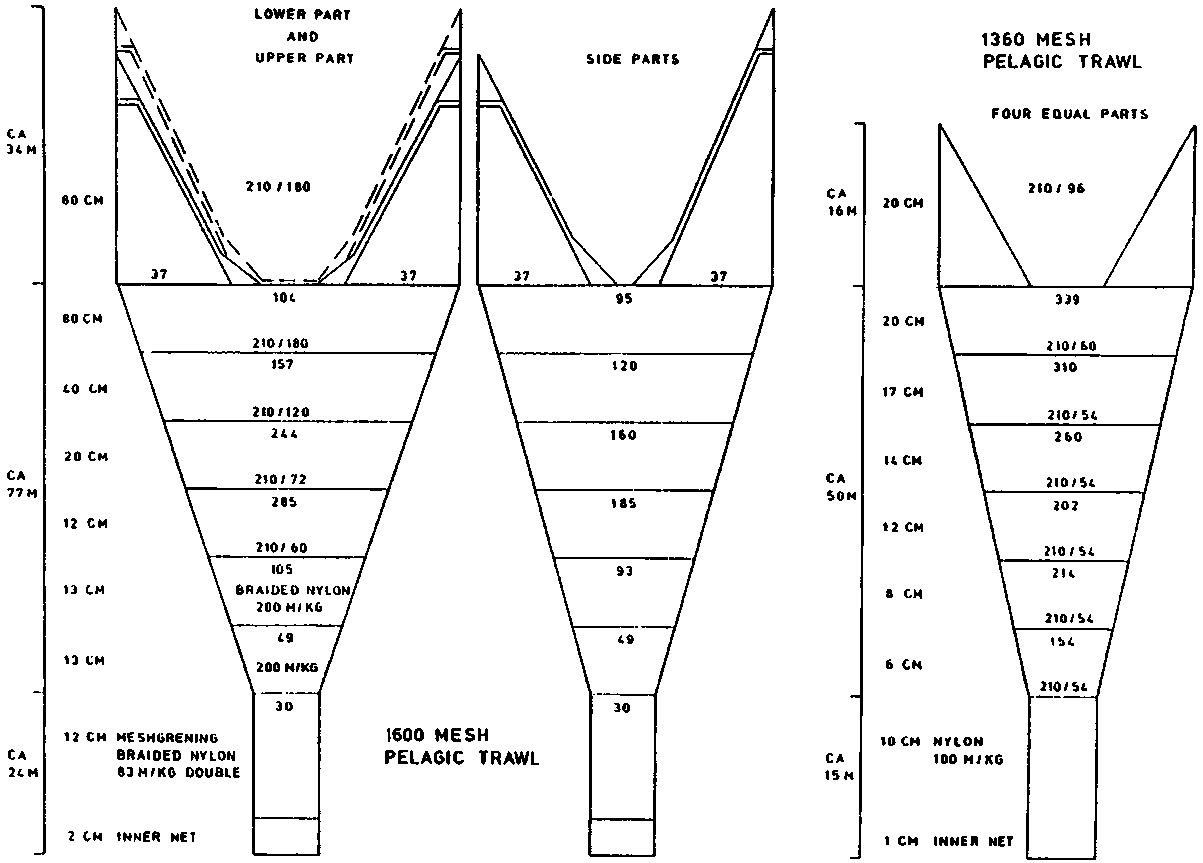
Figure 8. The pelagic trawls
onboard R/V "Dr. Fridtjof Nansen".
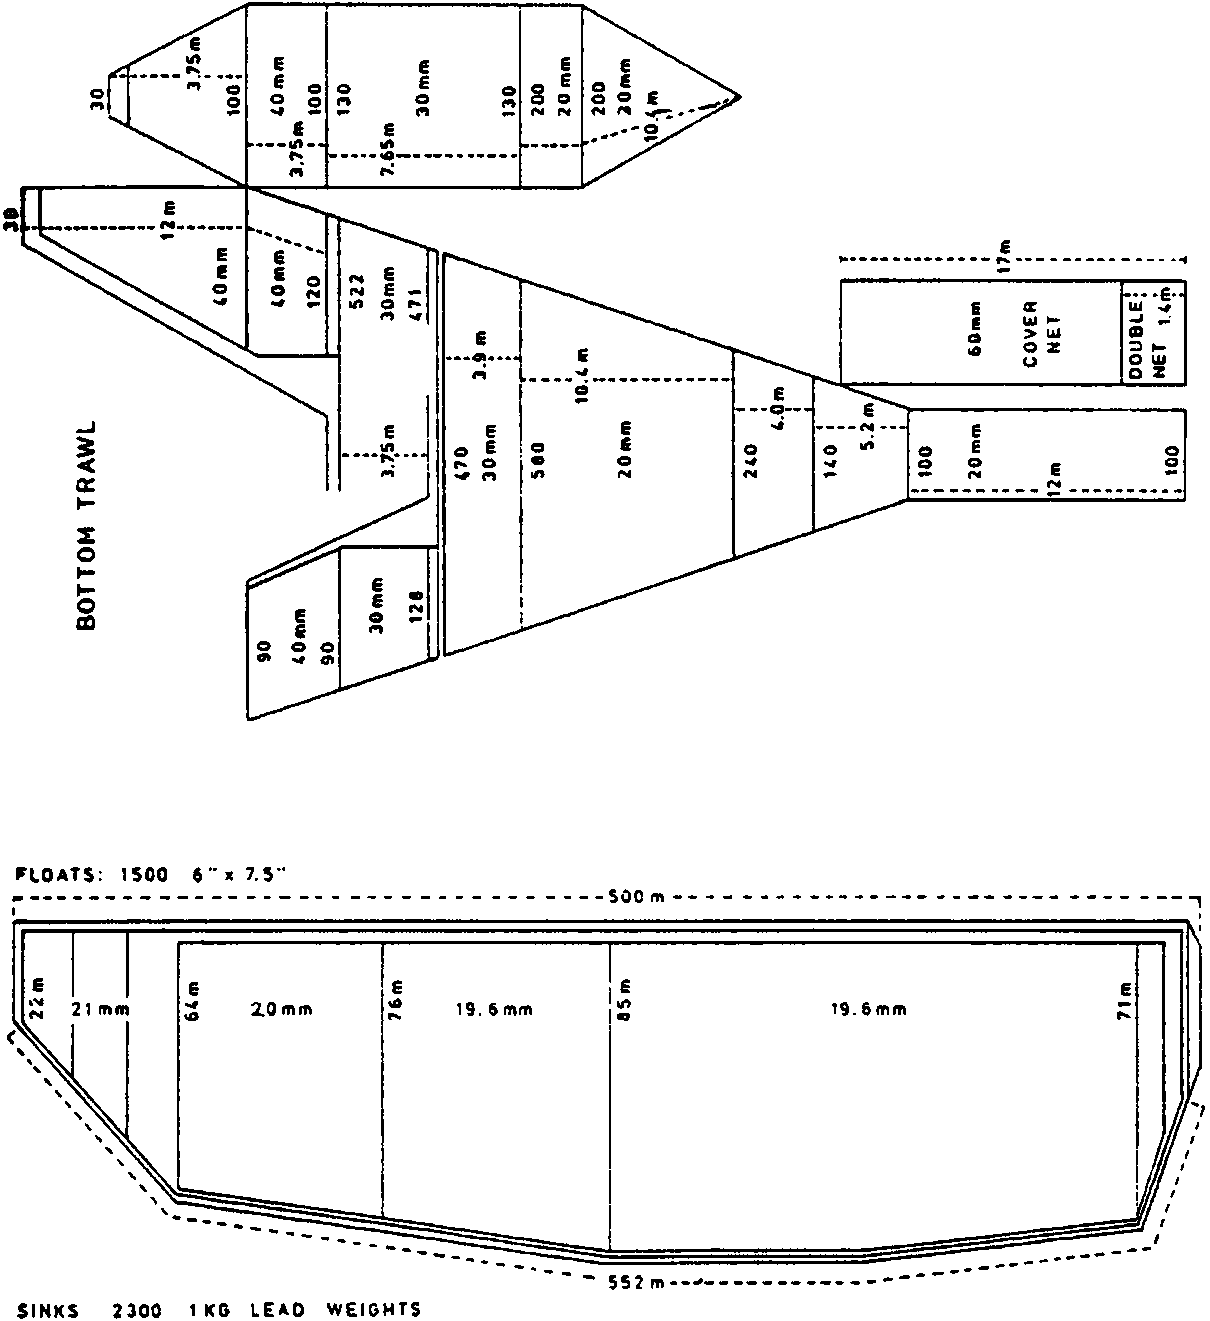
Figure 9. The bottom trawl and
purse seine onboard R/V "Dr. Fridtjof Nansen".
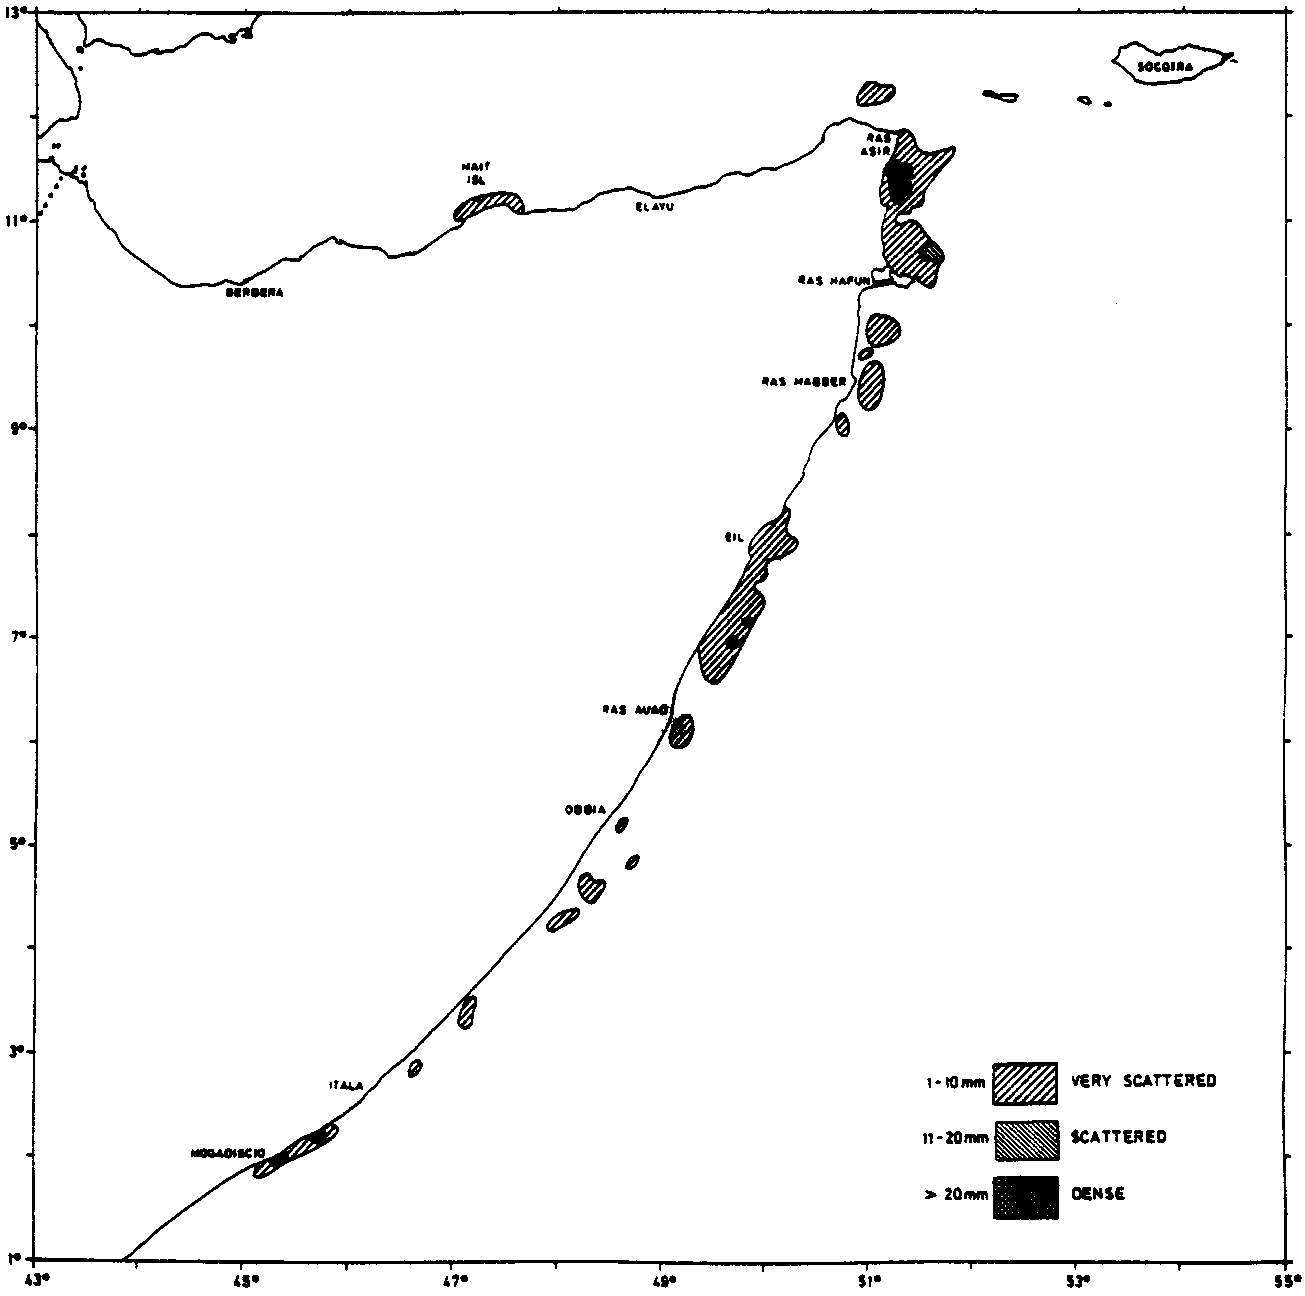
Figure 10 Distribution of demersal
and pelagic fish on the Somalia Coast and the Socotra Shelf during Cruise
1&2, Feb-Mar 1975.
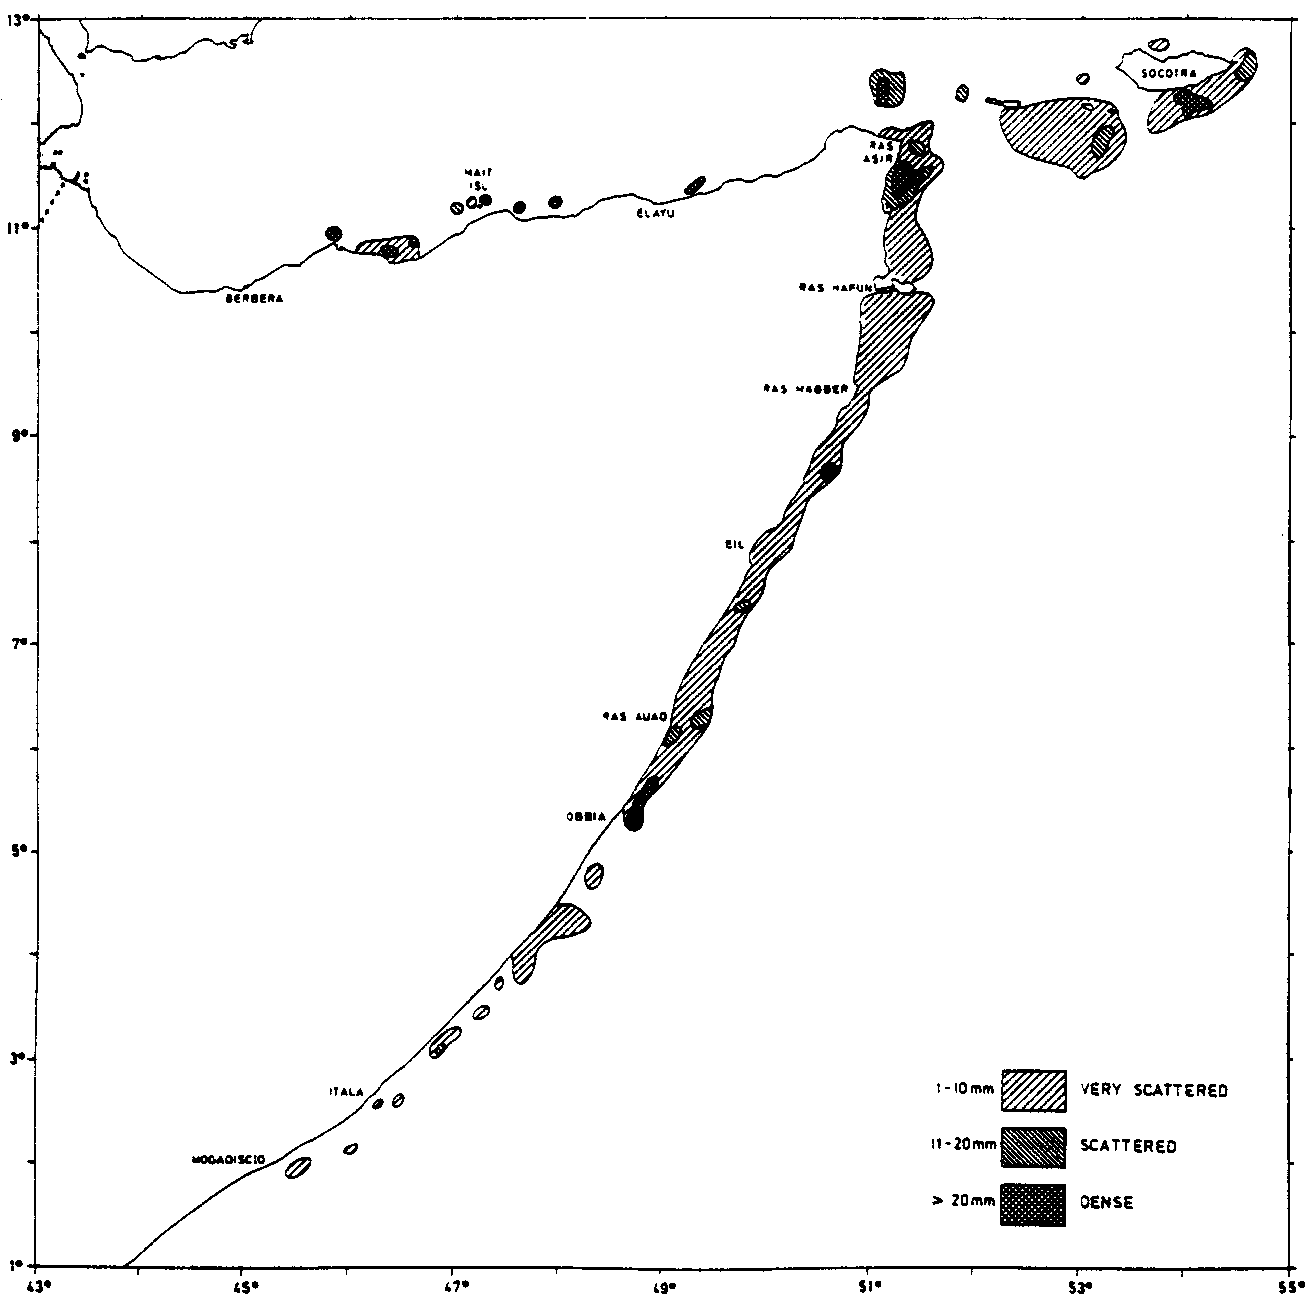
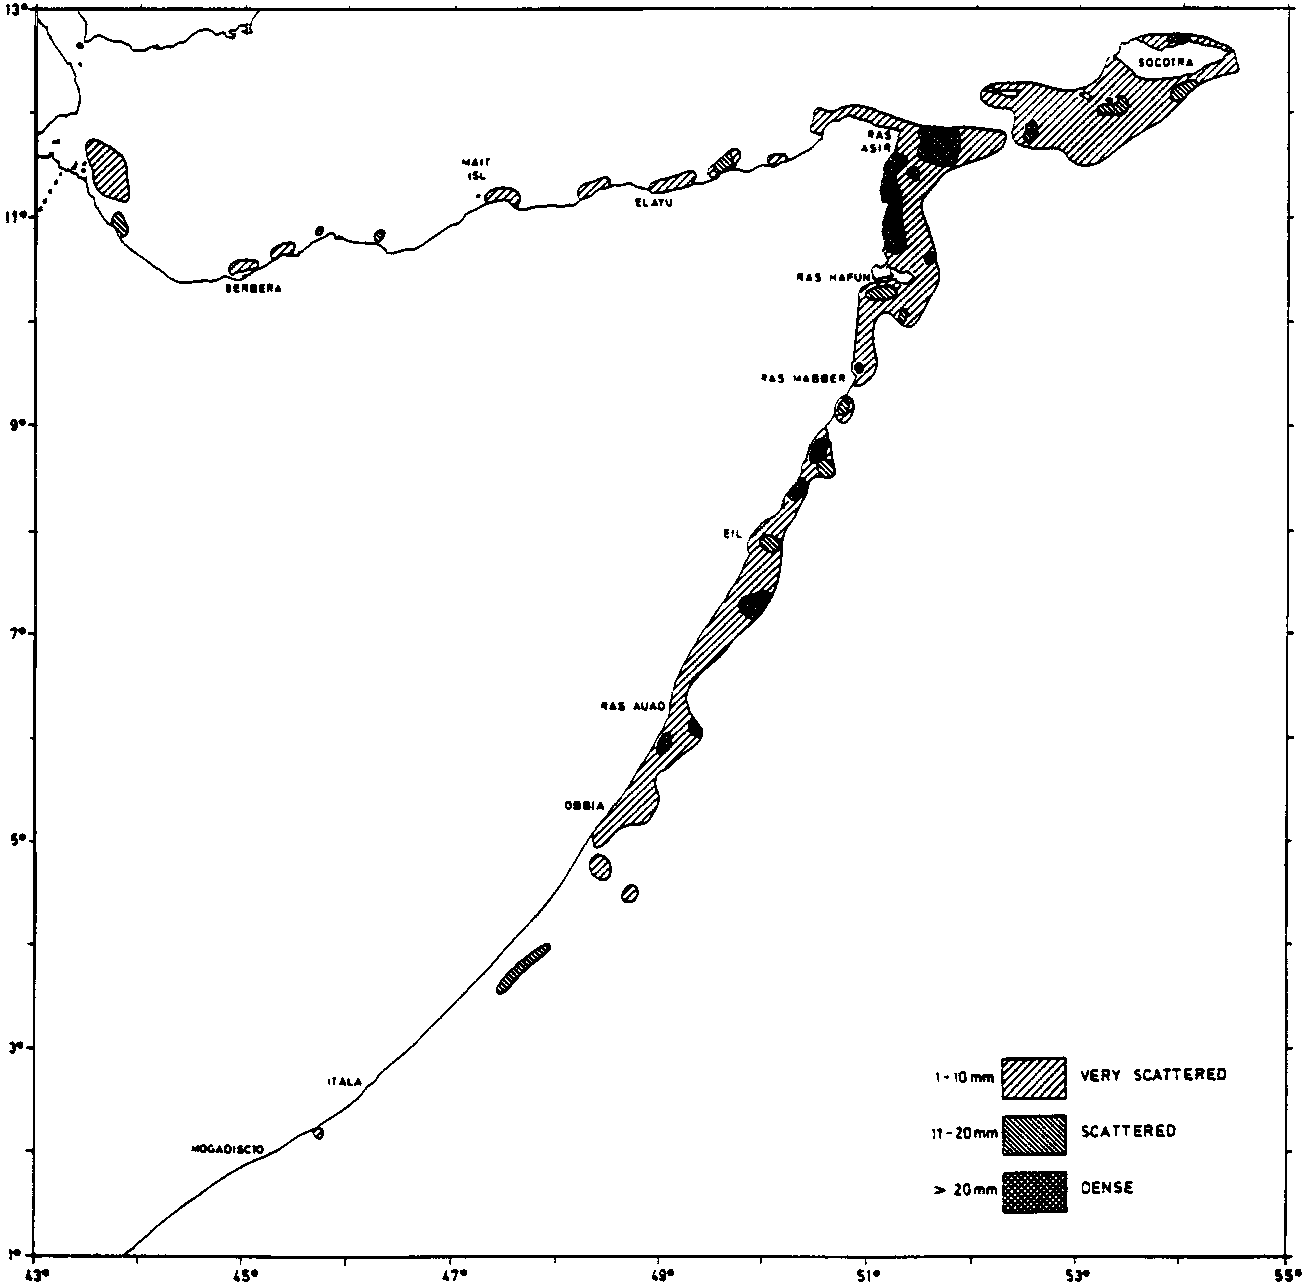
Figure 11. Distribution of demersal
and pelagic fish on the Somalia Coast and the Socotra Shelf during Cruise 3,
Aug-Oct 1975.
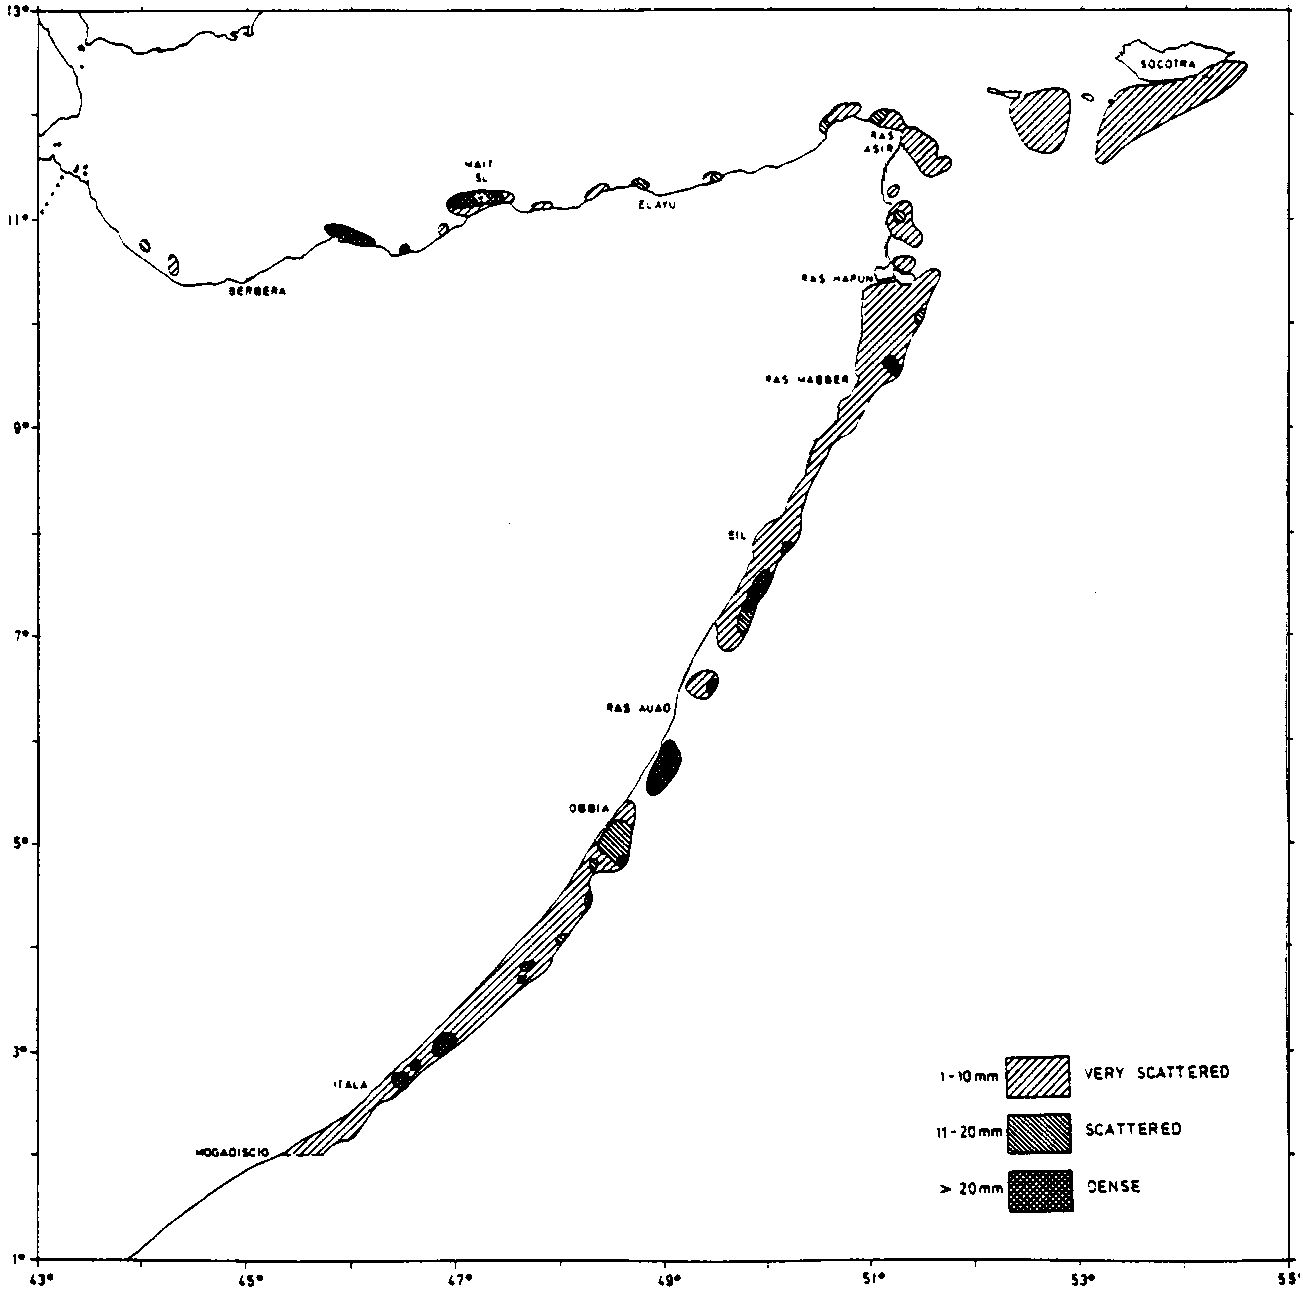
Figure 12. Distribution of demersal
and pelagic fish on the Somalia Coast during Cruise 4, Jan-Feb 1976.
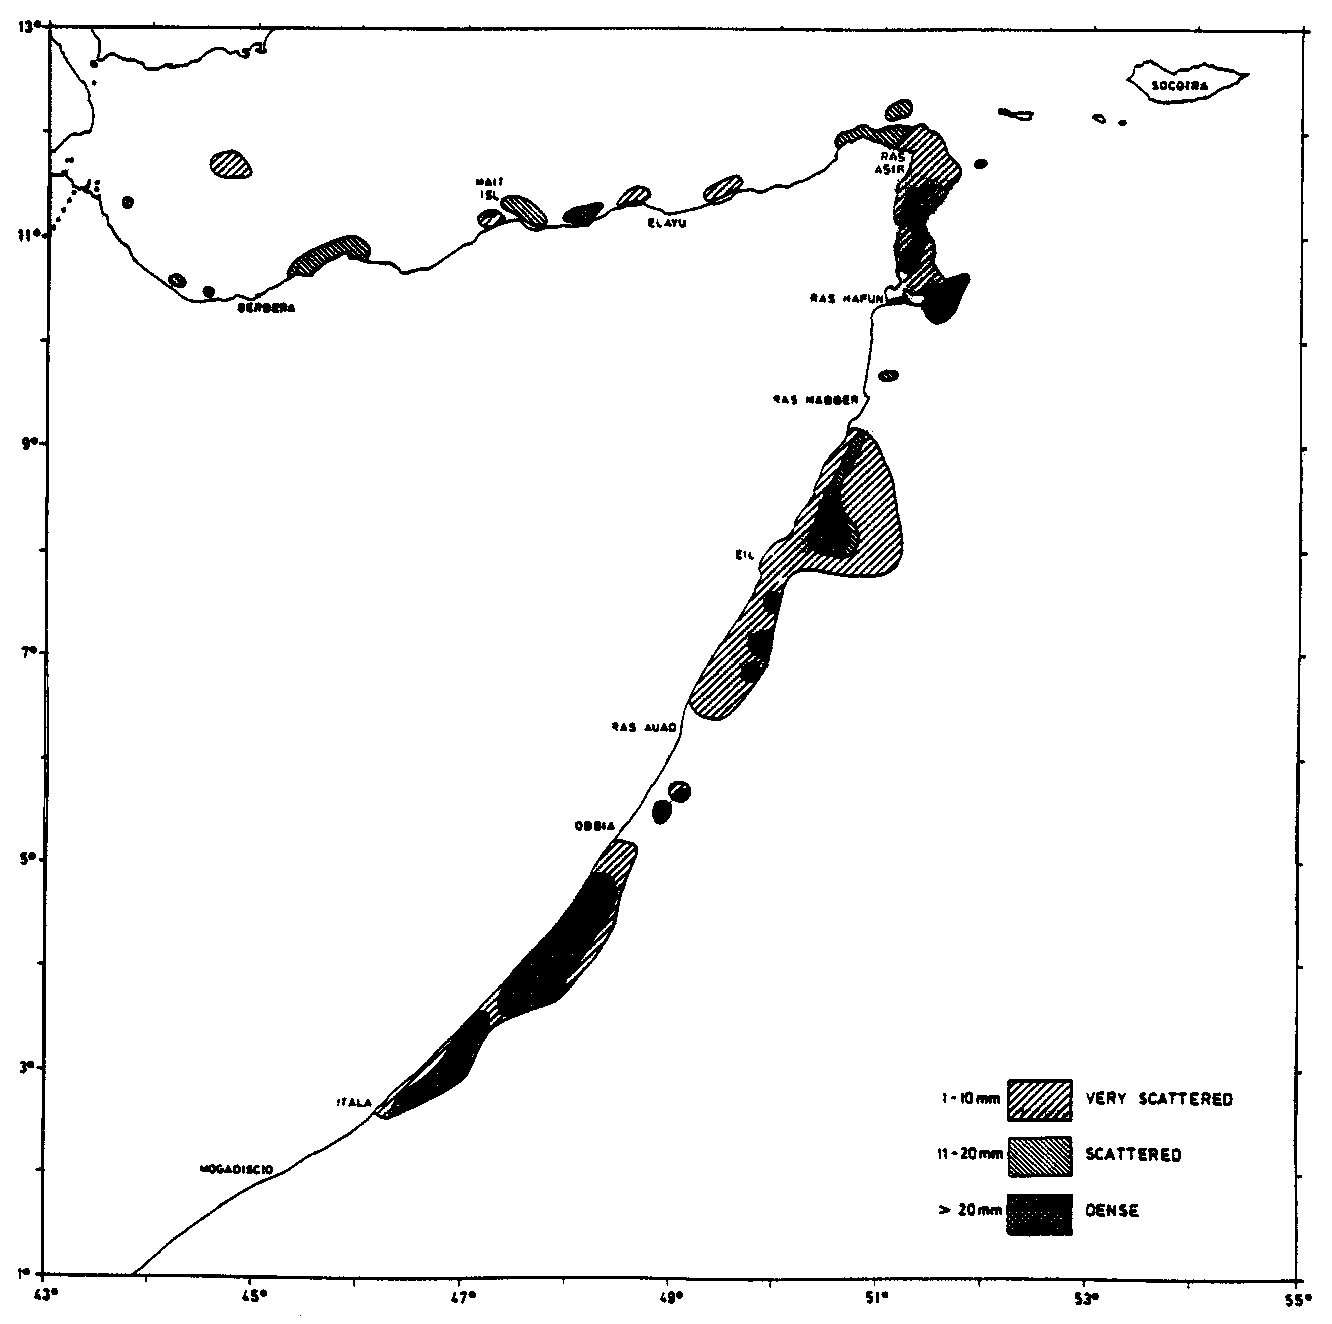
Figure 13. Distribution of demersal
and pelagic fish on the Somalia Coast during Cruise 5, Apr 1976.
Figure 14. Distribution of demersal
and pelagic fish on the Somalia Coast and the Socotra Shelf during Cruise 6,
Oct-Nov 1976.
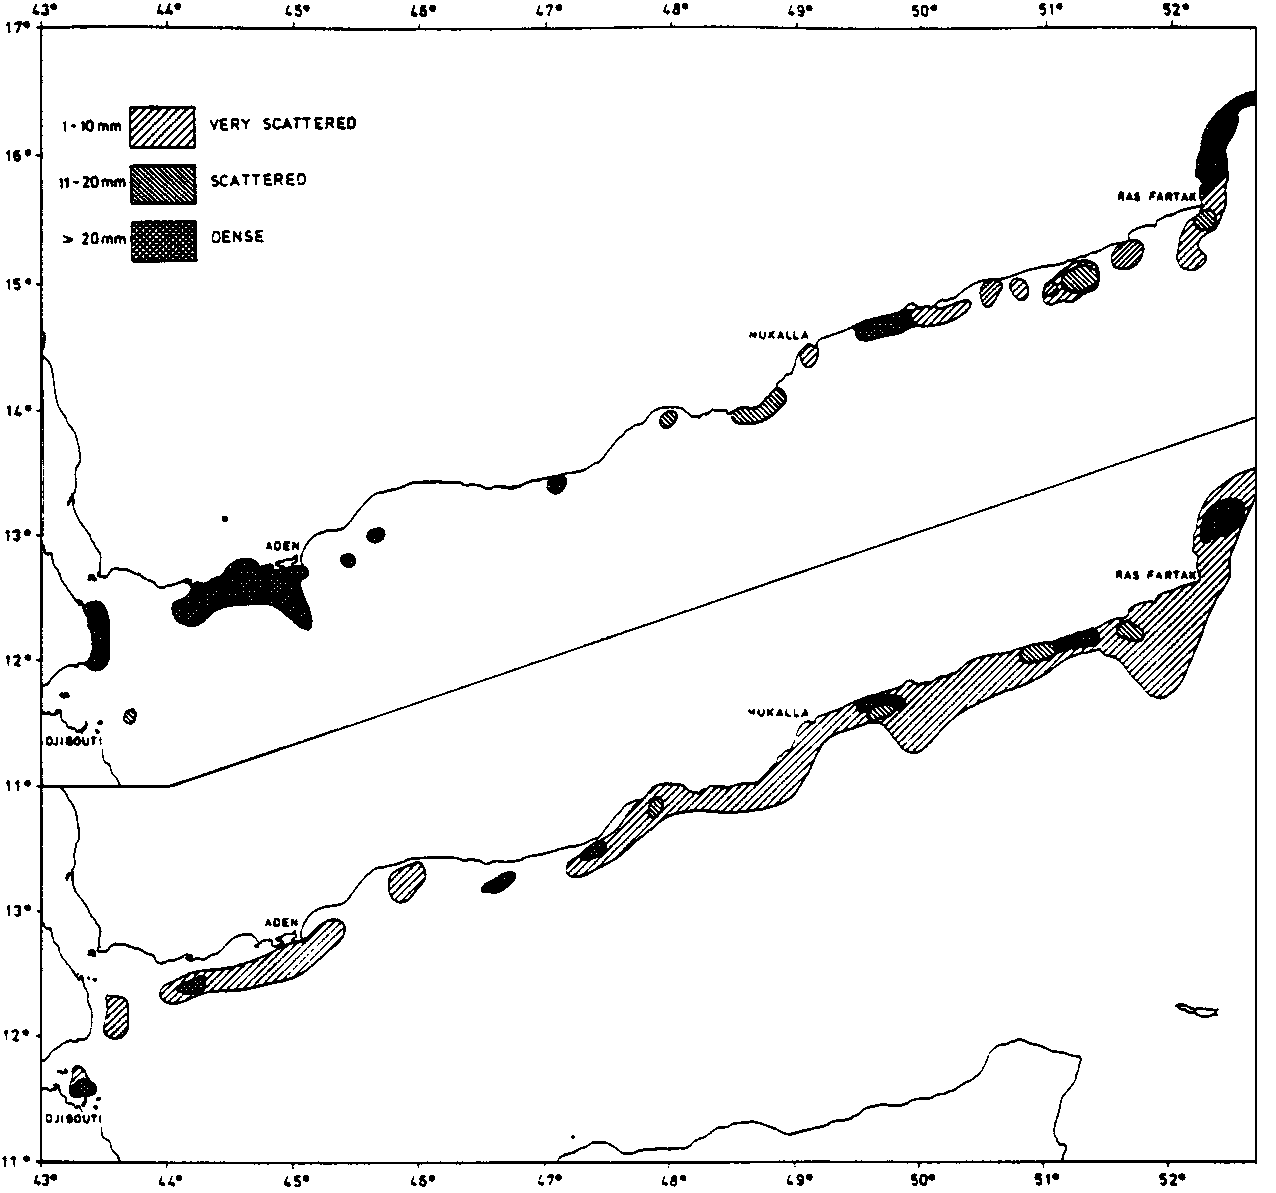
Figure 15. Distribution of demersal
and pelagic fish on the South-Yemen Coast during Cruise 1&2, Mar-Apr 1975
(upper), and during Cruise 3, Sep-Oct 1975 (lower).
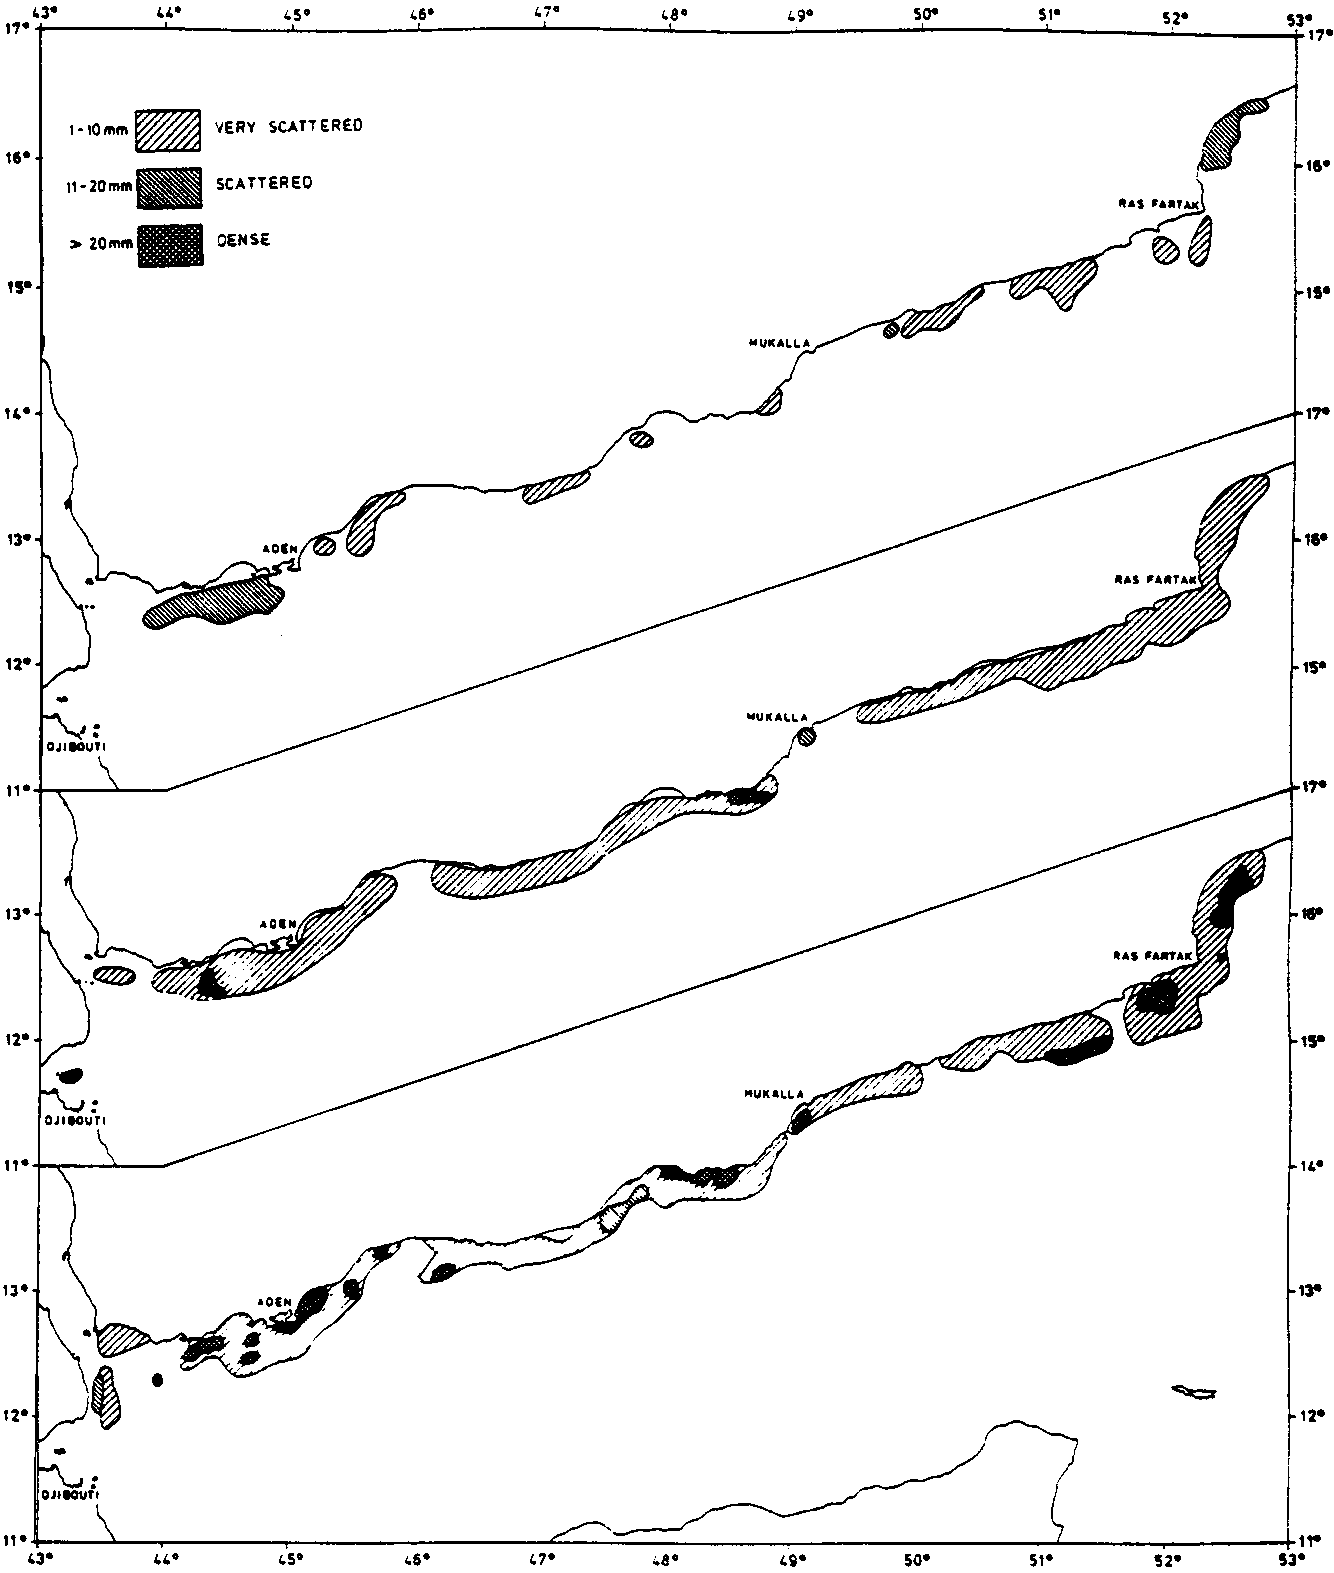
Figure 16. Distribution of demersal
and pelagic fish on the South-Yemen Coast during Cruise 4, Jan-Feb 1976 (upper),
during Cruise 5, Apr-May 1976 (middle), and during Cruise 6, Sep-Oct 1976
(lower).
Figure 17. Distribution of demersal
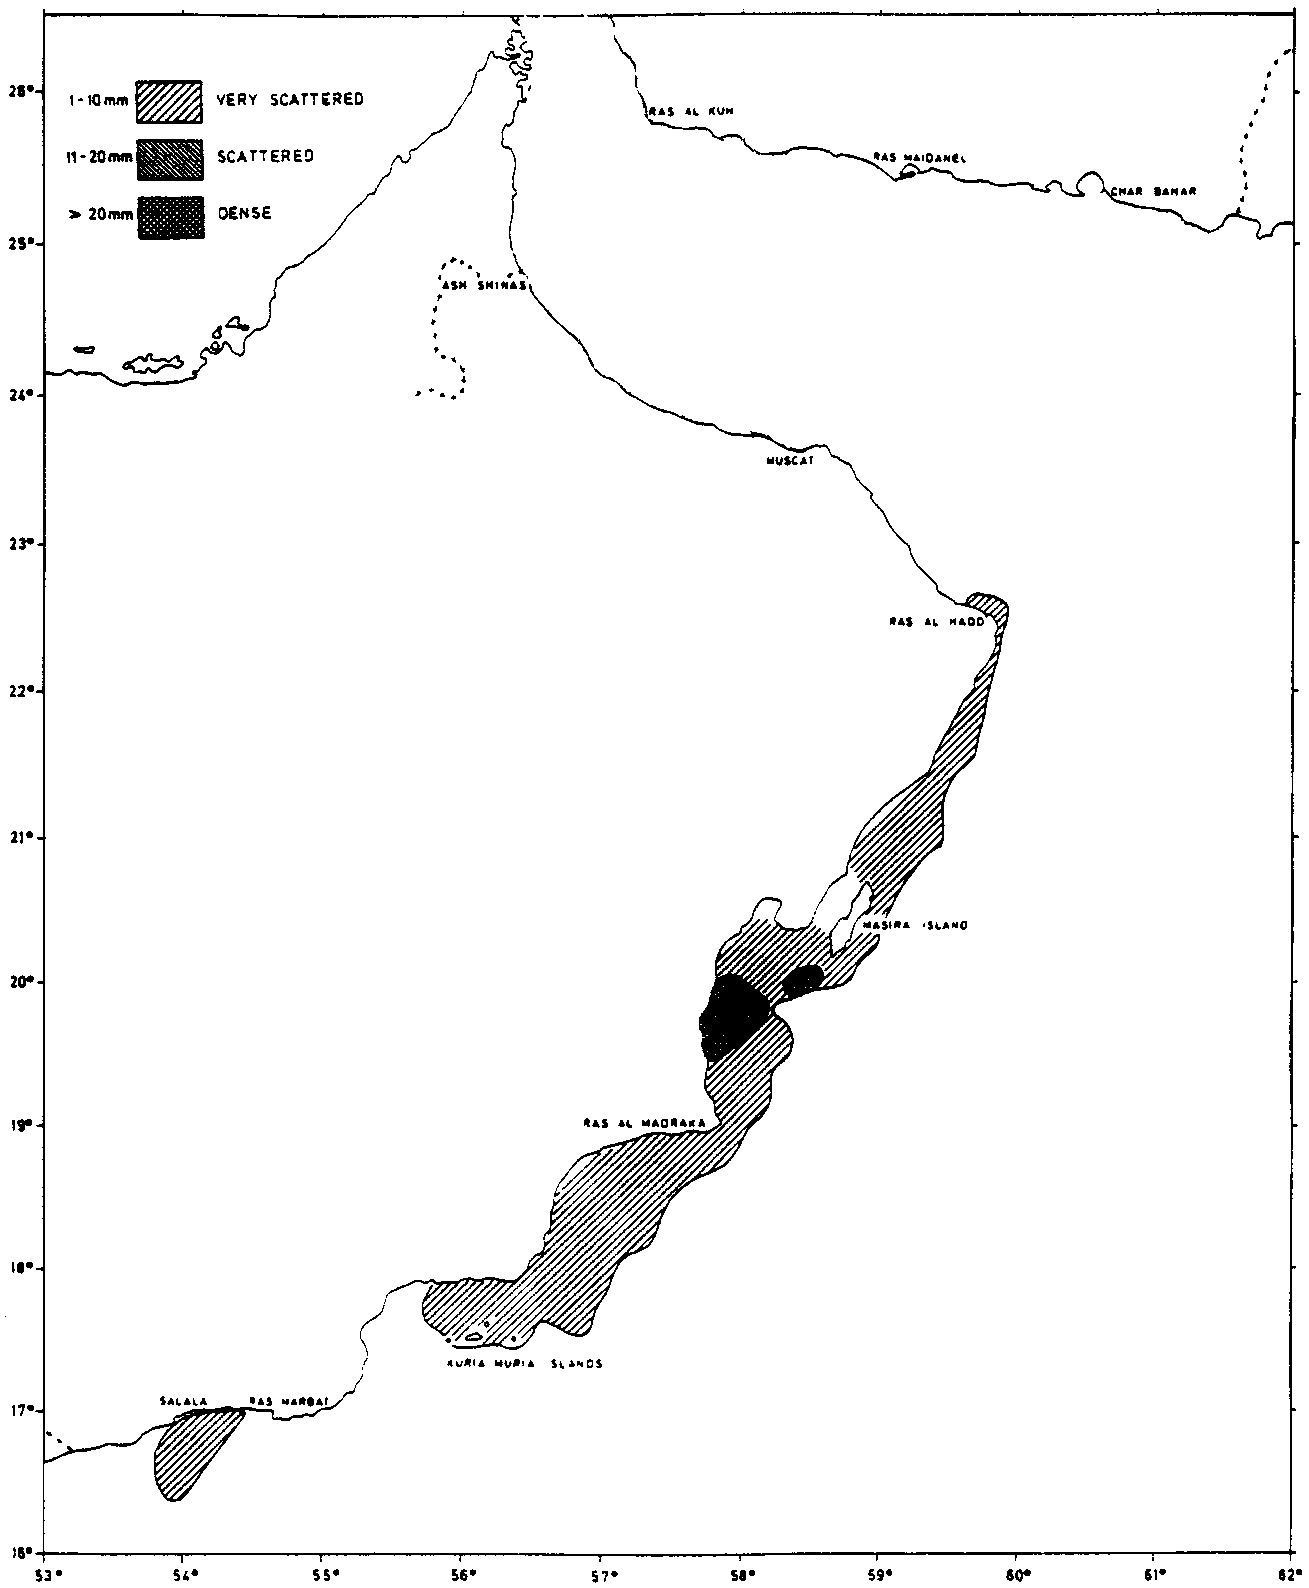
and pelagic fish on the Oman Coast and the South-Iran Coast during Cruise
1&2, Apr-Jun 1975.
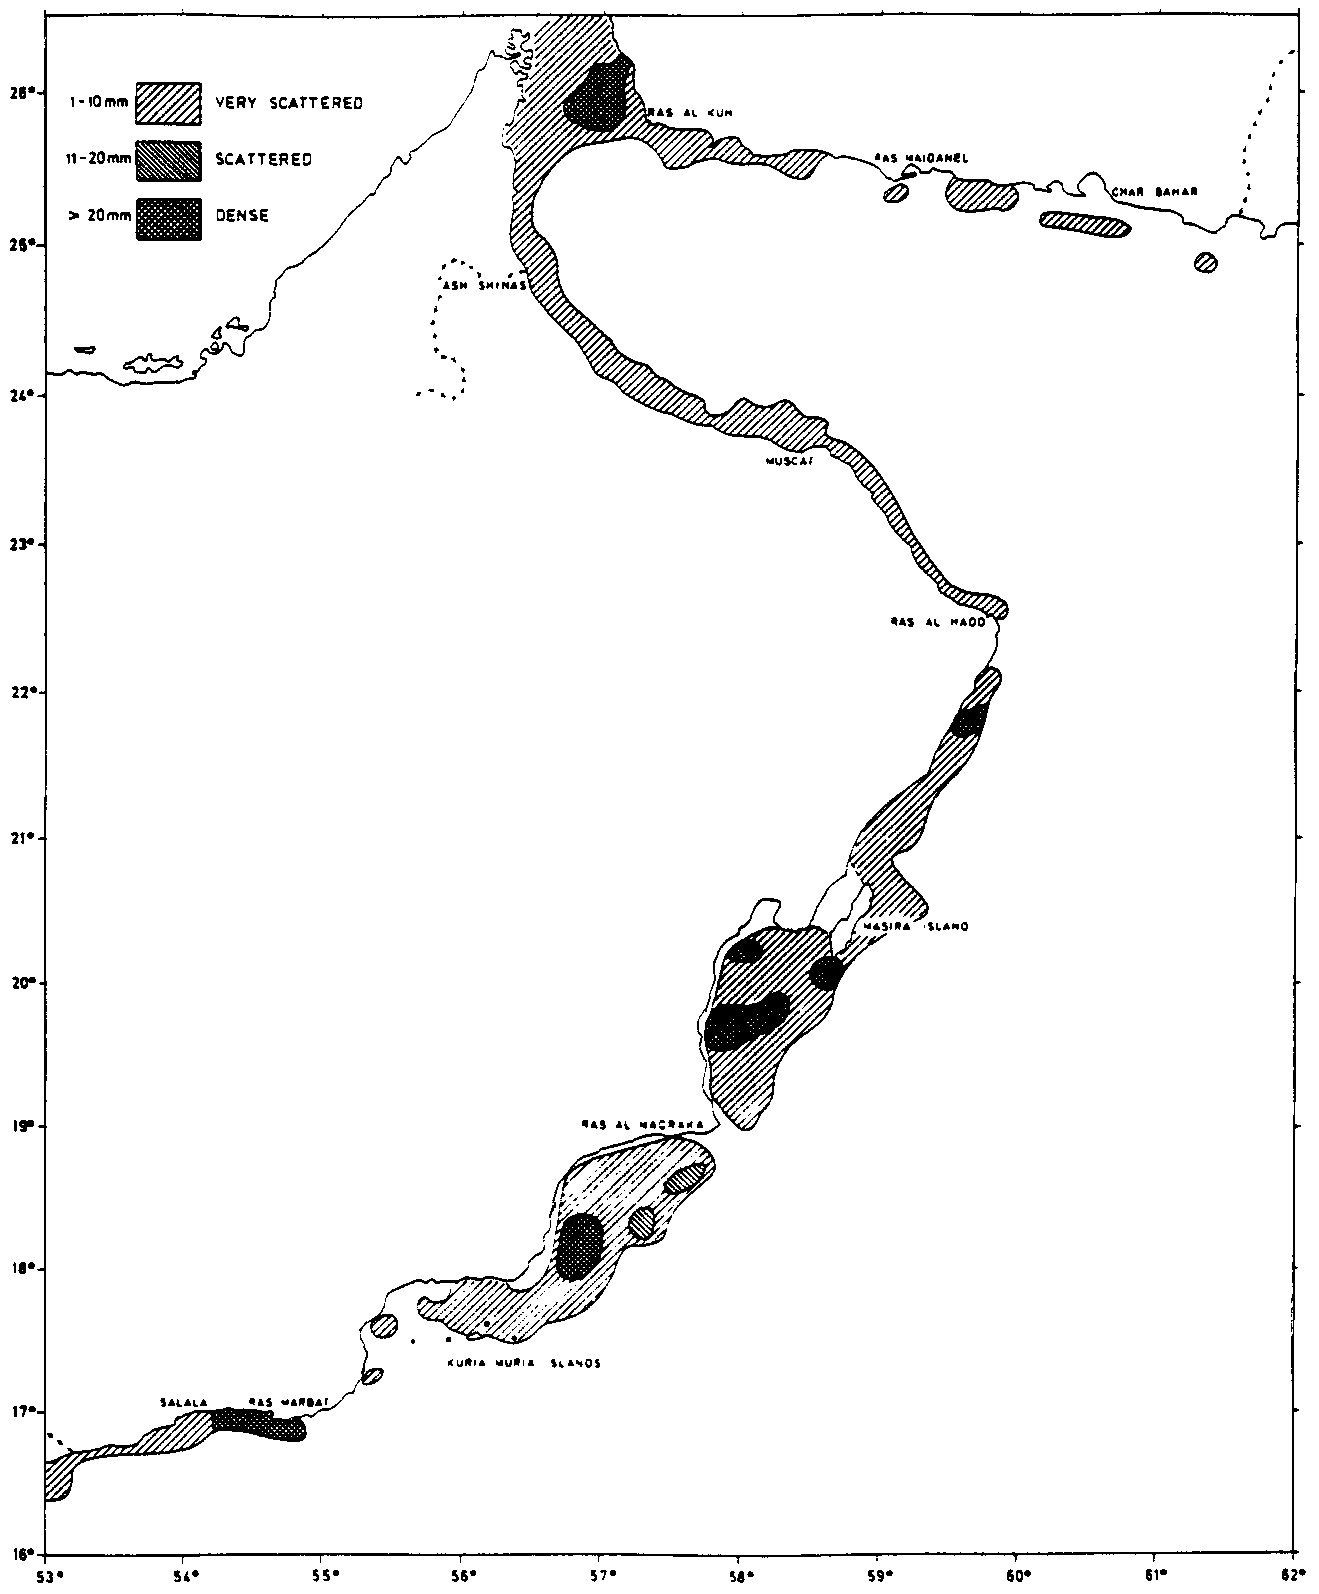
Figure 18. Distribution of demersal
and pelagic fish on the Oman Coast and the South-Iran Coast during Cruise 3,
Oct-Nov 1975.
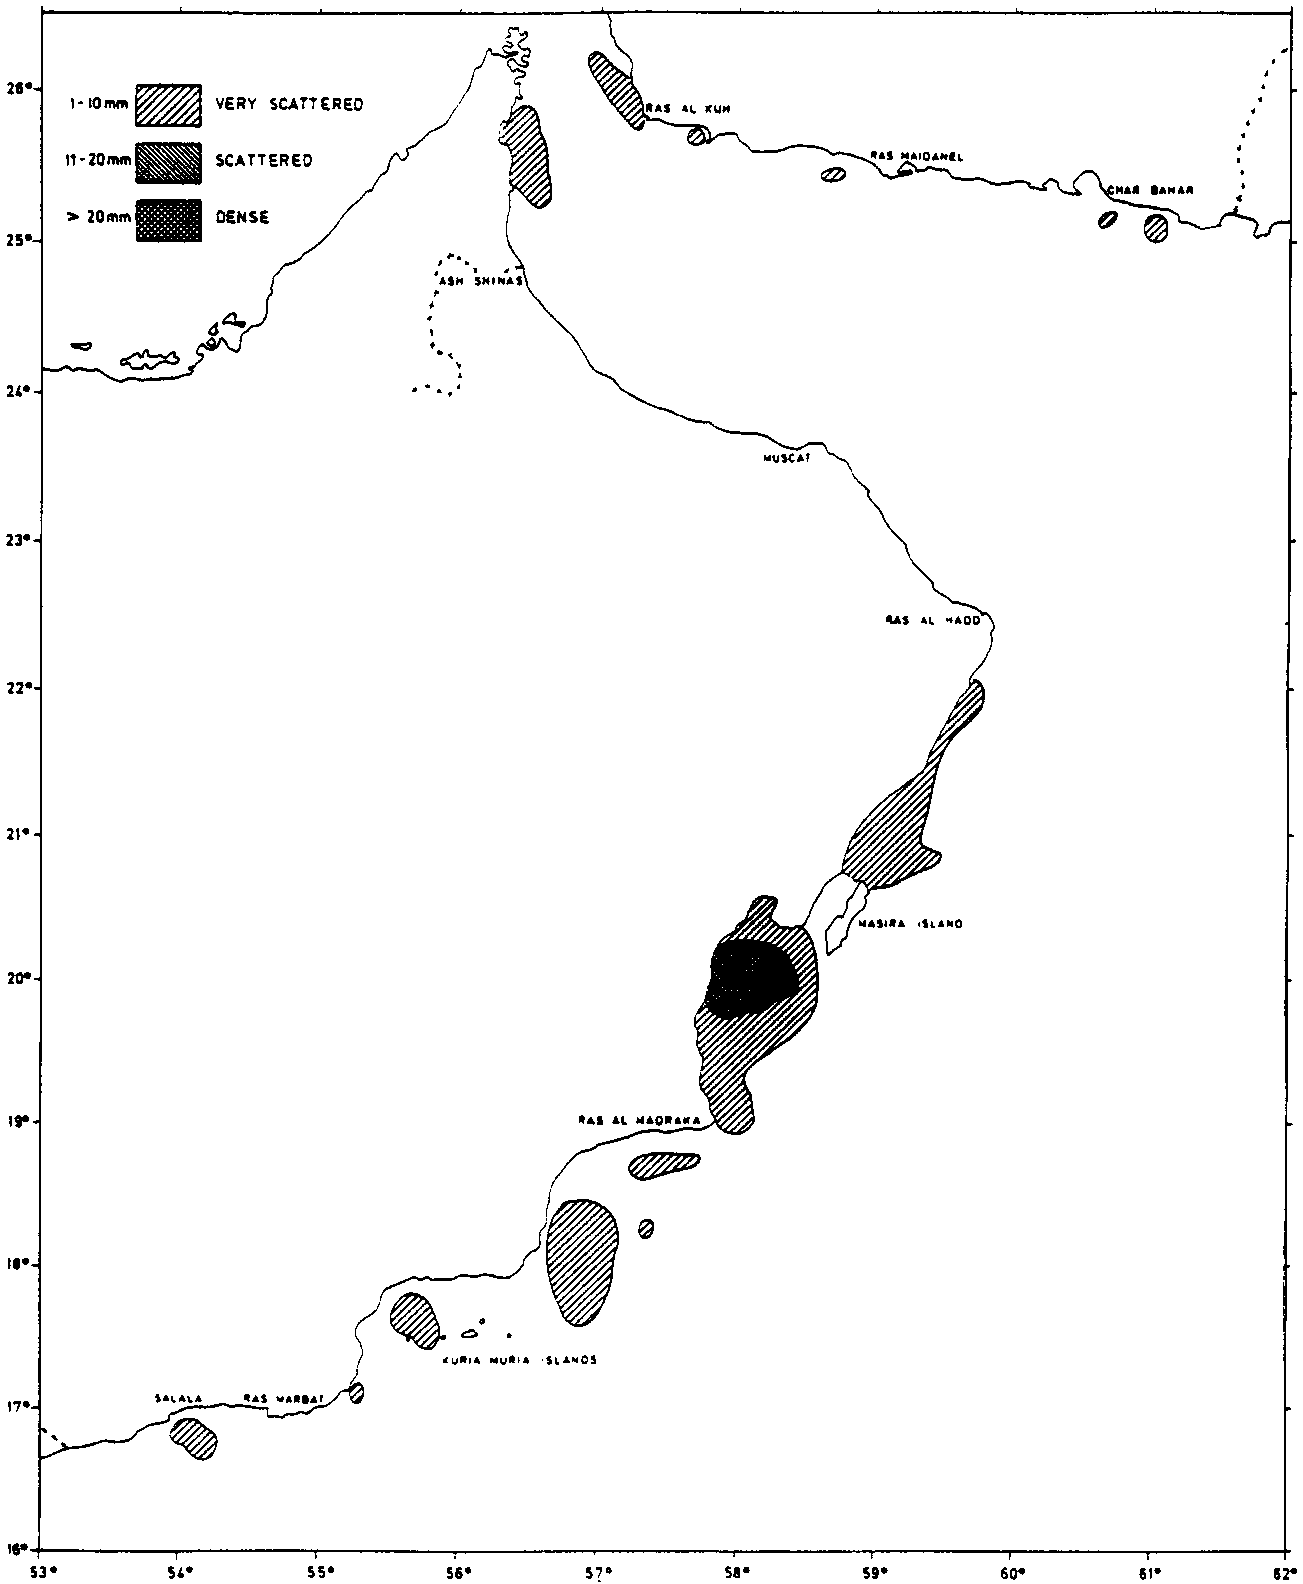
Figure 19. Distribution of demersal
and pelagic fish on the Oman Coast and the South-Iran Coast during Cruise 4,
Feb-Mar 1976.
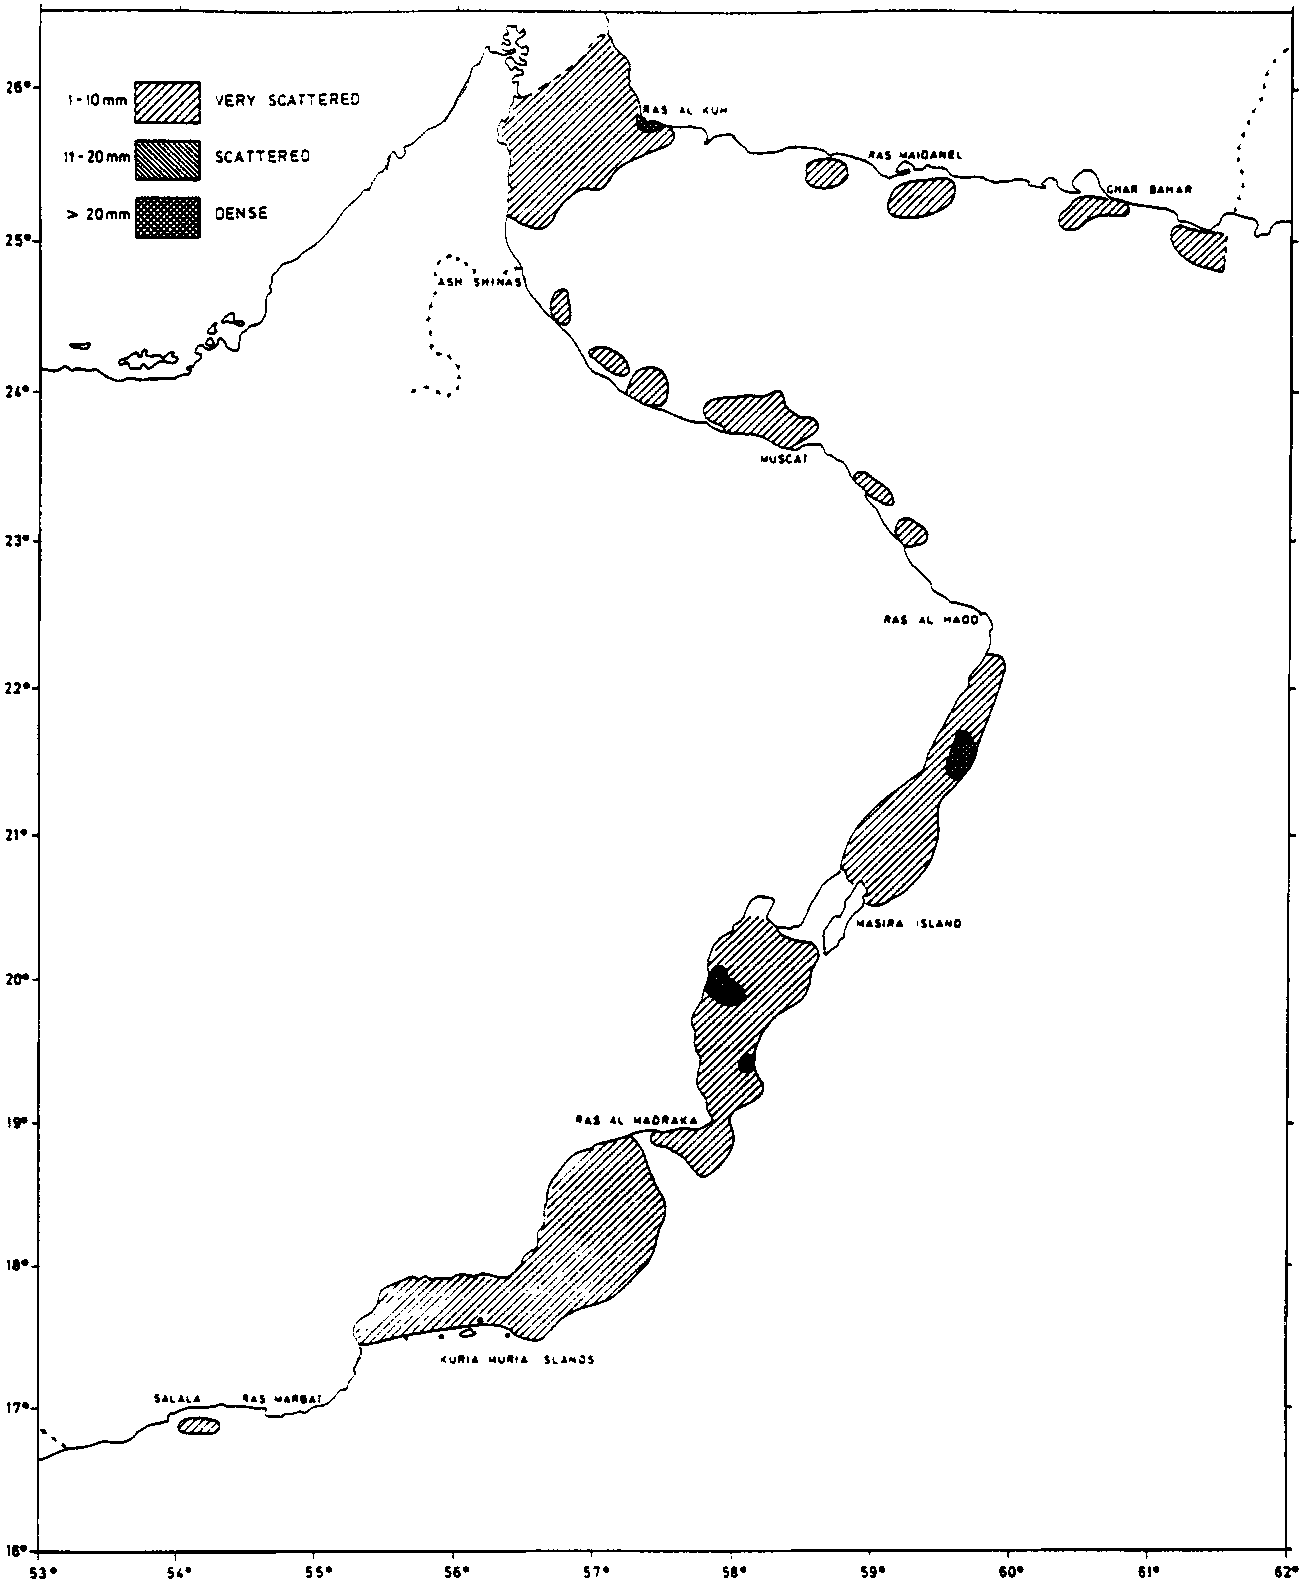
Figure 20. Distribution of demersal
and pelagic fish on the Oman Coast and the South-Iran Coast during Cruise 5,
Apr-Jun 1976.
Figure 21. Distribution of demersal
and pelagic fish on the Oman Coast and the South-Iran Coast during Cruise 6,
Aug-Sep 1976.
Figure 22. Variation in cruise/type
means and variance in Sector 1 (Somalia East Coast)
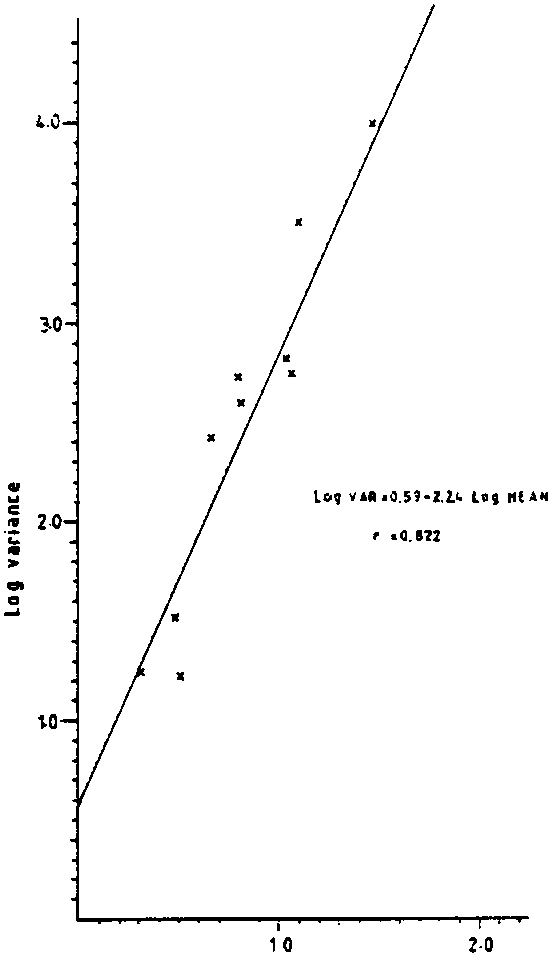
Figure 23a. Estimated biomass per
nm2 in Sector 1 (Somalia East Coast) in the period
1975-1976.
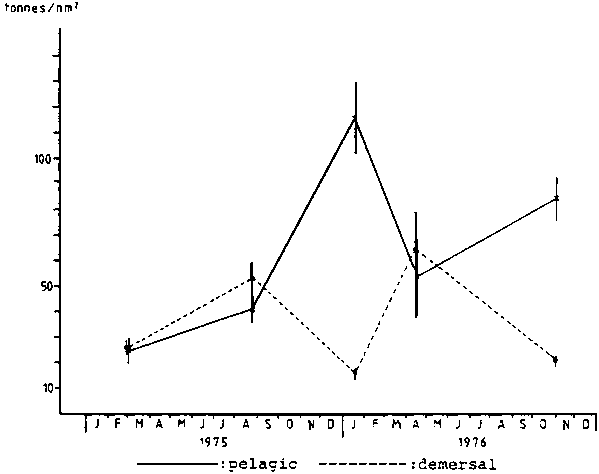
Figure 23b. Estimated biomass per
nm2 in Sector 2 (Somalia North Coast) in the period
1975-1976.
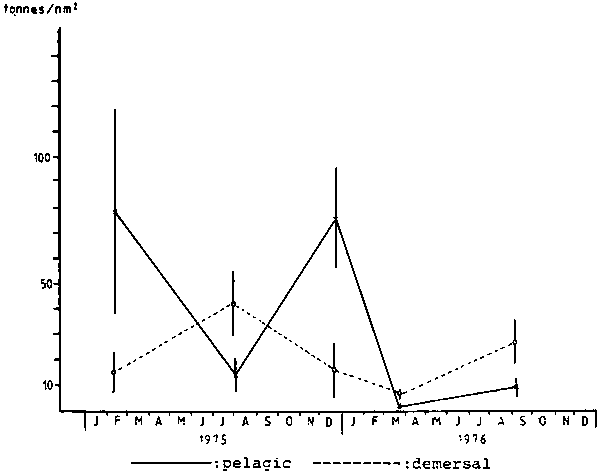
Figure 23c. Estimated
biomass per nm2 in Sector 3 (Socotra Shelf) in the period 1975
1976.
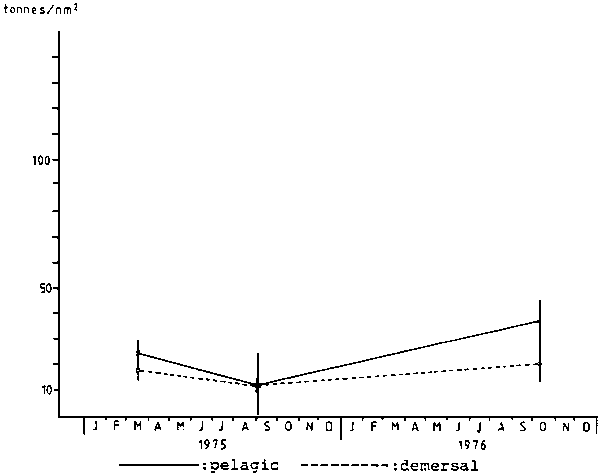
Figure 23d. Estimated biomass per
nm2 in Sector 4 (South-Yemen Coast) in the period
1975-1976.
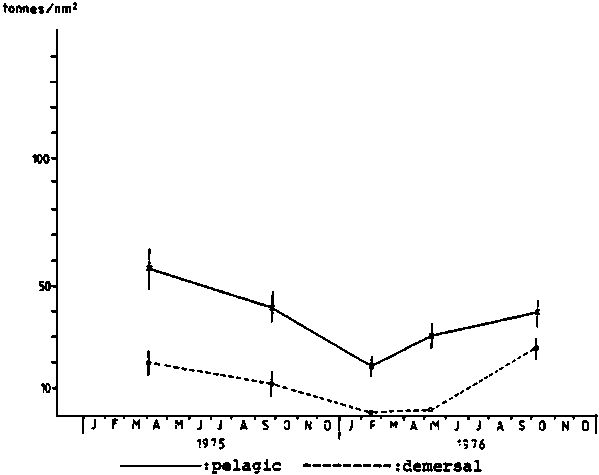
Figure 23e. Estimated biomass per
nm2 in Sector 5 (South-Oman Coast) in the period 1975-1976.
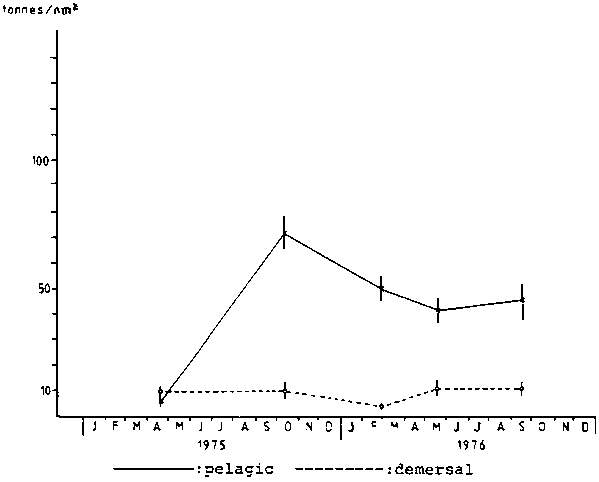
Figure 23f. Estimated biomass per
nm2 in Sector 6 (North-Oman Coast) in the period 1975-1976.
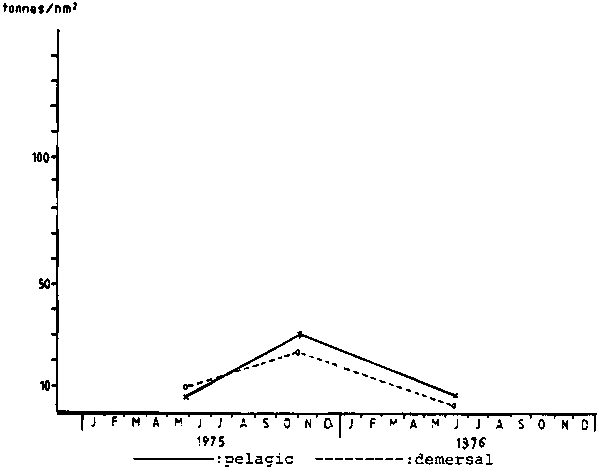
Figure 23g. Estimated biomass per
nm2 in Sector 7. (south-Iran Coast) in the period
1975-1976.
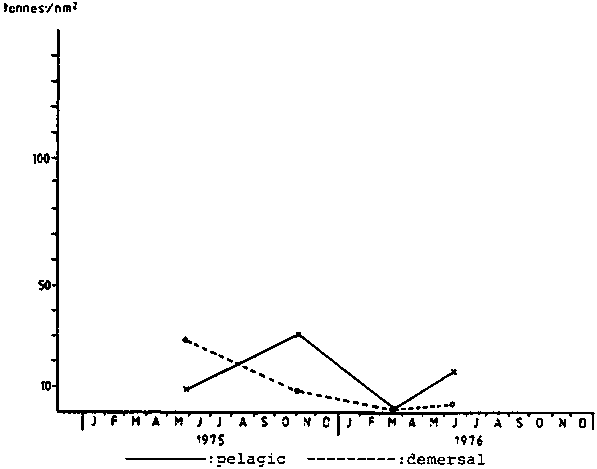
Figure 23h. Estimated biomass
(pelagic + demersal) per nm2 in four sectors in the period
1975-1976.
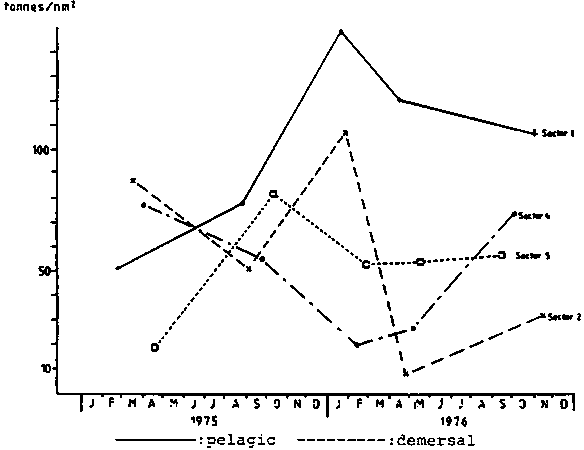
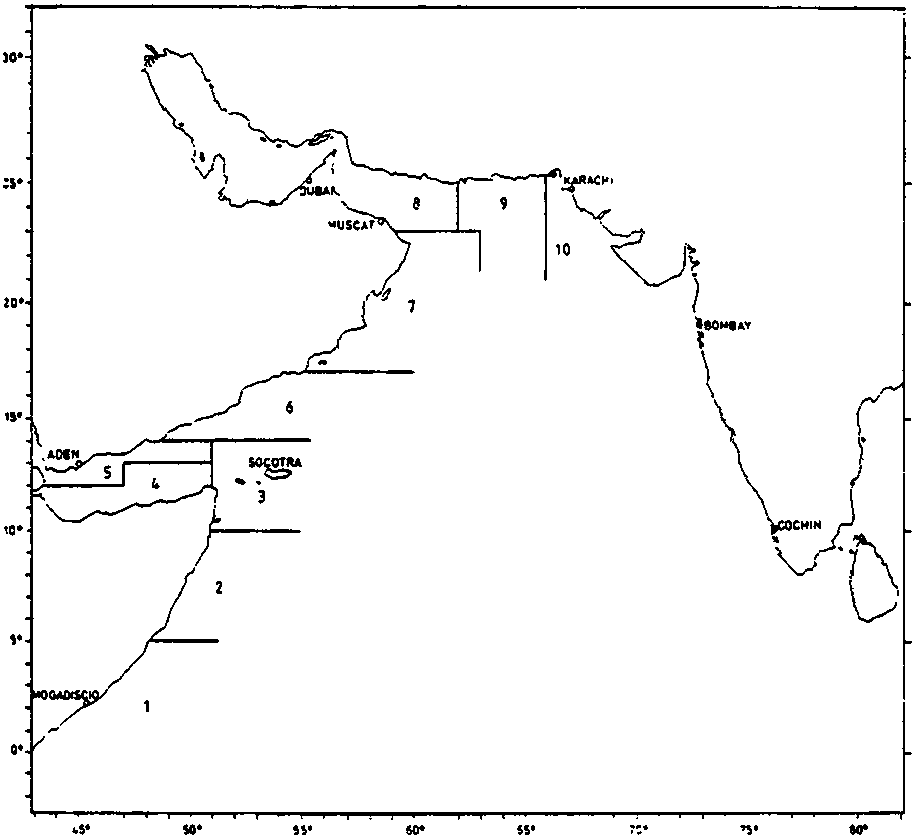
Figure 24. The subareas refered to
in Table 14. They must not be interpreted as the Sector-divisions used in the
report.