![]()
![]()
![]()
In order to evaluate the implications of using different measures of poverty, another indicator of poverty was applied to the same data, using the same statistical analysis applied before.
The new poverty line is different from the one adopted in Chapter 5 as it considers the possible influence on the household’s consumption of living in different areas of Ecuador. In particular, the average of the households’consumptions at the area level (urban or rural) for each region of Ecuador (Sierra, Oriente and Costa) was calculated. Finally, the new poverty line was considered to be two-thirds of the average of the six average consumptions obtained.
Acomparison of the results obtained from adopting this last measure of poverty (Table B.1) with those reported in Table 7 shows that the percentage of poor people decreases from 48 percent with the vulnerability line to 34 percent with the new poverty line. One possible reason for such different results is the fact that the new poverty line includes the area dimension. This seems to have a real impact on household consumption. Another reason is that the new poverty line is ‘higher’than the original one adopted in the study and so fewer households are considered poor.
| Table B.1. Percentage of poor people in the provinces of Ecuador, total sample | |||
|
Province |
% poor |
Difference [((a-b)/a)*100] |
|
|
Spatial p. l.2 (a) |
Spatial p. l.1(b) |
||
|
Azuay |
26.6 |
46.6 |
-75.188 |
|
Bolivar |
32.0 |
70.1 |
-119.063 |
|
Cañar |
53.1 |
75.5 |
-42.185 |
|
Carchi |
46.0 |
69.8 |
-51.739 |
|
Chimboraz |
45.0 |
67.9 |
-50.889 |
|
Cotopaxi |
45.5 |
71.3 |
-56.703 |
|
El Oro |
39.5 |
48.9 |
-23.797 |
|
Esmeralda |
35.6 |
66.4 |
-86.517 |
|
Guayas |
43.2 |
44.3 |
-2.546 |
|
Imbabura |
57.6 |
68.4 |
-18.750 |
|
Loja |
45.6 |
67.0 |
-46.930 |
|
Los Rios |
34.0 |
62.7 |
-84.412 |
|
Manabi |
34.3 |
55.8 |
-62.682 |
|
Morona Sa |
31.6 |
68.8 |
-117.722 |
|
Napo |
34.2 |
69.9 |
-104.386 |
|
Orellana |
38.4 |
75.4 |
-96.354 |
|
Pastaza |
30.8 |
51.6 |
-67.532 |
|
Pichincha |
13.6 |
17.4 |
-27.941 |
|
Sucumbios |
41.6 |
75.2 |
-80.769 |
|
Tungurahu |
27.0 |
43.5 |
-61.111 |
|
Zamora Ch |
25.4 |
67.3 |
-164.961 |
|
Total |
34.7 |
48.2 |
-38.905 |
Figure B.1. Percentage of poor people in the counties of Ecuador, total sample
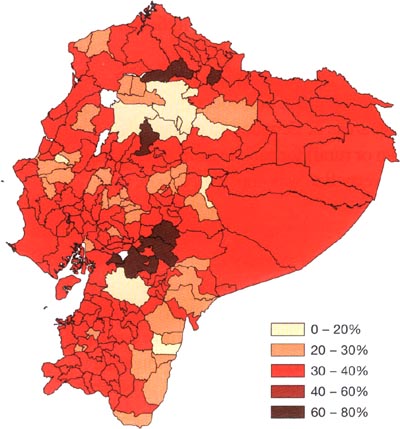
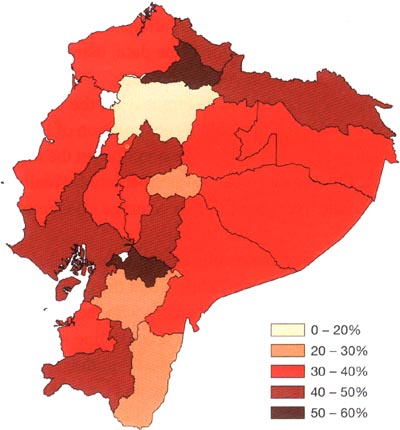
Figure B.2. Percentage of poor people in the provinces of Ecuador, total sample
![]()
![]()
![]()