![]()
![]()
![]()
The Panel reviewed the management of the staff at IPGRI. This is a complicated function that involves staff in 28 countries. These work on international and local contracts, both on IPGRI terms and conditions and on those of INIBAP and various hosting institutions, some of which are CGIAR Centres and some, like IICA in Costa Rica, are regional international bodies. The reason for this is the mix of legal frameworks and agreements under which IPGRI is permitted to operate in different localities. As a result the tax and diplomatic status of staff is location specific.
IPGRI’s present staff distribution is shown in Table 9.1. Staff numbers have grown from 150 regular staff in 1997 to 220 in 2003. This includes internationally recruited staff (IRS), locally recruited professional staff and support staff. In addition IPGRI has made imaginative use of short term and part time hires, using interns, temporary, consultancy and Honorary Fellowship positions and has an additional 50 in these categories, bringing the total to about 270 staff world wide. Of these 45 are IRS and 12 are Honorary Fellows. Turnover is low, running at an average of about 10% per annum and has recently fallen to as low as 4%. Fifty two per cent of regular staff is female, one third of IRS. Two thirds of regular staff is outside Rome. There is a large diversity of staff in terms of nationality, gender and age though, as the Board and MEC noted at the last Board meeting, top management would benefit from greater diversity of nationality in Rome and the Institute would benefit from a better gender balance in the regions.
A head of Human Resources was appointed for the first time in 1997. At the same time there was a major revision in HR policies. There are comprehensive and clearly presented Policy and Human Resources Manuals, which are regularly updated. They cover staff development issues, performance appraisal, recruitment and selection, codes of behaviour, duties and responsibilities, salaries, allowances and benefits, leave and travel and grievance procedures. An induction video on IPGRI is distributed to all new internationally recruited staff worldwide in an effort to create a sense of belonging to the IPGRI family. All professional staff has undergone a four stage training programme in leadership and management over the last year. In addition all HQ staff and Regional directors were given a refresher course in performance appraisal in 2002.
Table 9.1 - IPGRI Staffing as of September 2002
|
Group |
|
REGULAR STAFF |
COMPLEMENTARY STAFF |
||||||||||
|
Location |
IRS |
Ass. Exp |
HQ |
HQ LRS |
Reg LRP |
Reg LRS |
Hon. Fell |
Temp.Staff |
Cons. |
Interns |
Seconded |
TOTAL |
|
|
HEADQUARTERS |
|
|
|
|
|
|
|
|
|
|
|
|
|
|
Institutional |
|
|
|
|
|
|
|
|
|
|
|
|
|
|
ODG |
Rome |
2 |
|
2 |
2 |
|
|
2 |
|
|
|
|
8 |
|
GCTC |
Rome |
|
|
|
1 |
|
|
|
|
2 |
|
|
3 |
|
DDGP |
Rome |
1 |
|
1 |
1 |
|
|
|
|
|
|
|
3 |
|
FA |
Rome |
1 |
|
6 |
15 |
|
|
|
|
|
|
|
22 |
|
Programme |
|
|
|
|
|
|
|
|
|
|
|
|
|
|
SGRP |
Rome |
2 |
|
2 |
1 |
|
|
|
|
|
|
|
5 |
|
DIT |
Rome |
4 |
|
7 |
7 |
|
|
|
|
1 |
1 |
|
20 |
|
GRST |
Rome |
10 |
2 |
1 |
5 |
|
|
4 |
2 |
2 |
2 |
|
28 |
|
REGIONS |
|
|
|
|
|
|
|
|
|
|
|
|
|
|
EUR |
Rome |
3 |
|
1 |
3 |
1 |
|
|
1 |
|
|
|
9 |
|
SSA |
Nairobi |
5 |
1 |
|
|
5 |
6 |
|
2 |
1 |
|
|
20 |
|
WCA |
Benin |
|
|
|
|
4 |
2 |
|
|
|
|
|
6 |
|
AMS |
Cali |
4 |
|
|
|
3 |
9 |
1 |
|
1 |
|
|
18 |
|
APO |
Serdang |
3 |
|
|
|
5 |
11 |
1 |
3 |
1 |
|
1 |
25 |
|
EAS |
Beijing |
|
|
|
|
2 |
2 |
|
|
|
|
|
4 |
|
SAS |
New Delhi |
|
|
|
|
3 |
3 |
1 |
1 |
|
|
|
8 |
|
CWANA |
Aleppo |
2 |
2 |
|
|
5 |
4 |
1 |
|
|
|
|
14 |
|
CA |
Tashkent |
|
1 |
|
|
3 |
2 |
|
|
|
|
|
6 |
|
RCUDP |
Tozeur |
1 |
|
|
|
4 |
3 |
|
|
|
|
|
8 |
|
INRA |
Rabat |
|
|
|
|
1 |
|
|
|
|
|
|
1 |
|
Sub.Tot. IPGRI |
|
38 |
6 |
20 |
35 |
36 |
42 |
10 |
9 |
8 |
3 |
1 |
208 |
|
INIBAP |
Montpellier |
3 |
|
|
|
8 |
6 |
|
|
1 |
|
1 |
19 |
|
INIBAP-AP |
Los Banos |
1 |
1 |
|
|
|
2 |
|
|
|
|
|
4 |
|
INIBAP-ESA |
Naguru |
1 |
1 |
|
|
3 |
3 |
|
|
|
1 |
|
9 |
|
INIBAP-WCA |
Douala |
1 |
1 |
|
|
1 |
2 |
|
|
|
|
|
5 |
|
INIBAP-LAC |
Turrialba |
1 |
1 |
|
|
1 |
1 |
1 |
|
|
1 |
|
6 |
|
INIBAP-TC |
Heverlee |
|
|
|
|
1 |
4 |
1 |
|
|
|
|
6 |
|
Sub.Tot. INIBAP |
|
7 |
4 |
|
|
14 |
18 |
2 |
|
1 |
2 |
1 |
49 |
|
Total |
|
45 |
10 |
20 |
35 |
50 |
60 |
12 |
9 |
9 |
5 |
2 |
257 |
| |
|
TOTAL REGULAR STAFF: 220 |
TOTAL COMPLEMENTARY STAFF: 37 |
||||||||||
IRS=International Recruited staff; LRS= Locally Recruited Support staff; LRP= Locally Recruited Professional staff
* Staff who are hired for a specific project, but not directly administered by IPGRI, are not included in these figures.
IPGRI has a formal performance appraisal system that is mandatory for regular staff on an annual basis. There is both a quantitative and qualitative aspect to the evaluation, set out on the relevant form. Promotions and salary increases unrelated to cost of living increases emanate from this review. Once a year MC reviews all performance appraisals of staff and recommends to the DG promotions and bonuses. Bonuses are paid according to performance. A three year consistently superior record results in eligibility for a salary increase that is pensionable.
IPGRI has been innovative in creating new staffing categories such as Honorary Fellows, Associate Experts and in using interns; and attention is now being given to providing more opportunities for interns and postdoctoral fellows from developing countries. IPGRI does offer an opportunity for Study Leave in order to help professional staff maintain their scientific connections and professionalism, but this has not been used. In addition, IPGRI is trying to encourage scientists from other CGIAR Centres to spend sabbaticals at IPGRI. As a networking organization IPGRI staff attends many workshops and conferences, which also helps scientists to remain in touch with their peers.
IPGRI undertook a review on People Management Practices in June 2001. The Review was impressed with the general calibre of IPGRI’s staff and management’s commitment to staff and good management practices. This review made a number of suggestions particularly related to improving leadership skills at this critical stage in the evolution of the Institute and this has now been completed.
A CCER on Resource Management, undertaken in May 2002, opined that, because of the increase in the size of the organization, what used to happen at IPGRI spontaneously now requires intentional direction and a somewhat more bureaucratic approach. It recommended a move to decentralize financial oversight of the functioning of the Institute and made some recommendations on control systems that have been taken into account. It also made recommendations on the need to manage cash resources in a manner that takes account of the growing uncertainty of funding.
The ‘360 Degree’ Survey that followed this CCER (see Section 8.2.3) put further stress on the problems that emanate from the CCER’s finding on the informal and discretionary mode of operating at senior management level.
The Panel organized a confidential survey of all staff to ascertain their views on matters relating to HR at IPGRI, their perception of working at IPGRI and the general view of IPGRI from outside. Overall the responses, received from 30% of all staff, reflected a good working environment. However, some issues were raised related to staff training and career development, rewards for performance, workload and, to a lesser degree, the fairness and objectivity of the performance evaluation system and level of involvement of staff on matters directly affecting their work. Similar issues also came out in the ‘360 Degree’ Evaluation (see Section 8.2.3) and it is the Panel’s view that the steps being taken as a result will enhance staff well being. Overall IPGRI appears to be a well functioning Institute, which is a commendable achievement given the number and the wide geographic dispersal of staff.
In the five years prior to the last EPMR IPGRI’s budget had doubled in real terms. In the last five years it has grown again by more than 50%, from US$19.5 million in 1997 to an expected US$30 million in 2003. This is expected to grow still further to US$40 million by 2010. In other words IPGRI is expanding rapidly. This dynamic scenario means that it is critical that IPGRI’s financial management systems are robust enough to cope with these changes and that management is abreast of the situation. The Panel formed the view that this is the case today and commends management for looking forward to such issues as regional control of the budgetary process which, while not a problem today, could become so.
Key financial data for the period 1997 to 2005 are shown in Table 9.2. It is pertinent to note the substantial increase in the proportion of restricted funding in overall financing, from 36% in 1997 to an estimated 65% in 2003. Management and General expenses have been kept under tight control and the amount that is not covered by overheads charged to particular projects has been reducing. Direct travel costs, to support networks and attend workshops, have not increased very much which is perhaps surprising, given the nature of the Centre, but partly reflects the fact that in 2002 and 2003 unrestricted funds were squeezed and staff were under pressure from management to cut back on spending of unrestricted funds; and from the fact that an in-house and cost effective travel office was set up in 1998/99 which is reported to have cut costs by 30%.
IPGRI continues to have a very experienced, stable and competent Finance department. The present DFA has been in post for six years and the Finance Manager for ten years. Together they have overseen the substantial increase in the Institute’s budget and the increasing decentralization of IPGRI’s staff.
A draft budget, presented by MEC, is considered by the Board and its FITG in its September meeting. The PPRC, led by the DDGP, coordinates a week long review of the Institute’s 20 Projects in November and recommends a draft budget for the scientific programme to the MC which follows the PPRC. Income projections are largely based on donor information from the CGIAR AGM in November. The financial implications are put together with the costs of supporting this programme and a final budget submitted to EXCO for approval in December. The agreed budget is then presented to the Board in its March meeting, together with an explanation of how it differs from the earlier draft.
The Board explicitly recognizes the nature of the fund raising programme and is, on occasions, willing to initially approve a budget with a deficit. The DFA manages the situation during the year in an effort to end the year with a balanced budget. As will be evident from Table 9.2 there has been a net budget surplus over the past six years. The largest deficit was in 1999 when a large donor unexpectedly defaulted on a significant payment just before the year end close which resulted in a deficit of nearly US$300 000 or 1.4% of the budget.
Table 9.2 - Key financial data for the period 1997 to 2010
| |
|||||||||||
| |
Actual |
Estimated |
Proposed |
||||||||
|
1997 |
1998 |
1999 |
2000 |
2001 |
2002 |
2003 |
2004 |
2005 |
2010 |
||
|
REVENUE |
|||||||||||
|
Unrestricted |
12 629 |
13 344 |
13 000 |
13 213 |
10 761 |
10 500 |
10 233 |
12 000 |
12 500 |
14 000 |
|
|
Restricted |
6 080 |
8 269 |
7 123 |
10 248 |
12 401 |
15 161 |
18 692 |
18 000 |
19 500 |
26 000 |
|
|
Total Research Agenda |
18 709 |
21 613 |
20 123 |
23 461 |
23 162 |
25 661 |
28 925 |
30 000 |
32 000 |
40 000 |
|
|
Non Agenda |
879 |
49 |
0 |
0 |
0 |
0 |
0 |
0 |
0 |
0 |
|
|
Total Revenue |
19 588 |
21 662 |
20 123 |
23 461 |
23 162 |
25 661 |
28 925 |
30 000 |
32 000 |
40 000 |
|
|
OPERATING EXPENSES |
|||||||||||
|
Programme |
15 170 |
17 025 |
15 643 |
17 562 |
19 332 |
23 405 |
26 289 |
27 007 |
28 756 |
35 126 |
|
|
Management & General |
4 296 |
4 629 |
4 774 |
4 038 |
3 753 |
2 347 |
2 636 |
2 671 |
2 844 |
3 474 |
|
|
Total Operating Expenses |
19 466 |
21 654 |
20 417 |
21 600 |
23 085 |
25 752 |
28 925 |
29 678 |
31 600 |
38 600 |
|
|
Surplus/(Deficit) |
122 |
8 |
(294) |
1 861 |
77 |
(91) |
0 |
322 |
400 |
300 |
|
|
Allocated as follows: |
|
|
|
|
|
|
|
|
|
|
|
| |
Operating fund |
581 |
29 |
(1 493) |
2 013 |
333 |
(82) |
0 |
322 |
400 |
300 |
|
Capital fund |
(1) |
(21) |
(14) |
9 |
183 |
(9) |
0 |
0 |
0 |
0 |
|
|
Other funds |
0 |
0 |
1 213 |
(161) |
(439) |
0 |
0 |
0 |
0 |
0 |
|
|
Operating expenses by natural classification: |
|||||||||||
|
Personnel costs |
8 947 |
9 222 |
9 079 |
10 055 |
10 541 |
11 608 |
13 038 |
13 500 |
14 800 |
17 400 |
|
|
Supplies & Services |
8 921 |
10 454 |
9 432 |
9 743 |
10 370 |
12 065 |
13 552 |
13 750 |
14 272 |
18 567 |
|
|
Travelling |
1 291 |
1 592 |
1 502 |
1 356 |
1 733 |
1 671 |
1 895 |
1 944 |
1 995 |
2 047 |
|
|
Depreciation |
307 |
386 |
404 |
446 |
441 |
408 |
440 |
484 |
532 |
586 |
|
| |
Total Operating Expenses |
19 466 |
21 654 |
20 417 |
21 600 |
23 085 |
25 752 |
28 925 |
29 678 |
31 600 |
38 600 |
|
BALANCE SHEET ELEMENTS |
|||||||||||
|
Current Assets* |
9 048 |
13 882 |
17 468 |
15 165 |
15 851 |
15 736 |
17 675 |
18 101 |
19 273 |
28 251 |
|
|
Non-current assets* |
4 390 |
303 |
229 |
203 |
536 |
4 361 |
4 898 |
5 486 |
6 144 |
6 882 |
|
|
Fixed Assets |
1 964 |
1 858 |
1 697 |
1 767 |
2 347 |
2 221 |
2 495 |
2 794 |
3 129 |
3 505 |
|
| |
Total Assets |
15 402 |
16 043 |
19 394 |
17 135 |
18 734 |
22 318 |
25 068 |
26 381 |
28 546 |
38 637 |
|
Current Liabilities |
9 123 |
8 484 |
12 063 |
7 971 |
9 345 |
12 565 |
14 113 |
14 481 |
15 418 |
18 834 |
|
|
Working Capital* |
(75) |
5 398 |
5 405 |
7 194 |
6 506 |
3 171 |
3 562 |
3 620 |
3 855 |
9 417 |
|
|
Long term Liabilities |
371 |
1 643 |
1 709 |
1 681 |
1 829 |
2 284 |
2 565 |
2 632 |
2 803 |
3 423 |
|
|
Fund balances |
|
|
|
|
|
|
|
|
|
|
|
| |
Operating Fund |
3 878 |
3 707 |
2 214 |
4 227 |
4 560 |
4 478 |
4 478 |
4 800 |
5 100 |
6 600 |
|
Capital fund |
66 |
351 |
498 |
437 |
653 |
770 |
933 |
960 |
1 020 |
1 320 |
|
|
Special purpose funds |
0 |
0 |
1 213 |
1 052 |
0 |
0 |
0 |
0 |
0 |
0 |
|
|
CASH BALANCES* |
|||||||||||
|
Opening Balance |
9 235 |
8 764 |
9 350 |
12 585 |
11 403 |
6 490 |
5 680 |
4 858 |
5 440 |
6 113 |
|
|
Receipts |
17 023 |
19 306 |
22 311 |
18 493 |
19 372 |
21 927 |
24 716 |
26 700 |
28 480 |
35 600 |
|
|
Payments |
(17 494) |
(18 720) |
(19 076) |
(19 675) |
(21 356) |
(22 737) |
(25 539) |
(26 117) |
(27 808) |
(33 968) |
|
|
Closing balance |
8 764 |
9 350 |
12 585 |
11 403 |
9 419 |
5 680 |
4 858 |
5 440 |
6 113 |
7 745 |
|
|
|
|
|
|
|
-2929 (restricted cash) |
|
|
||||
| |
|
|
|
|
6 490 |
|
|
|
|
|
|
*Beginning in 2002, restricted cash is no longer included in
current assets.
It has been reclassified as "Non-current assets" as per CGIAR
instruction.
As the proportion of funding that is unrestricted has fallen a growing emphasis has been put on ensuring that all projects contain an element of overhead recovery in their funding. The Board has asked management to aim for an average of 20% of total project costs. Project costs have to include all directly identifiable costs of the project including staff salaries, office space and communications. About half of the 20% is allocated by the Finance and Administration group to cover management costs and associated office expenses and the other half to directly identifiable direct costs of the project. The actual recovery rate is still well below this target. The basic cost of running IPGRI is about US$6 million, which is about 20% of the total annual budget. These costs are broken down as follows.
Table 9.3 - Indicative Overhead costs at IPGRI 2002
|
General management costs |
US$ |
|
IRS costs |
748 |
|
LRS costs |
1 394 |
|
Board |
251 |
|
DG discretionary |
189 |
|
Institutional and CGIAR memberships |
50 |
|
Depreciation |
440 |
|
Direct operational costs |
US$ |
|
Rome HQ operating costs |
1 477 |
|
INIBAP France operating costs |
319 |
|
Regional offices operating costs |
932 |
|
Total Institutional costs |
5 800 |
The average recovery rate to date has been between 10 and 12% over the past ten years, with the shortfall effectively coming out of the unrestricted pot. Senior management have recently circulated a paper on the subject to the MC and PPRC and have instructed that all new projects aim for 20% recovery of total project costs by identifying the full senior supervisory management and direct costs. Where it is simply a matter of funding that is passed through to an institution such as NARS, 4% should be charged.
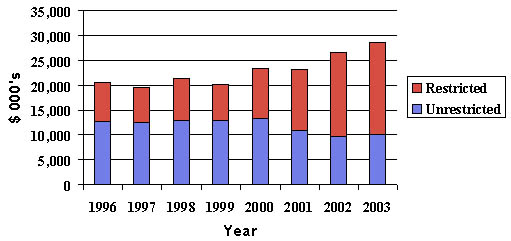
Table 9.4 shows the trend in the declining proportion and absolute amounts of unrestricted funding. This is causing problems. Vacancies funded through unrestricted sources have been frozen. The number of professional staff in the SSA Regional Office may have to be reduced. As travel funds for all groups were cut by 30% in 2002 this is reducing the capacity of IPGRI staff to initiate discussions with regional entities, for example the Asia Forest Genetics Resources network, or fund the new LoA with Hungary for institutional analysis and seed policy work, or attend workshops such as that on desiccation sensitivity in South Africa, or to carry out fundraising related to the new initiative on diversity-for-nutrition-for-health work. Given IPGRI’s role as a catalyst and networker, the long term effects of these cuts might not be evident for some time.
Table 9.4 - Unrestricted Funding Levels 1996-2003
The Centre is required by the Board to maintain an operating reserve at 60 days of operating expenses, which is within CGIAR guidelines. The reserves fell in 1999, following the budget deficit in that year caused by the default by a major donor, to 39 days. They were rebuilt to 70 days equivalent in 2001. With the pressure on unrestricted funding in 2002 and 2003 they are expected to fall back to 50 days in the current year. The total liabilities to staff are about US$2 million and the Panel believes that IPGRI is operating within a reasonable safety margin. However the Panel is unsure of the effect on the management of the Institute’s cash flow of the recent decision to make a substantial loan to a sister Centre. The panel also questions whether sufficient attention has been given to the recommendation of the CCER on Resource Management with respect to maintaining a cash balance appropriate to a climate of growing donor uncertainty.
IPGRI is a founder member of the consortium of CGIAR Centres sponsoring the Internal Audit Unit based in the Far East. IPGRI pays US$30 000 a year for the services of one sixth of the three person team who have covered a wide variety of issues at IPGRI, including, in the last three years, the management of various regional offices (APO, SSA, AMS, CWANA), LoAs, the operations of the Project Management Framework, Project financial reporting, travel expense claims, delegation of authorities to the regions and issues relating to IP. The internal audit reports are comprehensive and detailed and are presented to FITG and the Board. They constitute a valuable management tool and contribute to an impressively transparent relationship between senior management and the Board.
A major exercise is underway to decentralize some part of financial management to the Regions. During this calendar year responsibility for: travel authorization, LoAs less than US$20 000, impress claims and purchases under US$20 000 will all be taken on by the regions, based on the approved budget. In addition, with the retirement of the key finance individual in INIBAP, the financial management of INIBAP will become truly integrated into the Institute’s system.
![]()
![]()
![]()