6. SOIL TEXTURE

6.1 Quick field tests to determine soil texture
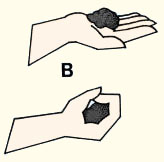
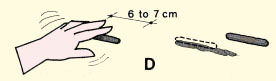
For fish-pond construction, it is better to have a soil with a high proportion of silt and/or clay which will hold water well. To check quickly on the texture of the soil at different depths, here are two very simple tests you can perform.
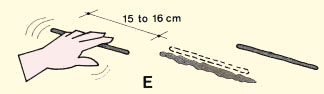
Throw-the-ball test
 |
 |
 |
 |
Squeeze-the-ball test
 |
 |
|
 |
 |
6.2 How to find the approximate proportions of sand, silt and clay
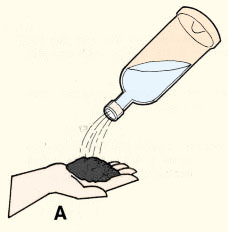
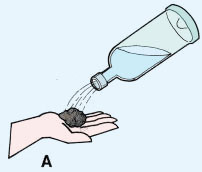
This is a simple test which will give you a general idea of the proportions of sand, silt and clay present in the soil.
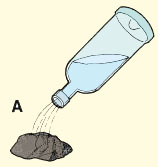
The bottle test
 |
 |
|
 |
6.3 How to rate soil texture from fine to coarse
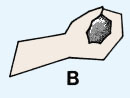
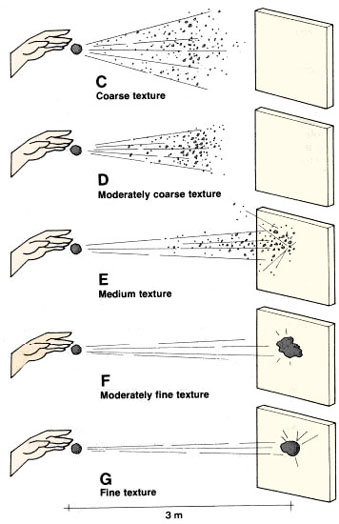
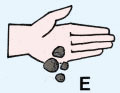
Soil texture may be rated from fine to coarse. A fine texture indicates a high proportion of finer particles such as silt and clay. A coarse texture indicates a high proportion of sand. More precise definitions may be obtained from Table 4. The simple test below will help you to rate the soil texture from coarse to fine.
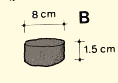
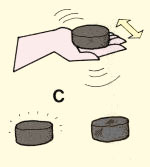
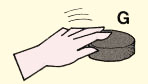
The mud-ball test
 |

|
|
 |
6.4 Soil textural classes and field tests for their determination
A more accurate determination of soil texture
Soils may be assigned to textural classes depending on the proportions of sand, silt and clay-size particles. These textural classes are defined in Table 4 and they are represented in Table 6. In the field, there are several ways by which you can find the textural class of the fine-earth portion of a particular soil sample.
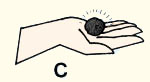
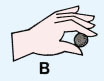
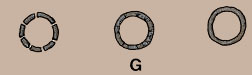
The ball-shaking test
 |
|
|
 |
 |
 |
 |
|
|
 |
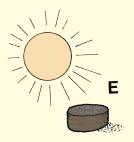
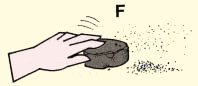
The dry crushing test
 |
 |
|
 |
 |
|
|
 |
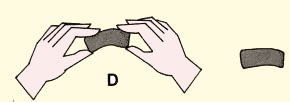
The manipulative test
The manipulative test gives you a better idea of the soil texture. This test must be performed exactly in the sequence described below because, to be successful, each step requires progressively more silt and more clay.
|
|
|
 |
 |
|
 |
|
|
 |
|
|
 |
|
|
 |
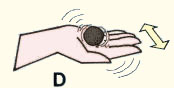
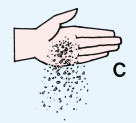
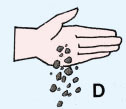
The shaking test: how to differentiate clay from silt
Both silt and clay soils have a very smooth texture. It is very important to be able to tell the difference between these two soils because they may behave very differently when used as construction material for dams or dikes where the silt may not have enough plasticity. Silty soils when wet may become very unstable, while clay is a very stable construction material. plasticity. Silty soils when wet may become very unstable, while clay is a very stable construction material.
 |
 |
|
|
 |
 |
 |
|
 |
 |
Note: record the results of the shaking test - rapid, slow, very slow, not at all - according to the speed with which the surface of the patty becomes shiny when you shake it.
1 Based on the USDA particle-size classification, as defined in Table 2. |
6.5 Laboratory tests for textural classes
If you need to define the textural class of your soil more accurately, you should take disturbed soil samples to a testing laboratory for a quantitative determination of the particle sizes. This is called a mechanical soil analysis. The following are some of the things which may be done in the soil laboratory:
- Your soil sample will be dried;
- Particles greater than 2 mm, such as gravel and stones, will be removed;
- The remaining part of the sample, the fine earth, will be finely ground to free all the separate particles;
- The total weight of the fine earth will be accurately measured;
- The fine earth will be passed through a series of sieves* with mesh of different sizes, down to about 0.1 mm in diameter;
- The weight of the contents of each sieve will be calculated separately and expressed as a percent of the total initial weight of the fine earth;
- The weights of the very small particles of silt and clay which have passed through the finest sieve will be measured by sedimentation. They will also be expressed as a percent of the total initial weight of the fine earth.
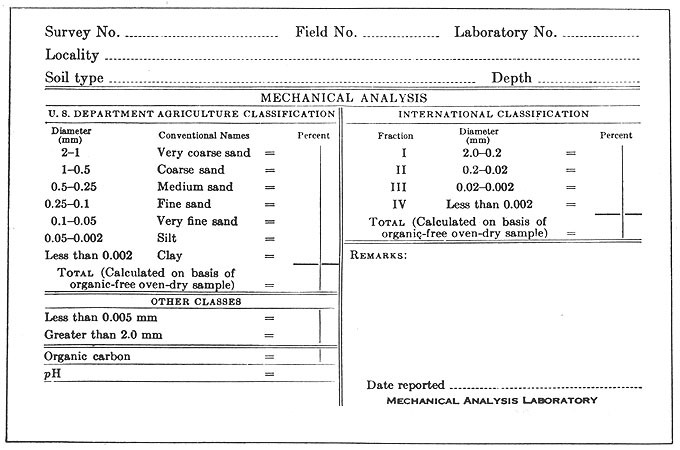
The results of a mechanical soil analysis made in the laboratory may be given to you in one of the following forms:
- Sample by sample as a list (see Table 5);
- Sample by sample on separate cards (see example below);
- As a series of more detailed tables (see Section 6.7).
With these results, you may assign either a particular textural class to each sample using the textural triangle method (see Section 6.6), or prepare a particle-size frequency curve from which you can draw your own conclusions (see Section 6.7).
Note: it is important to know which system of particle-size classification (Table 2) is being used by the soil laboratory for testing. If it is the one used by the US Department of Agriculture (USDA) which defines silt from 0.05 to 0.002 mm, follow the method described. However, if the laboratory uses another system such as the international system which defines silt from 0.02 to 0.002 mm, you should request an additional quantitative determination of particle sizes of 0.05 to 0.02 mm in diameter (coarse silt). This will allow you to modify the results given to you, to adjust them to the USDA system, and to use the following textural triangle method.
Usually, a complete mechanical analysis of your soil sample is not necessary. For your requirements, a simple particle-size analysis may be sufficient. This gives you the percentage of soil particles with a size equal to or larger than 0.075 mm in diameter. If the percentage is less than 50 percent, it is a fine grained soil (fine texture). If the percentage is more than 50 percent, it is a coarse grained soil (coarse texture). With this information you can then judge the soil quality as described in Sections 11.2 and 11.3.
Note: 0.075 mm is the opening size of US Standard Sieve No. 200. For engineers, this particular size represents the separation limit between sand and silt + clay (see Table 2, line 6).
|
Example
 |
6.6 The textural triangle method to determine the basic textural classes
The textural triangle method is based on the USDA system of particle size where the following classification is used:
- Silt: all particles within the size range of 0.002-0.05 mm;
- Clay: all particles smaller than 0.002 mm.
To define the texture of the fine earth fraction:
- Send your soil sample to a soil laboratory for mechanical analysis;
- When you receive the results of this analysis, find, if necessary, the relative percentages of sand, silt and clay, as defined above, within the total size range of 0.002-2 mm.
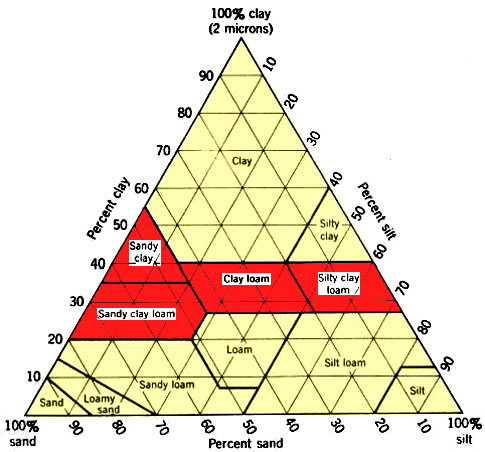
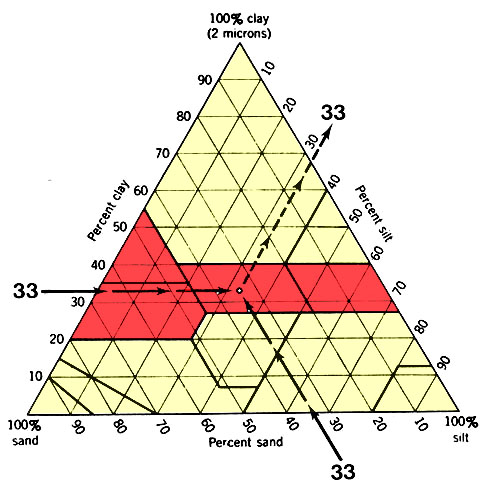
For each soil sample, determine its textural class using the triangular diagram shown in Table 6; as follows:
- Find the percentage of sand along the base of the triangle and follow a line, going up toward the left;
- Find the percentage of clay along the left side of the triangle and follow to the right the horizontal line until you meet the previous line for sand (point o). This point shows the soil sample texture;
- Check that this point corresponds to the percentage of silt of your analysis by following a line from point 0 up to the right, until you reach the percent silt scale on the right side of the triangle;
- If the value agrees for silt, your soil sample texture is determined by the area of the triangle in which point 0 falls, as indicated in the example below.
|
NOTE: The soil textural classes shown in the red portion of the large triangle are best for fish-pond construction. |
 |
PARTICLE SIZES
|
6.7 The particle-size frequency curve
The usual mechanical analysis provides percentages for the three particle-size classes of sand, silt and clay, such as the one for clay loam shown in the example.
If this is not sufficient, some soil laboratories can provide a much more detailed analysis, with a further breakdown giving the relative amounts of soil particles for more size classes. The results of this kind of analysis may be given in the form of a simple table where the weight for each particle size is given as a percentage of the total dry weight of the fine earth of the soil sample, such as the one shown below.
|
Example
= Clay loam
|
Note: for very small particles (less than 0.1 mm in diameter), soil technicians often use the measurement unit called micron(m) to avoid too many decimals.
1 micron (m ) = 0.001 mm (or one thousandth of a millimetre)
1 mm = 1 000 m
Examples
What is a PSF-curve?A particle-size frequency curve is plotted on a graph where the logarithms of the particle size are shown on the horizontal axis, with the size decreasing toward the right, and the cumulative percentages of occurrence of the particle size are shown on the vertical axis. Note: generally, two scales are shown on the vertical axis. To the left, the percentages relate to particles passing through sieves of a particular size. Here, the percentages increase from bottom to top. To the right, the percentages relate to particles not passing through sieves of a particular size. Here, the percentages increase from top to bottom. |
Example

|
What does a PSF-curve show?
If you look at the examples of particle-size frequency curves in Table 7, you will note the following:
- The inflexion point (IP) of the curve shows you the most frequent particle size by weight; in some cases, there may be more than one inflexion point as, for example, if the sample (a composite sample) contains more than one type of soil (see Table 7, curves d and e);
- The more vertical the curve or part of the curve, the more uniform the particle size; a vertical line represents a perfectly uniform particle-size;
- The more inclined the curve or part of the curve, the greater the difference between the particle sizes, the smaller the pores between the particles, and the more compact the soil;
- The total quantity of soil particles within a particular range of particle sizes is defined as the area below the PSF- curve which lies between these two particle sizes, as, for example, from 0.08 mm to 0.3 mm (shaded area) (see Table 7, curve c). To find this quantity as a percentage of the total dry weight of the soil sample, transfer the points which correspond to 0.08 mm and 0.3 mm on the PSF-curve to one of the vertical scales and calculate the percent difference: in this case, read on the left vertical scale, 68 percent and 75 percent. The difference is 7 percent.
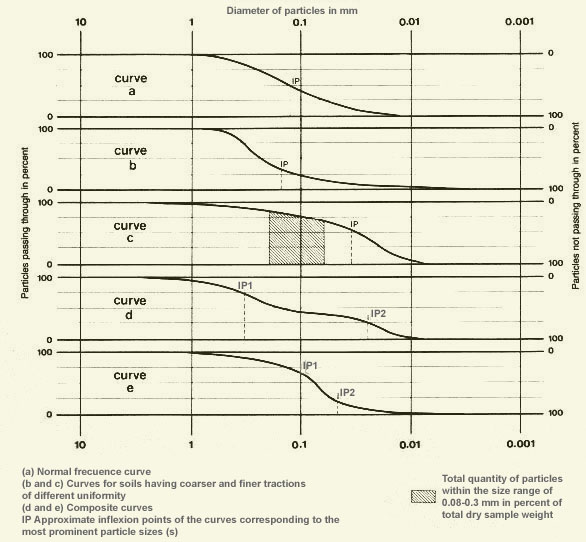
Note: Table 8 shows five PSF-curves for five types of soil, varying from gravel/sand to heavy clay. Study each carefully to observe its relative position in the graph, its inflexion point and its inclination.
|
TABLE 8
Particle-size frequency curves for selected soils showing mechanical analysis results down to very small particles of clay 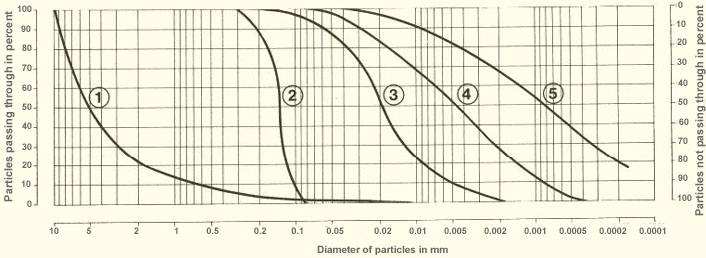 1 Gravel and sand (old alluvium), 2 Sand, 3 Silt, 4 Calcareous clayey soil (marl), 5 Heavy clay |
How do you get a PSF-curve?
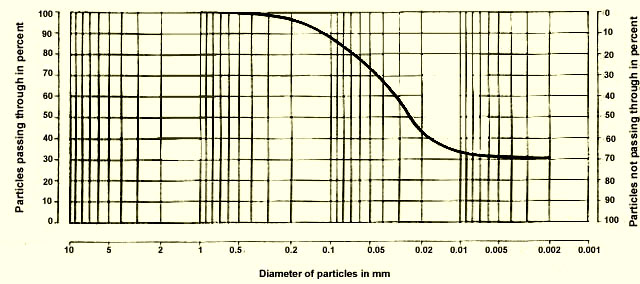
Some laboratories provide a PSF-curve for soil samples and some do not. When you receive the results of a mechanical soil analysis, you may also get a PSF-curve. For each soil sample, you will receive a graph showing one PSF-curve. Table 10 shows a PSF-curve prepared by a soil laboratory for one soil sample, see example below.
If your soil laboratory does not give you a PSF-curve, you will receive the results in the form of a table giving the frequency of occurrence (in percent of total dry weight) for a certain number of particle sizes. You can use this table to prepare a PSF-curve yourself. Table 9 is a blank graph that you can use to prepare a PSF-curve. If possible, use a photocopy of Table 9 for each curve you plot. You will then be able to use the blank graph over and over again, to make more photocopies.
How to draw a PSF-curve
To draw a PSF-curve, proceed as follows:
- Calculate the cumulative percentages of occurrence for each given particle size, starting with the largest size;
- Enter the cumulative percentages in pencil on a photocopy of the blank graph in Table 9, using the right vertical scale;
- Join these points by drawing a continuous curve: this is a PSF-curve.
Note: remember that cumulative percentages represent weights of particles that have not passed through a particular size sieve. Therefore, use the right vertical scale of the graph (0-line at the top) for plotting cumulative percentages.
| Example
|
|||||||||||||||||||||||||||||||||||||||

How to use a PSF-curve to obtain particle-size frequency percentages
To obtain the percentages of occurrence of certain particle sizes using a PSF-curve, such as, for example, to find the textural class using the textural triangle method, proceed as follows:
- Using the right vertical scale (0-line at the top), read from the given PSF-curve the cumulative percentages corresponding to selected particle sizes, such as 0.05 mm (limit sand-silt) and 0.002 mm (limit silt-clay);
- Write these readings in a two-way table which gives the cumulative percentage for each particle size, starting with the largest;
- Calculate the frequency of occurrence of each range of particle size.
| Example
|
|
|||||||||||
| You have already been shown how to calculate the total quantity of soil particles (frequency of occurrence) within a particular range of particle sizes. Now, calculate in the same way the frequencies of occurrence for sand, silt, and clay (in that order) for the PSF-curve in Table 10. They are as follows: |
|
|||||||||||
|
Introduce these values 28-42-30 into the textural triangle (see Table 6); the soil is a clay loam, a moderately fine-textured soil. From the 0.075-mm particle-size reading, you conclude that the
sample contains 19 percent of particles larger than |
Further uses of the PSF-curve: effective size and uniformity coefficient
Another important use of the PSF-curve is to express the characteristics of the particle-size distribution of a soil by numerical values so that the results of a great number of soil samples may be easily compared. Engineers frequently use Hazen's method which defines two particular values which are most suitable for sands. These are:
- The effective size or D10 of a soil is the diameter in millimetres of the sieve through which 10 percent (by weight) of the sample passes;
Note: this value gives an estimate of the most important particle sizes by weight: 10 percent of the soil consists of particles smaller than D10 , 90 percent of the soil consists of particles larger than D10
- The uniformity coefficient or U of a soil is the ratio of the diameter (in mm) of the sieve hole through which 60 percent (by weight) of the sample passes (D60) to the effective size (D10) or U = D60 ÷ D10
Note: when the PSF-curve is a vertical line (U = 1), the particles of the soil sample are perfectly uniform in size. Usually, U is not equal to 1 and the more difference there is, the more the particle size varies within the soil sample.
To obtain D10 and D60 , find the points where the PSF-curve intersects the horizontal lines which correspond on the left vertical scale to the cumulative percentages of 10 and 60 percent respectively.
Example
Note: the more vertical the PSF-curve (U closer to 1), the more uniform the soil sample.
