![]()
![]()
![]()
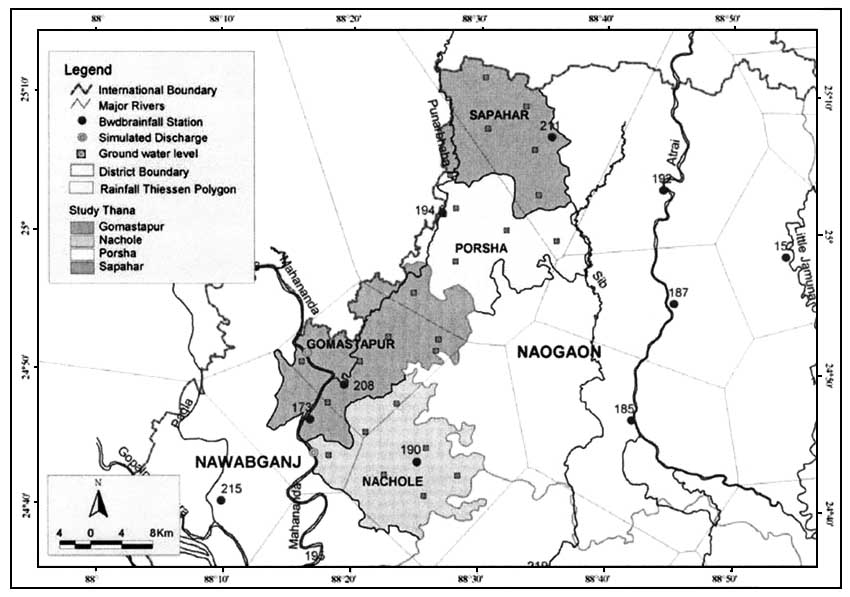
The study area is situated in the Northwestern region of the country at 88o10’–88o40’longitude and 24o40’-25o10’latitude. It covers the part of Naogaon and Chapai-Nawabganj districts of the region. The study areas are mainly bounded by the Punarbhava and Mohananda river in the west and Sib-Barnai river in the eastern side of Porsha upazila. The location map of the study area is shown in the figure below.
Figure 3-1. Location map of the study area
To analyze the physio-geographic nature of the study area, different secondary data and information is collected. The National Water Resources Database (NWRD) is mainly used for different types of spatial and temporal data layers. NWRD holds information from different agencies, those who are involved in the collection of primary data. Primary data is analyzed for the present study to look in to the different physical properties along with hydro-meteorological parameters. Different model results are used from the secondary sources for describing the hydrological characteristics of the area. Mainly ground water resources and surface water flow information are reviewed from Groundwater model results of WARPO and MIKE11 model results of NWMP. The drought severity in the areas is also investigated using the Drought Assessment framework (DRAS) for T Aman crop during the Kharif season on average year condition.
The table below describes the data and information gathered from the agencies along with the period of data availability. Figure 3-1 shows the location of hydro-meteorological stations used for analysis and representation of other geophysical features of the study area.
Table 3-1. Data interpreted for describing the geo-physical characteristics of the study area
| Data Layer | Data Source | Period of data | Parameter Observed | Station Investigated |
| Meteorological parameters | BMD | 1960–2002 | Temperature, Wind speed, Humidity, Sunshine | Dinajpur, Rajshahi |
| Rainfall | BWDB | 1960–2000 | Rainfall Pattern | Gomastapur, Mohadevpur, Nachole, Nazirpur, Chapai-Nawanganj, Rohanpur, Sapahar |
| Groundwater | BWDB/ WARPO | 1960–2001 | Groundwater Depth | NAO046, NAO051, NAO501, NAO502, NAO505, NAW002, NAW004, NAW005, NAW006, NAW007, NAW008, NAW011, NAW508, NAW509 |
| Lithology | BWDB | - | Subsurface geology | GL7037007, GL7037002, GL7056011, GL7056015, GL7056014, GL7056012, GL6479003, GL6479006, GL6479004, GL6486001, GL6486007, GL6486005 |
| Surface water | BWDB/ NWMP | 1965–2003 | Surface water flow | Rohanpur, Mohananda |
The general topography of the study area is ranges from 15 to 50 meter Pwd (Figure 3-2). The Barind area is mainly high comparatively than the other part of the flood plains. The western side of the study area is composed of flood plain soil, which is depressed area and inundates from average year flooding due to spillage of riverbanks.
The study area is mainly constituted by four major physiograpy. These are High Barind Tract, Level Barind Tract, Lower Punarbhava Floodplain and High Ganges River Floodplain. High and Level Barind Tract covers most of the study area (75%), mainly in the central part of the upazilas. Lower Punarbhava Floodplain covers only 12% of the study area in the western side and High Ganges River Floodplain covers 13% in the Gomastapur and Nachole upazila. Figure 33 shows the major physiography of the study area.
Figure 3-2. General Topography (DEM)
3.4.1 Nachole Upazila
The area is constituted by two major physiography: Barind Tract and Ganges River Floodplain. The Ganges floodplain soil is on the western side of the upazila covering 9% and the 91% of the area is occupied by Barind soil. Generally High Barind area is not flooded in the rainy season, but Level Barind area is subjected to inundation upto 90 cm and stayed a maximum of 1–2 months under water during monsoon season. The Ganges floodplain mainly covers highland and some beel areas. The beel areas are generally inundated from slight to moderate depth during the monsoon.
3.4.2 Gomastapur Upazila
Gomastapur upazila is mainly constituted by four physiography. These are Barind Tract, New and Old Ganges Floodplain and Punarbhava floodplain. Around 47% of the Upazila covers the Barind area. It is generally 2 to 5 meter higher and older deposit than the floodplain soil. These areas are normally free from floods except some lower patches inundated to shallow depth. New Ganges floodplain (2.8%) is almost flat in nature with some highland. Highland is not flooded during the monsoon. Old Ganges floodplain (26.1%) is consisting of medium high to high land and Beel area. Punarbhava floodplain (13.4%) is on the northwestern side of the upazila and comprises of flat and deep Beel areas. The Beels are connected with the river and the area is flooded moderate to deeply during monsoon season.
3.4.3 Porsha Upazila
Porsha upazila is mainly comprised of two major physiography: Barind Tract and Punarbhava Floodplain. Around 75% of the land is constituted by Barind soil and the rest is by the deposit of Punarbhava floodplain soil. The Barind Tract is generally 2 to 4 meter high than the floodplain, which is again divided into two types of land: High Barind and Level Barind Tract. High Barind area is not normally flooded but Level Barind area flooded upto 90 cm of depth and inundated from 1 to 2 months time in an average monsoon season. The Punarbhava floodplain is almost flat land. A large number of Beels and water bodies are found in the area, which is generally flooded from shallow to deep during the monsoon season.
3.4.4 Sapahar Upazila
The upazila is mainly covered by two major physiograpy: Barind and Teesta Floodplain. The Barind area covers 74.6% of the upazila. It is mainly consists of wide flat terrace and valley areas. Barind area is generally 1 to 2 meter higher than the floodplain and relatively older deposits. Normally valley separates the trace areas, which helps in draining out the water naturally. High terrace and valley areas are free from flooding but lower areas are subjected to flooding in the monsoon season. Teesta floodplain (15.4%) is mainly constituted by Highland and Beel area. High lands are not flooded, but low land and Beel areas are flooded during the monsoon season.
The major soils of the study upazilas are Clay-Clayey loam and Loam soils. Clay-Clayey loam-Loam soil (98%) dominates the area with a small portion of Sandy loam (2%) soils. The top and sub soil is generally Clay to Loam and substratum is dominantly Clay soil. Table 3-2 shows the drainage characteristics of the study area. The internal drainage characteristic of the soil is generally imperfectly drained i.e. water seepage from the soils at a slower rate and normally water does not stand on the surface for more than 15 days, but sopping wet in the rainy season. Surface water drains out during the month of mid September to October, and land is paced for cultivation for Rabi crops. The general characteristics of the soils in the selected upazilas are shown in Tabular format in Annex A. It describes the soil characteristics by series depicting the geo-physical parameters by land types and soil depth.
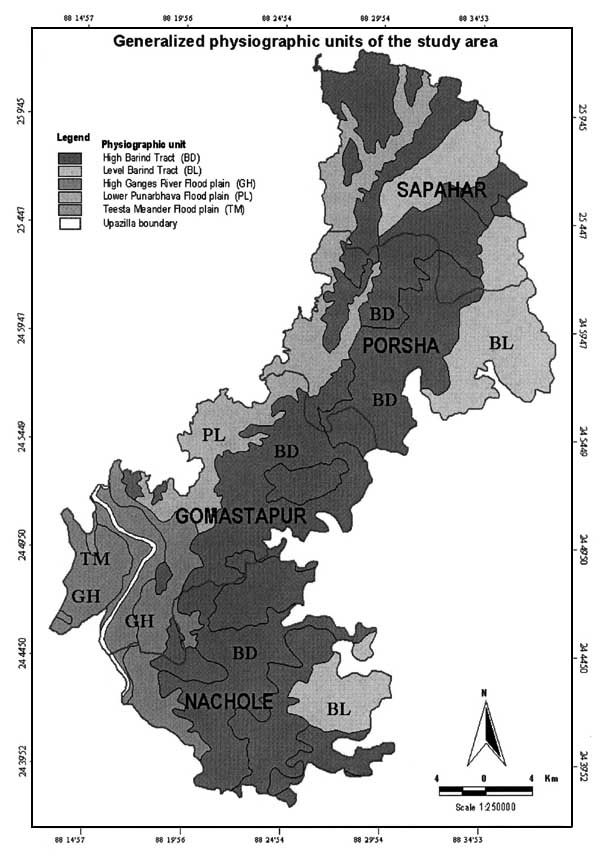
Figure 3-3. Major physiography of the study area
Table 3-2. Drainage classification of the study area in percentage
| Upazila | Drainage Class | Surface drainage | |||||
| IPD | POD | VER | NOR | ERL | LAT | VLT | |
| Nachole | 92 | 8 | 89 | 1 | 5 | 5 | - |
| Gomastapur | 71 | 29 | 65 | 2 | 12 | 16 | 5 |
| Porsha | 83 | 17 | 81 | - | 2 | 3 | 14 |
| Shapahar | 83 | 17 | 82 | - | 1 | 3 | 14 |
IPD=Imperfectly drained,
POD=Poorly drained,
VER=Very early,
NOR=Normal,
ERL=Early,
LAT=Late,
VLT=Very late
Subsurface lithology is the prime parameter to delineate extent and thickness of aquifer. A number of borelog information is available in the study areas, which are drilled by BWDB, BADC and BMDA. The logs cover a depth ranges from 40m to 300m in different location. Most of the borelogs identified in the Porsha and Saphar upazila shows that the properties of upper layer is of plastic clay upto 30m and in the lower part it is consists of coarse to fine sand. Plastic clay are sedimentary in origin. Old rivers and streams washed kaolinite (formed from decomposed granite) from its parent rock. As the streams flowed from upland areas the kaolinite mixed with other clay minerals, sands, gravels and vegetation before settling in low-lying basins to form overlaying seams of plastic clay.
Brown clay with silt is observed in the Gomastapur and Nachole upazila mainly in the upper layer and medium to coarse sand is found in the lower part. Topsoil of the area is mainly composed of clay material indicating low percolation rate as well as low moisture holding capacity. Recharge characteristics is also poor in the study area due to slow percolation rate from soils. Some of the borelogs of the study area is presented in Annex A.
Climatic parameters are investigated in the study using the temporal data from BWDB and BMD. Rainfall distribution along with its pattern is shown from long time series data of 1960–2000. Climatic factor such as humidity, sunshine, wind speed and temperature data is analyzed using the time series data and trend is generated. The stations are selected on the basis of Theissen polygon method using GIS application.
There is little variation of climatic parameters in the study area. The climatic parameters of the study area are presented in the Table in Annex A. The mean annual total rainfall varies from 1400–1500 mm in the study area. But the dry season rainfall is only 18%–22% of the mean annual rainfall. Annual total evapo-transpiration in the study area varies from 1245–1350 mm.
The mean annual temperature is around 250 C and mean minimum and maximum temperature varies from 16–350 C. High temperature is generally observed in the month of April and May and lowest in the month of January. The recorded maximum highest temperature is observed as high as 440 C and as low as 40 C. Trend of temperature shows that the high temperature is increasing in the recent decades. The rate of change of temperature is almost same upto 1982 and after that the temperature variation is very high as shown in Figure 3-4.
Figure 3-4. Annual temperature variation in the study upazilas

Mean humidity is around 72% and sunshine hour ranges 6.5–7 hrs in the study area. Mean wind speed is around 90kpd and high wind speed (155kpd) is observed in the month of May and June.
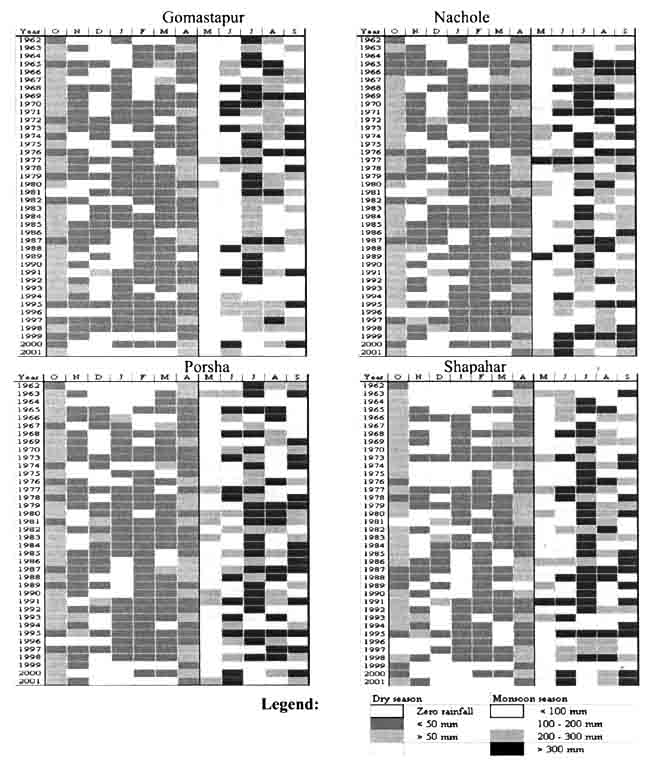
Rainfall distribution of the study area shows that annual total rainfall in the study area is almost similar in nature and long-term trend is not prominent. The long-term rainfall distribution and trends is shown in Figure 3-3 to 3-5.
In all the selected upazilas, the monsoon rainfall shows an increasing trend except Gomastapur. In Gomastapur the trend of rainfall is little bit low. The dry season rainfall is almost similar and no prominent change is observed. The distribution of non-rainy days over the year is not also visible prominently, but the amount and distribution of rainfall is changing over the years.
Table 3-3 shows the amount of annual total rainfall in different months of the year.
Figure 3-3 to 3-5. Rainfall trend in the study upazilas
Table 3-3. Monthly total rainfall and its distribution in the study upazila
Rainfall plays an important role in mitigating the drought if it is distributed uniformly over the season. The rainfall excess and deficit could be helpful to look at the position of drought susceptibility in the study area. The difference between mean seasonal and dependable rainfall shows the variation between the expected and mean values. Table 3-4 shows the agriculture crop water demand (ET) and total rainfall distribution in the study areas for two different seasons. It shows that the water deficit exists in the dry months of the year, as the demand is higher than the total rainfall. During dry season, the rainfall meets only 50% of the ET requirement in the study area.
Table 3-4 . Seasonal balance of rainfall excess and deficit (mm)
| Season | Parameter | Nachole | Gomastapur | Porsha | Sapahar |
| Monsoon season (June – October) | Rain (R) | 1174 | 1150 | 1213 | 1176 |
| 80% Dependable Rain (DR) | 607 | 494 | 630 | 599 | |
| ETo | 588 | 588 | 578 | 558 | |
| R - ETo | 586 | 562 | 636 | 618 | |
| DR - ETo | 19 | - 94 | 52 | 41 | |
| Dry season (November – May) | Rain (R) | 349 | 267 | 289 | 282 |
| 80% Dependable Rain (DR) | 57 | 53 | 74 | 58 | |
| ETo | 757 | 757 | 733 | 687 | |
| R - ETo | - 409 | - 491 | - 444 | - 405 | |
| DR - ETo | -700 | - 705 | - 660 | - 630 |
During monsoon, the available rainfall may fulfill the crop water demand but during the dry season deficit is large to meet the demand. The demand is creeping during the dry months of the year and maximizes in May (Figure 3-6). The figures show that the dry season deficit is very high where as during the wet season, surplus rainfall is observed in all the four study areas. So to meet the crop water demand for the study area alternative sources are needed to investigate.
Figure 3-6. Water Deficits in the study area (Annual mean rainfall and ET condition)

As the study area covers mostly high land to medium high land, it is non-flooded during the average flood year. All the upazilas have large percentage of non-flooded areas except the Gomastapur upazila. Low-lying areas of the Gomastapur upazila are generally flooded from the Punarbhava and Mohananda river each year. Different areas are flooded with different degrees of inundation. Table 35 below shows the depth of inundation in the study upazilas. Around 5%–20% area goes under 90 cm to 180 cm of flooding and 80% of the area is non-flooded during average monsoon season. The area elevation curve generated for each upazila from the Digital Elevation Model (DEM) shows similar land type pattern.
Table 3-5. Flooding situation in average year condition
| Upazila | Non-flooded area (%) | Flooded area (%) | |||
| F0 < 0.3 m | F1 0.3 – 0.9 m | F2 0.9 – 1.8 m | F3 1.8 – 3.0 m | F4 > 3.0 m | |
| Sapahar | 81.7 | 6.9 | 10.5 | 0.9 | - |
| Porsha | 81.0 | 2.0 | 3.0 | 14.0 | - |
| Gomastapur | 65.0 | 12.0 | 6.0 | 12.0 | 5.0 |
| Nachole | 89.0 | 6.4 | 3.2 | 1.4 | - |
Source: SRDI
The main surface water sources of the study areas are Mohanada and Punarbhava river. The monsoon flow volume of the two rivers is sufficient enough to mitigate the agricultural demand of crops. But during dry season, the flow reduces appreciably and it is difficult to mitigate the potential suitable areas with the available resources. The long-term annual minimum flow describe that the volume of water in the rivers is reduced alarmingly over the years.
Figure 3-7. Minimum river flow of Mohananda and Punarbhava river

Groundwater level data is analyzed to assess the groundwater situation during different months of the year. Data has been analyzed from 1960 to 2000. The depletion of groundwater table in the study area shows a remarkable draw down from early eighties. The groundwater table hydrograph is drawn from a selected number of wells in the study area. The mean ground water table in Nachole area shows that it was within 3 to 10 meter from the surface during 1980’s. Groundwater is depleted more than 8 meters during the last ten years and recent trend shows the rate of depletion is much more prominent. During the dry season the ground water table depleted down to 14–20m in Nachole and Gomastapur upazila, whereas in Porsha and Sapahar upazila, the ground water table is within 6–10m.
Figure 3-8. Groundwater depth from surface of the study area

Groundwater resources estimated by NWMP shows that the resources are constraint for irrigation from the upper aquifer layer. Assuming 50% irrigation development potential, the most of the area will go under deep irrigation system. Only low lying areas of Porsha upazila can be under irrigation facilities from the DSSTW within 9 meter of the ground. But under full irrigation development condition, the groundwater table will go further deep and DTW irrigation system is required, as the ground water will be depleted below suction limit of DSSTW and other modes.
Table 3-6. Groundwater development potential by irrigation mode
| Upazila | 50% Development Level | 100% Development Level | ||||||||
| ET-ER | F0 | F1 | F2 | F3 | ET-ER | F0 | F1 | F2 | F3 | |
| Sapahar | 119 | DTW | DTW | DTW | DTW | 476 | DTW | DTW | DTW | DTW |
| Porsha | 117 | DTW | DTW | DSSTW | DSSTW | 410 | DTW | DTW | DTW | DTW |
| Gomastapur | 189 | DTW | DTW | DTW | DTW | 528 | DTW | DTW | DTW | DTW |
| Nachole | 205 | DTW | DTW | DTW | DSSTW | 486 | DTW | DTW | DTW | DTW |
Source: NWMPP, 2001
(ET-ER) - Groundwater demand for irrigation in mm/unit of gross area
DP4 - Groundwater model simulation with different deep percolation rates for different types of soils. DP4 has been adopted in recognition of residual uncertainties in the parameter reconstruction.
Irrigation development in the selected upazilas show that the both surface and groundwater irrigation practices increased appreciably from 1980’s to onward. The temporal analysis of National Minor Irrigation Census (NMIC) irrigation census data depicts that the irrigation coverage is increased at large scale from 1985. This is due to the initiation of extensive groundwater development by BMDA in the region. Figure 3-8 shows the trend of groundwater development of the study areas. Irrigation practices in the Porsha upazila are highest and in Nachole upazila is the lowest. Depletion of groundwater table in Porsha upazila is within the suction limit of STW/DSSTW whereas in the Nachole upazila, the groundwater depletion is more than 20 meters from the ground, which is beyond DSSTW suction limits (Figure 3-9).
Figure 3-9. Groundwater development in the selected upazilas
Figure 3-10. Groundwater depletion and irrigation development trend in the selected upazila
 |  |
 |  |
A number of perennial water bodies are observed in the study area, which is used as an alternative source of irrigation water during the dry periods. Beels are large water bodies, which are generally connected to the rivers during monsoon seasons. Stored water in the beels is used for irrigation in almost all the upazilas. Even in the rabi season, the beel area goes under cultivation.
Table 3-7. Surface water bodies in the study area1
| Type of Water Bodies | Number | Area (ha) | Uses for Irrigation (%) | Cultivated crop at Rabi Season (%)70 |
| Nachole: Beel | 13 | 300 | 30 | 70 |
Dighi | 19 | 25 | 50 | - |
| Gomastapur: Beel | 19 | 588.94 | 100 | 95 |
Dighi | 2106 | 522.9 | 80 | 10 |
| Porsha: Beel | 11 | 60.19 | 30 | 100 |
Dighi | 5 | 22.67 | 20 | - |
| Sapahar: Beel | 1 | 400 | 50 | 75 |
Dighi | 1200 | 350 | 75 | - |
Source: DAE, 2004.
The agricultural practices are mainly governed by hydro-meteorological characteristics of the area. The selected upazilas are mainly drought prone due to low rainfall intensity than the other parts of the country. Different types of crops are practiced depending on the suitability of the land and availability of irrigation facilities.
The agriculture practices compromises mainly three seasons in an annual crop calendar. Rabi (November – February), Kharif-I (March – June) and Kharif-II (July – October). During Karif-I season Transplanted Aus is the main crop in the area and significant amount of land left as fallow due to unfavorable distribution of rainfall. Farmers prepare their seed bed near the pond side with the help of surface water. If timely rainfall occurs, farmers transplanted the T. Aus crop in the field, otherwise the land remains fallow. Kharif-II season is dominantly a rainfed T Aman is practice as a major crop and covered 70–90% the area. Mainly drought occurred during transplantation, flowering and grain development stage of T Aman crop. During Rabi season, a small amount of land is irrigated with high yielding Boro where ground water irrigation facilities is available and 10-15% of cropped area covered by wheat, mustard, pulses and other types of vegetables where surface water is available. The pie chart in Figure 3-11 shows the present agriculture practices in the study area where major portion is covered by rice crops.
Figure 3-11. Present agricultural land use of the selected study area
In the study area, permanent fallow land is very high especially in the Sapahar and Gomastapur upazila due to suitability of land. In Sapahar upazila around 30% of the NCA is currently fallow.
Single cropped area is about 66% in Porsha and 46% in the Sapahar upazila. Double cropped area is high (62%) in the Gomastapur upazila and triple cropped area is very high in the Nachole upazila. The variability of cropped area coverage in the study upazilas is due to the existing irrigation facilities in place. The average cropping intensity in Nochole and Gomastapur upazila is about 205% and 192%, which is greater than the average cropping intensity (177%) of Bangladesh (BBS 2000–01). Cropping intensity in Porsha and Sapahar upazila is less than the national average values as shown in Table 3-8.
The trend of Aman and Boro crop is shown in this report compiling the area and production from the district level BBS census. Since upazila level information is not available, district level data has been used and prorated to derive the trend at upazila level. The trend shows that the area of Boro cultivation is increasing for all the study upazilas, but the Aman cultivation is almost stagnant over 30 years time. Figure 3-12 shows a sample upazila with the trends of major rice crop production.
Table 3-8. Agricultural land use of the selected study area
| Land use | Nachole | Gomastapur | Porsha | Sapahar | ||||
| Area (ha) | % of NCA | Area (ha) | % of NCA | Area (ha) | % of NCA | Area (ha) | % of NCA | |
| Permanent Fallow Land | 1182 | - | 4602 | - | 2912 | - | 3500 | - |
| Current Fallow | 100 | 0.38 | 85 | 0.31 | 492 | 2.09 | 5655 | 30.26 |
| Net Cultivable Area (NCA) | 26270 | - | 27125 | - | 23530 | - | 18685 | - |
| Single crop | 6896 | 26.25 | 6172 | 22.75 | 15618 | 66.37 | 8710 | 46.61 |
| Double crop | 11203 | 42.65 | 17000 | 62.67 | 6412 | 27.25 | 6783 | 36.30 |
| Triple crop | 8171 | 31.10 | 3953 | 14.57 | 1500 | 6.37 | 3192 | 17.08 |
| Total crop land | 53815 | - | 52031 | - | 32942 | - | 31852 | - |
| Cropping Intensity (%) | 205 | - | 192 | - | 140 | - | 170 | - |
Source: DAE annual report 2004.
Figure 3-12. Growth of area and production of major rice crops
The DRAS model is utilized in identifying and classifying the drought severity that takes place for T. Aman crop. T. Aman crop is grown in the monsoon season (July to October) when the rainfall is high. Inadequate rainfall during the flowering stage of the crop is a primary factor governing the yield of crop. Farmers generally depend on rainfall for T Aman production and any delayed rainfall intensity puts the crop in a stress condition. This ultimately reduces the yield level of the crop. On the basis of the yield reduction of the crop, the drought classification has been made. In average year condition, the drought severity has been observed for the selected study areas. The map below (Figure 3-13) shows that the drought severity is high in Gomastapur upazila mainly in Ganges flood plain soil and moderate in the level Barind area. But Sever drought has been observed in the major part of the other three upazilas where 30–40% of the yield reduction is expected in an average year condition.
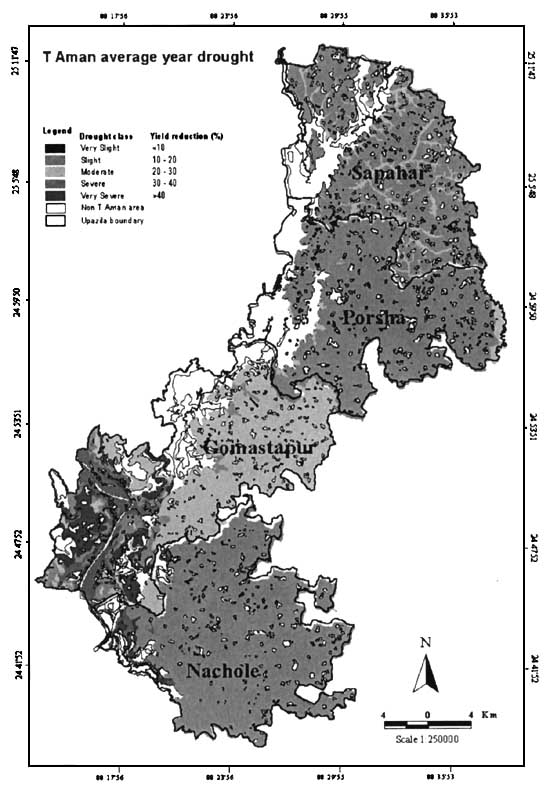
Figure 3-13. Output of drought mapping exercise through DRAS
![]()
![]()
![]()