The increase in dairy imports into sub-Saharan Africa
Some potential influences
Some possible effects of increased dairy imports
[* The author gratefully acknowledges S. Sandford for initially stimulating this study on dairy imports and for providing his valuable advice throughout the process of the work. W. Krostitz, FAO, Commodities and Trade Division, provided the basic trade data which Tibebu Derbie compiled for further analysis. D. Light is to be thanked for his major contribution to the computerized calculations. S. Sandford and J. McIntire were of great help with their comments on an earlier draft, while the sole responsibility for any of the results and their interpretation in this paper rests with the author alone.]
1.01. The existence of imports as such - be they rising or decreasing over time - should not be a source of unease. Economic theory provides some very clear arguments to show the welfare-enhancing character of import-export policies that make the best use of comparative advantage. However, there tends to be more concern over imports of basic foods. Governments hesitate to expose themselves and their countries to the uncertainties of highly volatile international markets in basic products particularly foodstuffs, whose supply can affect political stability. Moreover, imports have to be offset by equivalent exports to even out foreign exchange payments. If both these factors raise concern, i.e. if a country faces an increasing dependence on imported food at a time of acute or latent shortage of foreign exchange, then imports may pose severe problems.
1.02. Milk and milk products are important ingredients in a nutritionally balanced diet and their relative importance increases as diet becomes poorer. Butter, dry whole and dry skimmed milk, cheese and curd, condensed and evaporated milk, and to a limited extent fresh cow's milk are traded internationally, whereas milk from sheep, goats, camels and products appear only on local African markets. Over the last decade, there has been a tremendous increase in the volumes and values of dairy imports into sub-Saharan Africa.1/ Yet, in most of the countries concerned, there has been a chronic shortage of foreign exchange. Given the importance of dairy products, both for human consumption and as a source of farm income, the question arises as to the cause and effects of this development. There is a considerable amount of basic literature on the theory of international trade and food policy (see for example Heidhues, 1979 and Oyejide, 1983) and studies into the related problem of cereal imports and policy reactions (McIntire, 1981; Morrison, 1984; and Huddleston, 1984). However, there has been no study of dairy imports, especially those into sub-Saharan Africa (see also Eicher and Baker, 1982).
[1/ The term 'sub-Saharan Africa' excludes Algeria, Canary Islands, Egypt, Libya, Morocco, Tunisia and W. Sahara as well as Namibia and the Republic of South Africa. It includes Comoros, Reunion and Seychelles. This distinction is made according to geopolitical factors and also reflects ILCA's area of mandate (see App. 1).]
1.03. This paper examines the problems posed by dairy imports for the whole of sub-Saharan Africa and, more specifically, for particular regions and countries. Some factors which have influenced this development, and their possible effects are explored and discussed (Part One). The role of national policies, i.e. their objectives, what they can achieve, and their present effects, is dealt with in Part Two. The final section (Part Three) outlines what further research and the possible contributions of policy makers can do to improve the situation. Within this framework no effort will be made to analyze in detail the development and policies of particular countries. This kind of in-depth country case studies will be covered in future research.
1.04. Commercial imports of dairy products into sub-Saharan Africa have increased steadily since 1960. According to FAO Trade Yearbooks they rose in value from $ 43 million to $ 113 million from 1960 to 1970 and then doubled three times within the next decade to more than $ 680 million in 1980.1/ This increase continued until 1981 ($ 707 million) but seems to have come to a halt in 1982 and 1983 (see figure 1). In 1980, sub-Saharan African countries spent approximately 5% of their total revenues from agricultural, forestry and fishery exports to cover their imports of dairy products.
[1/ Unless otherwise indicated all figures are calculated as net imports i.e. imports less exports of dairy products.]
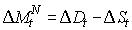
In volume terms the situation does not look much brighter since only 20% of the total change in value can be attributed to any change in prices (calculated in whole liquid milk equivalent (ME), see App. 2). 43% are due to the mere volume effect and 37% are explained by the combined effect of increase in prices and values.2/ Milk in fresh, dry or condensed form3/ made up two-thirds of total dairy imports in 1960 but accounted for almost 90% in the years since 1970. This indicates a change from imports of more luxury items, such as cream, yoghurt or cheese, to imports of the more basic dairy products.
[2/ The formulae calculate the price effect as,
the volume effect as

and the price/volume effect as
which add up to 1.
3/ Referring to SITC - Code 022 in FAO Trade Yearbooks.]
Figure 1: Value of net dairy imports into sub-Saharan Africa ($ million)
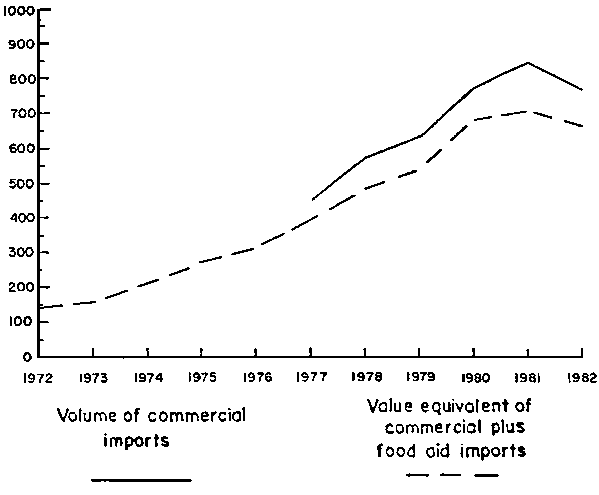
Figure 2: Volume of net dairy imports into sub-Saharan Africa by region
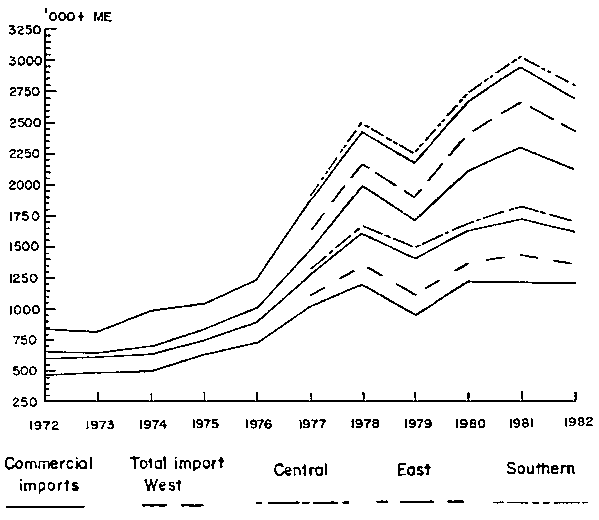
Source: Own calculation based on FAO Trade Yearbooks and FAO, 1984a
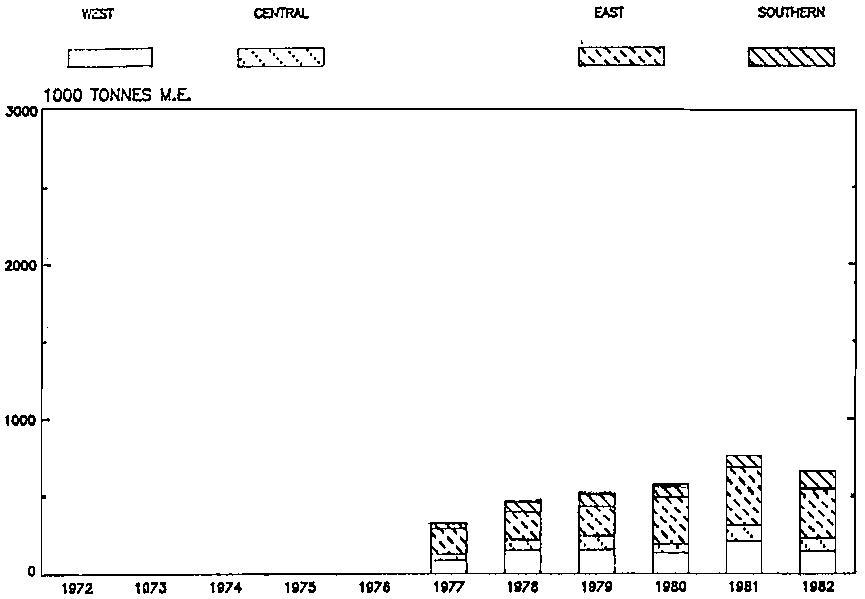
1.05. Before these figures are broken into regional groupings, countries and commodities, the role of non-commercial imports of dairy products, i.e. in the form of food aid, must be mentioned. The major items of food aid are skim milk powder and butter-oil which can be recombined to form liquid milk. In 1981 sub-Saharan African countries received, as food aid, a total of about 88,000 t dried skim milk, and 9,000 t each of butter-oil and other dairy products (FAO, 1984a) equalling almost 770,000 t of liquid milk equivalent. These deliveries are often provided free of charge but sometimes the recipient country has to contribute to shipment and/or distribution costs. Valued at current prices of commercial imports (c.i.f.) dairy food aid to sub-Saharan Africa was equivalent to almost $ 140 million, or 16% of the total value of commercial and food aid dairy imports in 1981 (see figure 1 ).1/
[1/ Butter-oil has been valued at 1.2 times the c.i.f. price for butter according to the price ratio set for the GATT minimum prices (GATT, 1983). "Other Dairy products" have been valued with the price of condensed milk. A weighted regional average has been used for those countries and commodities where no price for commercial imports for the respective year is available.]
Detailed statistics are available for food aid during the period 1977 to 1981. In this time food aid increased by almost 140% in milk equivalents (ME) against an increase of 43% for commercial imports. On average the share of food aid in total dairy imports (in ME) rose from 22% in 1977 to 33% in 1981 and almost 30% in 1982. Both the quantities of dairy products imported commercially and as food aid, have to be considered when the effects of imports on domestic prices, production and consumption are analysed. However, since food aid can be given in various forms, e.g. as part of projects with special conditions attached to its utilization or as a direct contribution to domestic supplies, its precise effects have to be carefully analysed on a per country basis and according to the conditions of the donation. A few more details will be given below when the figures for sub-Saharan Africa are dealt with more specifically.
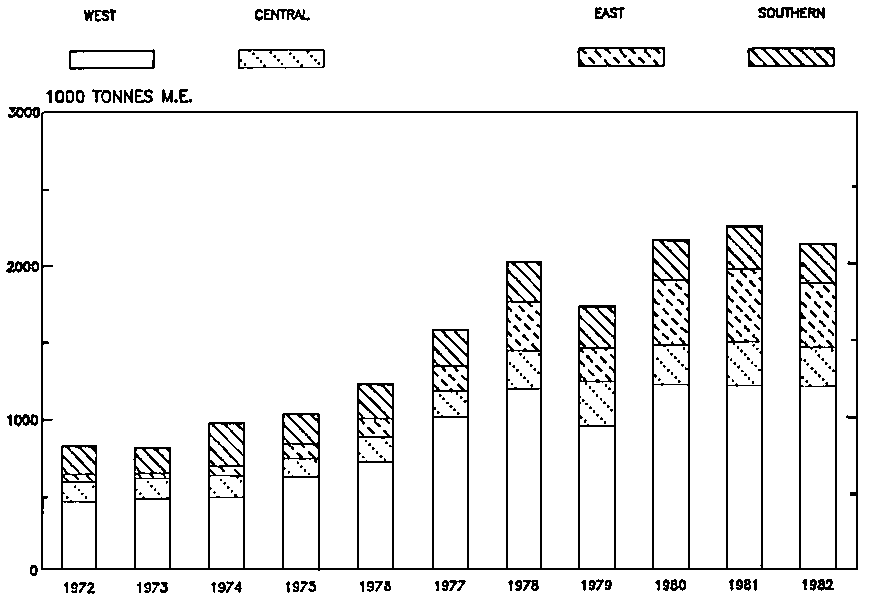
1.06. It would be of interest to break down the statistics by ecological zones, but unfortunately no data are available. Instead, all sub-Saharan African countries have been grouped into four regions, i.e. West, central, East and southern African countries (see App. 1). As can be seen from figure 2 and 3 and Appendix 3, the West African countries have held the biggest share with about 55-66% of all commercial imports. The remaining three regions now share the other 40% more or less equally among themselves although East Africa has increased its share from about 5% to 20% in the last decade. With regard to food aid a different pattern emerges. East Africa receives almost half of all deliveries to sub-Saharan Africa (fig. 4) whereas the share of West Africa fluctuates between one-fourth and one-third of the total. Some additional information can be obtained by comparing the respective volumes of dairy imports per head of population between the regions. As can be seen from table 1, only in southern Africa has the volume of commercial dairy imports per caput been roughly stable from 1972 to 1982. East Africa showed the biggest increase in commercial imports from 0.62 kg/head in 1972 to 3.87 kg/head in 1982. Combined food aid and commercial dairy imports have, on a per capita basis, grown by 104% between 1977 and 1982 in East Africa. With a total of 8.77 kg/head West Africa imports most dairy products per head.
Figure 3: Commercial dairy imports into sub-Saharan Africa by region
Source: FAO Trade Yearbooks
Figure 4: Dairy food aid into sub-Saharan Africa by region
Source: FAO, 1984a
Table 1: Net dairy imports per head of population into sub-Saharan Africa by region (kg ME)
|
YEAR |
TYPE |
WEST |
CENTRAL |
EAST |
SOUTHERN |
SUB-SAHARAN AFRICA |
|
1972 |
Commercial |
4.12 |
2.71 |
0.62 |
5.25 |
3.00 |
|
Food aid |
n.a. |
n.a. |
n.a. |
n.a. |
n.a. |
|
|
Total |
n.a. |
n.a. |
n.a. |
n.a. |
n.a. |
|
|
1977 |
Commercial |
7.59 |
3.18 |
1.70 |
5.91 |
4.91 |
|
Food aid |
0.71 |
0.81 |
1.60 |
0.82 |
1.00 |
|
|
Total |
8.30 |
3.99 |
3.30 |
6.73 |
5.91 |
|
|
1982 |
Commercial |
7.78 |
4.29 |
3.87 |
5.52 |
5.78 |
|
Food aid |
0.99 |
1.36 |
2.86 |
2.36 |
1.77 |
|
|
Total |
8.77 |
5.65 |
6.73 |
7.88 |
7.55 |
Source: Own calculation based on World Bank, 1983 and App. 3.
1.07. The dependence on commercial dairy imports and food aid is best illustrated by comparing them with total milk consumption, i.e. total domestic milk production plus total dairy imports. However, in general milk production data for African countries are not very reliable. Still, the changes in import - consumption ratios may be used, if interpreted cautiously. They are presented in table 2.
Table 2: Share of commercial, food aid and total imports (ME) in total milk consumption by region
|
YEAR |
TYPE |
WEST |
CENTRAL |
EAST |
SOUTHERN |
SUB-SAHARAN AFRICA |
|
1972 |
Commercial |
.26 |
.33 |
.01 |
.23 |
.11 |
|
Food aid |
n.a. |
n.a. |
n.a. |
n.a. |
n.a. |
|
|
Total |
n.a. |
n.a. |
n.a. |
n.a. |
n.a. |
|
|
1982 |
Commercial |
.41 |
.39 |
.07 |
.25 |
.21 |
|
Food aid |
.05 |
.13 |
.06 |
.10 |
.06 |
|
|
Total |
.46 |
.52 |
.13 |
.35 |
.27 |
Note: Consumption is calculated as all liquid milk production plus total imports. Production figures are the respective 3 year averages.
SOURCE: Own calculation based on FAO Production Yearbook and App. 3.
The overall dependence on dairy imports is highest in West and central Africa with imports comprising around 50% of total consumption. In East Africa local milk producers provide most of the region's consumption but the absolute increase in the ratio between commercial imports and consumption between 1972 and 1982 was as big for East Africa as for the Western part. Furthermore, East African countries are proportionately more dependent on food aid. In two-thirds of such countries food aid comprised 40% or more of total dairy imports in 1982, whereas in other regions less than two out of five countries fall into this category (see App. 4). Five out of the 45 sub-Saharan African countries depend on food aid for more than 50% of their total dairy imports. For these countries precise figures would have to be used to calculate whether specific groups within populations are markedly more dependent than others on such aid shipments. Part Two will provide more information including the extent to which national policies influence the distribution of food aid.
1.08. It is clear, however, that for a country like Somalia where dairy food aid provides 25 kg ME/head of population and total dairy imports about double that amount, there is an alarming state of dependence. Subject to the earlier proviso about unreliable production data, it is evident that sub-Saharan Africa cannot easily, or quickly meet its entire milk demand from domestic supplies. Before the factors that may have caused this development are discussed, the similarities between those countries which are most dependent on dairy imports are described.
1.09. Some indicators have been selected to describe these countries namely:
- total dairy imports per caput,
- the share of urban in total population,
- Gross National Product (GNP) per caput,
- the share of commercial in total dairy imports,
- the share of dairy imports in total cow milk consumption,
- the value of commercial dairy imports compared with the value of all merchandise exports,
- total milk consumption per caput, and
- the calorie supply per capita compared to the theoretical requirement.
Appendix 4 provides most of this data and, where possible, indicators have been plotted in pairs for each country with the implicit assumption that a relationship exists between some of them (see App. 5-10). It emerges that in many countries with a high level of food aid, we also find a high total calorie supply compared to the theoretical requirement. Simultaneously, the proportion of commercial to total dairy imports is high and the absolute level of dairy consumption per caput is rather low (App. 5, 6 and 7). A high share of commercial in total dairy imports is accompanied in many cases by a low milk consumption per caput, but by a higher share of urban to total population and by a higher GNP per caput (App. 8, 9 and 10). These similarities, however, must be interpreted with much caution, since the proviso made earlier about the quality of much of the data also applies here. The fact that just one observation per. variable and country has been used also forbids any further conclusion.
1.10. Though limited in its explanatory power the above exercise provides some insights into particular countries' dairy imports. Several groups of countries show similar combinations of the above indicators. To begin with, there are nine countries, i.e. Benin, Congo, Ghana, Ivory Coast, Liberia, Nigeria, Sierra Leone, Togo and Zaire with less than 20 kg milk consumption per caput who import more than 60% of their requirement (see App. 7). These countries are highly dependent on dairy imports. However, except for Ghana and Sierra Leone, all meet at least 90% of the total calorie requirement of the population (see App. 5), i.e. dairy imports do not play a crucial role in overall nutrition in these countries. Ghana and Sierra Leone, with lower nutritional standards are not only dependent on dairy imports but more than 30% of these imports are food aid. Benin, the Central African Republic, Lesotho and Somalia show the somewhat atypical feature of a high share of dairy food aid in total milk consumption. For the majority of countries the proportion of dairy food aid decreases with a rising share of total dairy imports in total consumption (see App. 6).
1.11. The Congo, Ivory Coast, Liberia and Nigeria have been grouped as highly import-dependent yet with a relatively low per caput consumption. However, they all have comparatively high average incomes, i.e. their GNP per caput exceeds $ 400, and meet their requirements for dairy imports mainly with commercial imports (see App. 8 and 10). At the other extreme, almost one-third of all countries have a GNP per caput less than $300 - Burundi, Chad, Ethiopia, Malawi, Mali, Somalia, Tanzania, Uganda and Upper Volta. They receive more than 30% of all dairy imports as food aid (see App. 10). All, apart from Somalia, feature within the group of countries with more than 80% of the population living in rural areas. It is also interesting to note that the share of food aid in total dairy imports seems to decrease with increasing urbanization the opposite of what is often believed. However, this does not necessarily mean that the rural population benefits most from dairy food aims because the distribution within the countries is not known.
1.12. To summarize, a dependence on dairy imports, whether commercial or as food aid, has developed in many sub-Saharan African countries within the last decade. While import dependency can be measured in different ways three main groups of countries can be distinguished whatever the method used, albeit with some overlap between groups. First, there is a group with a high import share and a relatively low per caput milk consumption (see table 3, column:(1)). The majority of such countries, despite an average annual milk consumption of less than 20 kg per caput, have a reasonably well-nourished population (col. (2) of table 3). Four of these countries can obviously afford to pay for most (if not all) of their dairy imports since they are relatively wealthy (col. (3) of table 3). In sharp contrast, the second group of countries imports over 30% of; their dairy requirements under food aid schemes and are relatively poor (col. (4) of table 3). These third group, sharing some characteristics with the other two, can be identified as having a high share of imports in milk consumption and by receiving most of this in the form of food aid (col. (5) of table 3). these six countries are highly food aid-dependent. Appendix 11 gives the regional distribution of these countries.
Table 3: Country groups with regard to selected indicators related to dairy imports
|
Group One |
Group Two |
Group Three | |||
|
(1) |
(2) |
(3) |
(4) |
(5) |
(6) |
|
Benin |
Benin |
|
|
Benin |
|
|
|
|
|
Burundi |
|
|
|
|
|
|
Chad |
|
|
|
|
|
|
C.A.R. |
|
|
|
Congo |
Congo |
Congo |
|
|
|
|
|
|
|
Ethiopia |
|
|
|
Ghana |
|
|
|
Ghana |
|
|
Ivory Coast |
Ivory Coast |
Ivory Coast |
|
|
|
|
|
|
|
|
Lesotho |
Lesotho |
|
Liberia |
Liberia |
Liberia |
|
|
|
|
|
|
|
Malawi |
|
|
|
|
|
|
Mali |
|
|
|
|
|
|
|
|
Mauritania |
|
Nigeria |
Nigeria |
Nigeria |
|
|
|
|
|
|
|
Rwanda |
|
|
|
|
|
|
|
|
Senegal |
|
Sierra Leone |
|
|
|
Sierra Leone |
|
|
|
|
|
Somalia |
Somalia |
Somalia |
|
|
|
|
Tanzania |
|
|
|
Togo |
Togo |
|
|
|
|
|
|
|
|
Uganda |
|
|
|
|
|
|
Upper Volta |
|
Upper Volta |
|
Zaire |
Zaire |
|
|
|
|
(1) less than 20 kg milk consumption per caput; over 60% of consumption imported.(2) as (1) and over 90% of the theoretical calorie requirements are actually supplied.
(3) over $ 400 GNP per caput, food aid constitutes less than 30% of total dairy imports.
(4) less than $ 300 GNP per caput; food aid constitutes over 30% of total dairy imports.
(5) imports over 50% of milk consumption; food aid constitutes over 30% of total dairy imports.
(6) over 4 kg dairy food aid per caput.
SOURCE: Own compilation based on Appendix 4.
There is a concentration of Group One countries in the humid zones of West and Central Africa and of Group Two countries in the Sudano-Sahelian belt. At first signs it is surprising that many of the supposedly high-potential East African countries receive large quantities of dairy food aid. Even Kenya, although not shown within the second group because of its higher GNP per caput still receives 35% of all dairy imports as food aid. This topic will be dealt with below but the point here is that some differentiation between emergency food aid and those shipments that are given as part of dairy development projects seems necessary.
1.13. Some effort must now be devoted to identifying the factors and causal links that could have influenced dairy import trends. Subsequently, the effects of these trends on producers and consumers, or special groups, in their respective countries are discussed before the role of government policies is introduced in Part Two. However, in this paper no precise quantification of cause and effects will be provided since such detail can only come from analyzing the situation in single countries.
1.14. This section attempts to illuminate factors that may have influenced dairy imports into sub-Saharan African countries. An important secondary objective is to derive a theoretical background for future analysis of particular countries' dairy imports and policies. At first, there is the assumption that government policy is neutral with respect to dairy imports. Later on this assumption is dropped and the influence of different policies on some or all of the factors is discussed. Dairy imports can be regarded as any other commodity and starting from a general commodity balance identity we can define
(1),
where a country's net dairy imports within a certain period  plus its domestic production for the period
  and stocks carried over from the previous period
  equal the total milk consumption
  and the stocks carried over to the following period
 . It may be assumed here that stocks of milk and milk products either have a very short shelf-life, e.g. whole milk, or that they are constant over the years as is in the case of factory stocks of milk powder for reconstitution. Equation (1) can then be changed into
(2),
indicating that the change in net imports  plus the change in domestic production
  will always be equal to the change in domestic consumption
  at the end of a period with constant stocks.
1.15. Two approaches to explaining changes within the commodity identity in equation (2) can then be followed: First, the change in imports can be interpreted as merely balancing changes in the difference between actual domestic supply  and demand
  , i.e.
(3)
In this case, the balance of domestic supply end demand, themselves determined by specific production and consumption relationships, results in a certain amount of imports. This assumes that there are no exogenous factors directly influencing imports and hence, no specific trade policy is involved or needed to be discussed. A more complex, but also more realistic approach, goes one step further. It uses the price as the decisive variable to coordinate all activities. Supply, demand and imports are interpreted as functions of their own specific causal variables and are taken as parts of one conceptual model. At the end of any period, equilibrium results from an interaction between the price mechanism and those factors which influence imports, supply and demand. This interpretation incorporates the following relationships which will be explained below in such a way that each single factor is discussed in isolation all other things remaining equal. The relationships are explained by the following structural equations:
(4)
(5)

(6)
In equation (4) the change in demand for dairy products in a period is a function of the growth of population in that period  ; the change in the degree of urbanization
  ; the change in total available consumer income
  ; the change in the ratio between consumer prices for milk and those for other complementary or substituting consumer goods
  , and the change in preferences for the various goods on which the consumer allocates his spendings
  . Of those that are generally thought to be major factors influencing the demand side, population growth, urbanization, income and price ratios will be dealt with below.
In equation (5), the change in total domestic milk supply in a period is explained as being a function of the change in dairy production technology available to producers  ; the change in production costs
  ; the change in the ratio between effective producer prices for milk and other agricultural products the farmer can produce
  ; and a stochastic variable
  , comprising the influences of weather and of other unforseen influences. Only the changes in producer price ratios will be discussed below since a discussion of all influences on milk supply is far too complex a subject to be covered here.
The change in net dairy imports over a given time is described in equation (6) as depending on changes in foreign currency reserves  ; on the extent and conditions under which food aid in dairy, products can be received
  ; and the ratio between prices on the world markets, i.e. c.i.f. prices in an importer's and f.o.b. prices in an exporter's case, and those prices prevailing on the domestic markets
  . All three factors will be discussed briefly below.
Population Growth
1.16. In sub-Saharan Africa, population has increased by an annual average of 2.9% between 1970 and 1980 (World Bank, 1981, p.3). With all other factors remaining constant and assuming no changes in demand brought by changes in age-distribution, this would result in annual increases in milk demand of the same order. The increase in commercial dairy imports (in ME) into sub-Saharan Africa by an average of 9.9% annually during the same period (see App. 3) indicates that population growth is likely to have been a factor in this development, but not the only one.
Urbanization
1.17. Rapid urbanization is widely assumed to boost the demand for all food products in particular. Increased demand, it is argued, will have to be met by increased imports. The mechanism behind this is the change of status from one of rural subsistency to that of the non-productive urban dweller whose food demand, given the present stage of agricultural development in many sub-Saharan African countries, cannot be met by domestic supply. In other words, people may move to the cities but tine milk they used to consume cannot do so. This effect increases per caput consumption in the rural areas and (import) demand in the cities. The World Bank (1981) quantifies the process of urbanization for sub-Saharan Africa stating that "urban populations have mushroomed overall by 6 percent a year, and 8.5 percent annually for 35 major capitals" (p. 114). However, there is no calculation available to indicate to what extent this growth is actually translated into growth of dairy imports. The figures discussed in paragraphs 1.09 to 1.11 might even indicate that the influence of urbanization on dairy imports could be less than normally expected, but this will have to be analysed more thoroughly once single countries are studied.
Income
1.18. Available incomes in sub-Saharan countries, in GNP per caput, have increased by an average of 0.8% over the last ten years (World Bank, 1981 , p.3). It can be assumed that part or all of this additional income has been spent on food, and on milk products in particular. The share of the households' additional income that is allocated to milk consumption can be measured by the income elasticity of quantitative demand for milk which has been estimated at 0,63 for sub-Saharan Africa in the mid-70's (FAO, 1978a). This means that the demand for milk increases at about two-thirds the rate of the increase in total income. Solely in terms of the income elasticity of demand, an annual growth rate in milk demand of about 0.54% could be expected. However, several complications interfere because a population its composed of individuals, not averages, and high income consumers differ from those on a low income, urban from rural , and consumer preferences can change over time. However, the figure does give some indication of the relationship between income and demand for dairy products.
Consumer Prices
1.19. The effect of price changes on the demand for milk is well defined by economic theory. Rising prices for milk will, under the assumption of a normal i.e. negatively shaped demand function, lead to a decrease in demand and vice versa. The extent of any change is determined by the price elasticity of quantitative demand. Cross price elasticities which indicate the effects of changes in the prices of commodities that are complementary to or substitute for milk can also be defined. However, in practice, several problems occur. First, milk can hardly be considered a homogeneous product. Qualitative differences with regard to fat content, purity and above all freshness and taste, may well lead to substantial price differences. It is interesting to note that in many countries reconstituted milk (from milk powder and butter-oil) cannot compete at the same price with fresh milk. This will be dealt with in one of the subsequent paragraphs in more detail. Further complicating the definition of effective consumer prices for milk is the diversity of marketing channels in many countries. Often petty traders compete with cooperatives and/or parastatals and each tend to provide different services to the consumers. Thus, both the level of service and the quality of milk can have an important influence on price structures. A special problem with regard to the effect of price changes on milk demand is the role of rural producer-consumers. In a system where a significant if not dominant share of milk production is used for the farmer's own subsistence it is sometimes hard to determine what his reaction to changing prices will be. The ratio between milk and cereal prices plays and important role in this respect. Again, very little is known about the size, or even the sign (positive or negative) of the cross price elasticity.
Producer Prices
1.20. Many of the points raised above apply also to producer prices. Again, the economic parameters describing the reaction of subsistence producers are either not at all, or insufficiently known. Even overall estimates of aggregate price elasticities of quantitative milk supply are rarely available. There have been efforts to identify several non-price factors on milk supply and to establish some causal links (McClintock, 1984); however, the results are not encouraging. Only guesses can be made about what has caused the decline in African milk production per caput of - 0.4% per year between 1970-80 (see Anteneh, 1984). There is a widespread opinion that there would be a significant response from milk producers to rising prices. With regard to the effect of producer prices themselves only mere economic theory can be repeated here: milk supply will probably increase when the price-cost ratio for dairy production compares favourable with other production alternatives. There is only a modest quantity of price data and only a case study will allow us to draw further conclusions. Unsatisfying as this may be, the price mechanisms is believed to play a crucial role in allocating both demand and supply for milk.
Foreign Exchange
1.21. The availability of foreign currency to pay for imports is-one of the most direct influences on imports. In the last decade growing balance-of-payments deficits have occurred in most sub-Saharan African countries (World Bark, 1981, p. 17) and this should have curbed rather than stimulated dairy imports. However, with their buying power on the international markets severely restrained, most African countries have resorted to market interference and controls on exchange rate and currency. The figures in Appendix 4 (column 6) show the amount of foreign currency spent on dairy imports in relation to total export revenues, but by themselves they are hard to interprete. Again, the role of governments is believed to have been a decisive influence but for many countries the limit for expenditures on dairy imports does not seem to have been reached.
Food Aid
1.22. There are two reasons why dairy food aid should be a factor influencing total dairy imports. First, the decision to supply food aid to particular countries is not influenced by the market prices for milk in those countries; in this respect the availability of food aid must he considered an independent variable. Second, an offer of food aid may well change a country's demand for commercial imports by either complementing or partly substituting for it. Only some general remarks can be made about the factors which influence the availability of dairy food aid. The EEC as the most important donor for African countries, since 1979, operated within an annual target of 150,030 t of skim milk powder and 45,000 of butter-oil which is allocated to various developing countries and aid organizations or to the FAO - World Food Programme (Commission of the European Communities, 1983). There are various forms of dairy aid. The most frequent are 'Food-for-Work-Programmes' and dairy development projects with the most prominent, and presumably most successful example of these, being India's "Operation Flood" - and unconditional or 'emergency' shipments. In all cases the country has to apply for food aid, that is, a political agreement or contract is required. No overall statistics on the partition between these forms of dairy food aid received by sub-Saharan African countries is yet available. The World Food Programme is committed to dairy projects in 9 African countries (FAO/WFP, 1983) but other organizations also cover dairy development; an example is the EEC deliveries to Mali. From Appendix 3 it can be seen that the share of food aid in sub-Saharan Africa's dairy imports has increased from 20% in 1977 to 34% in 1981 (30% on average for 1980-82). The present dependence of individual countries has already been described. It is hard to foresee whether the EEC's expressed intention to cut back on dairy food aid (Economist, 1984), will stimulate commercial imports or be reflected in curbed consumption. Some may even expect a rise in African milk production due to the withdrawal of food aid and the removal of the disincentive effect sometimes ascribed to it.
International Prices.
1.23 Relative price differences between individual countries, when translated into absolute price differences by the exchange rate, is the basic mechanism behind international trade. Relative price differences are due to differing patterns in demand and supply and are relatively unchanging. However, when many countries trade in a commodity small countries have little influence on the world market price that emerges. This lack of influence of small countries certainly applies to sub-Saharan African countries and their role in the world markets for milk products. If no government interference and ample foreign exchange is assumed, the ratio between domestic and international prices determines the amount of net imports and assures the balance between supply and demand. In theory, this leads to an adjustment of domestic prices towards world market levels.
1.24. Two amendments to this basic mechanism must be made. Firsts milk and dairy products are mainly traded in processed forms. Unlike, for example, wheat where one can directly compare the import prices, c.i.f., and the price on the domestic market adjusted for some transport costs, storage etc., with milk the processing charges must be taken into account. Although fresh milk is the major domestic product it is hardly traded internationally and so any comparison of international and domestic prices has to use recombined milk as a substitute. The following example may illustrate the case: skim milk powder at a price (c.i.f.) of $1,000/t and butter-oil at $2,500/t can be recombined with water in the proportion 10% skim milk powder, 3.5% butter-oil and 86.5% water. Allowing for a processing cost of 10% the border equivalent price for recombined milk is $0.21/litre1/. Translated. into domestic currency at the current exchange rate, this "border" price when compared to domestic prices, determines whether imports will flow in or not. A further complication, however, is that usually in the eyes of consumers there is a quality difference in favour of fresh milk in comparison to recombined and this means that the domestic price for fresh milk can be somewhat higher then the border price of recombined milk and still remain competitive.
[1/]
1.25. The second amendment to the general theory concerns the effect of government policy. Often heavily distorted exchange rates, import duties, import monopolies and other regulations interfere with the free market assumed in the above calculation. Because of this interference any interpretation of the international to domestic price ratio rust be adjusted to allow for these policy distortions. In Part Two the aims and instruments of government policy will be elaborated upon but meanwhile the following digression gives information on how international prices for dairy production are set and influenced.
Digression: The International Prices for Dairy Products
1.26 World markets for dairy products have been dominated by growing protectionist pressures and dairy income support policies, particularly in the United States and the EEC. Such policies have depressed international prices (Tangermann and Krostitz, 1982, p. 29 f and FAO, 1983a, p. 46-69). Since 1980/81 the world market prices especially for skim and whole milk powder have fallen substantially. At the end of the third quarter of 1983, stocks of skim milk powder held by the EEC and the United States were approximately double the annual volume of international trade in this product (GATT, 1983, p, 12 f. and p. 32). It is obvious that such price developments will have stimulated dairy imports into sub-Saharan Africa because they provide opportunities for many African countries to import at well below domestic production costs. In the near future any major change in this situation seems unlikely. According to FAO (1984) "dairy markets will remain oversupplied and international prices low" (p.4). Van Dijk et al. (1983) arrive at a similar conclusion. It is also unlikely that the recent change in EEC dairy policy, whereby producer quotas have been set, will have any great effect in the short-term. Thus, sub-Saharan African countries will have cheap dairy imports available for some time to come.
1.27. On a sub-continental scale there are few data to quantify the factors influencing international markets. However, an auxiliary calculation that includes some trend values to break down the reasons behind growth in commercial dairy imports is given below. Population growth and rising incomes are taken to be exogenous factors while for price changes, government policies and other factors such as shifts in consumer preferences, no empirical data are available. Thus, the total change in dairy imports  is explained below by a term for changes in population
  plus a term for changes in disposable income per caput
  minus a term for changes in domestic milk production
  plus, finally, a residual term
  comprising all other factors.
The resulting equation (7) 
can be derived from equations (4) to (6) above. The influence of the single factors is weighted by the rate of self sufficiency (RSS), i.e. the share of domestic supply in total dairy consumption. Changes in per caput incomes are multiplied by the coefficient of their assumed influence on dairy demand, i.e. the income elasticity of milk demand (h). Table 4 gives some results of the calculations which are explained in more detail in Appendix 12. The countries are listed in order of the residual term (last column, table 4). That means, the higher a country ranks in table 4, the more we can assume that influences other than population, income and changes in domestic production have stimulated (or curbed) dairy imports. As already stated among such influences are price changes, government policies and shifts in consumer preferences.
Table 4. Indicators of potential policy influence on dairy imports in sub-Saharan African countries.
|
Country |
Region |
Ecological zone1/ |
Average annual growth in imports2/ (%) |
Share of food aid in total imports3/ |
Average annual growth in total per caput consumption4/ |
Residual term5/ |
|
Zambia |
S |
SH/SA |
- 15.0* |
0.32 |
- 10.3* |
+19.2* |
|
Siera Leone |
W |
H/SH |
+ 10.2 |
0.35 |
+ 9.3* |
+10.0* |
|
Ivory Coast |
W |
H/SH |
+ 14.4 |
0.01 |
+ 8.7 |
+ 7.6 |
|
Somalia |
E |
A/- |
+ 80.5* |
0.49 |
+ 14.01 |
+ 6.4* |
|
Congo |
C |
H/SH |
+ 8.9 |
0.08 |
+ 9.8* |
+ 5.4* |
|
Togo |
W |
SH/H |
+12.9 |
0.18 |
+ 5.9 |
+ 4.6 |
|
Nigeria |
W |
SH/SA |
+15.4 |
0.01 |
+ 6.3 |
+ 4.5 |
|
Liberia |
W |
H/- |
+ 6.5 |
0.10 |
+ 3.3 |
+ 3.2 |
|
Niger |
W |
A/- |
- 0.7 |
0.25 |
+ 3.2* |
- 3.0* |
|
Mauritania |
W |
A/- |
+ 5.5 |
0.35 |
+ 1.5 |
+ 2.3 |
|
Uganda |
E |
SH/H |
- 1.6 |
0.43 |
- 0.9 |
+ 2.2 |
|
Malawi |
S |
SH/SA |
+ 1.5 |
0.41 |
+ 2.8 |
+ 1.6 |
|
Cent.Afr.Rep. |
C |
H/SH |
+ 3.0 |
0.30 |
+ 2.0 |
+ 1.6 |
|
Burundi |
C |
HL/SH |
+ 35.0 |
0.40 |
+ 2.8 |
+ 0.4 |
|
Upper Volta |
W |
SA/SH |
+ 36.2 |
0.36 |
+ 8.0 |
+ 0.3 |
|
Benin |
W |
SH/SA |
+ 12.2 |
0.39 |
+ 1.7 |
+ 0.2 |
|
Ethiopia |
E |
A/HL |
+ 21.3 |
0.40 |
- 0.2 |
- 0.2 |
|
Senegal |
W |
SA/A |
+ 5.7 |
0.19 |
- 0.4 |
- 0.3 |
|
Mali |
W |
A/SA |
- 0.1 |
0.32 |
+ 1.2 |
- 0.3 |
|
Lesotho |
S |
n.a. |
+ 10.1 |
0.51 |
+ 3.3 |
- 1.2 |
|
Guinea |
W |
SH/H |
+ 3.2 |
0.24 |
- 2.5 |
- 2.7 |
|
Ghana |
W |
H/SH |
- 2.9 |
0.30 |
- 5.4 |
- 3.4 |
|
Rwanda |
C |
HL/SH |
- 3.2 |
0.95 |
- 2.8 |
- 4.3 |
|
Madagascar |
S |
SH/H |
- 5.6 |
0.31 |
- 5.4 |
- 4.3 |
|
Cameroon |
C |
H/SH |
+ 8.5 |
0.17 |
- 1.0 |
4.6 |
|
Zimbabwe |
S |
SA/SH |
+ 47.2 |
0.32 |
- 5.6 |
5.1 |
|
Sudan |
E |
A/SA |
+ 18.8 |
0.40 |
- 6.9* |
- 8.1* |
|
Zaire |
C |
H/SH |
- 4.2 |
0.16 |
- 9.2* |
- 8.5* |
|
Tanzania |
E |
SH/SA |
+ 0.4 |
0.51 |
- 8.6* |
-10.1* |
* figures are considered particularly unreliable
1/ SH = sub-humid, H = humid, SA = semi - arid, A = arid, HL = highlands (see Jahnke, 1982 p. 233)
2/ Commercial dairy imports only, period from 1972-74 (av.) to 1980-82 (av)
3/ 1980-82 (av.)
4/ Consumption = domestic production + commercial imports (for the same period as under 2/ above)
5/ i.e. the term (e) in equation (7) above; for the calculation see App.12 (period as under 2/ above)
SOURCE: hop. 12 and FAO, 1984a.
1.28. To give an example of how to interprete table 4, Nigeria ranks in the upper quarter. Here commercial dairy imports grew annually by an average of 15.4% ever without food aid. Per caput milk consumption increased by 6.3% per year, mainly due to the increase in imports (compare col. Vb in App. 12). The residual term of +4.5 indicates that population, income and milk production growth in Nigeria can only explain a 10.9% increase in dairy imports. The remaining 4.5% increase must be due to pricing policy, exchange rate controls, or long-term shifts in demand, eg. substitution of milk from sheep and goats by cow's milk. In Cameroon, on the other hand, commercial imports of dairy products would have increased by another 4.6% annually if policy and other factors had not curbed their growth. Per caput consumption therefore declined by 1.0% on average. The results in table 4 show that in most countries (25 out of 29) the development of per caput milk consumption has been in accordance with equation (7), i.e. a positive residual term (e) contributes to increased commercial dairy imports and growth in domestic consumption and vice versa. In two-thirds of the countries, growth in imports matches a growth in per caput consumption. Both the importance of dairy imports for consumption and the impact of national policies on their development is substantiated by these results.
1.29. To summarize, increasing dairy imports into sub-Saharan Africa must be attributed to a variety of factors of which population growth, urbanization, income and consumer prices have potential influences on the demand side. The effects of changes in producer prices influence the supply side. Foreign exchange, food aid and international prices are the main direct influences on dairy imports. The effect of these various influences can be summarized as follows: or the demand side all factors, although to differing degrees, contribute to rising imports. With regard to prices, both on the demand and supply sides, more analysis is needed, in order to better judge their cause and effects. In many African countries prices are said to have been depressed by government policies and this would further fuel demand for imports. Foreign exchange availability does not seem to have contributed to the increase in total dairy imports, whereas food aid and international prices for dairy products have done so. Government policy although varying widely influences all of this and can even change the direction of impact.
1.30. The complex interactions between prices, demand and supply in domestic markets and those in world markets make it difficult to distinguish causes and effects. However, on the demand side population and income growth and urbanization can be taken as independent variables even though it might be argued that for urbanization, the availability of cheap imported foodstuffs may be one factor that stimulated the migration to the city. In general it appears that increasing dairy imports have increased the total supply of milk and dairy products in importing countries thereby halting upward trends in prices or even lowering them. Consumers benefit from this effect although only detailed analysis will reveal which groups have reaped most benefits.
1.31. In the face of declining or stagnant prices, producers can be expected to cut back on dairy production and shift their resources to more profitable alternative products. One might argue however, that many producers will stay in milk production, even when relative prices fall, simply because they have no production alternatives. Similarly one might hold that the effects of technical innovations, e.g. improvement in management and in breeding stocks would lower costs of production and offset the effect of decreasing dairy prices so milk production continued. The EEC for example, reports an annual average increase in milk yield per cow of 2.2% since 1974, and 3.8% for 1981/82 which is claimed to reflect among others improved herd structure and quality of milk cows (Commission of the European Communities, 1984, p. 132). For sub-Saharan Africa, however virtually no increase in yields has been observed over the last decade, neither per productive animal nor per total herds. The only exception to this rather gloomy picture is West Africa which shows a modest improvement in dairy production (Anteneh, 1984). Thus, the overall effect of decreased prices must, be interpreted as hampering dairy farmers' output and income potential as well as reducing their economic welfare.
1.32. Unfortunately, the availability and quality of price statistics are very poor for most African countries and it is therefore impossible to quantify, on a sub-Saharan or regional scale, the impact of dairy imports on domestic price levels and production. Presumably, this can be done in a few detailed country studies and should be a priority for future research in this field. The general effects to be expected, as explained above, are depressed domestic prices and disincentives to local production. Allegedly, there have been cases where local milk processing plants have stopped collecting fresh milk because they found it more economical to sell reconstituted milk from cheap milk powder and butter-oil imports1/. It should also be stressed that there is possibly a circular effect: imports depress local production and this generates ever more demand for imports. Such an effect will balance out towards an equilibrium if prices are allowed to move freely. As mentioned earlier, government interference can alter these effects substantially - and presumably has done so in the past.
[1/ The dangers of dairy imports are discussed, for example, by the Ministry of Agriculture, Tanzania (1977).]
1.33 The level of imports is directly affected by the availability of foreign exchange and variations in the exchange rate. On the other hand growing expenditure on dairy imports poses an additional burden on a country's balance of payments and tends to weaken its currency. The total impact on the economy is not easily quantified but one can compare the value of net imports of dairy products to total export revenues to get a first indication of the burden laid on the balance of payments of a particular country. As can be seen from Appendix 4 there are great variations among the countries for which data are available. For those five countries that spend a larger percentage of total export earnings on dairy imports, i.e. 5% or wore, it can be assumed that these imports have been displacing expenditures on long-term development projects because of tight budgets.
1.34. All the effects mentioned above have only been described qualitatively. Lack of appropriate data and problems in methodology hamper many efforts to quantify these effects. Nevertheless an attempt must be made to translate respective price and quantity changes into welfare figures covering as many different consumer and producer groups as possible. A quantification of welfare effects is an important consideration for governments setting policies on dairy imports.