![]()
![]()
![]()
2.4.1 Natural resources of the Central Borana plateau
2.4.2 Introduction to Borana history and social organization
2.4.3 Human population growth
2.4.1.1 Geology
2.4.1.2 Landscape
2.4.1.3 Soils
2.4.1.4 Climate, primary production and carrying capacity
2.4.1.5 Native vegetation
2.4.1.6 Native fauna
2.4.1.7 Water resources
Four basic geological formations comprise the central Borana Plateau as defined in Figure 2.2 and reported in EWWCA (1987: pp 55-59). Other descriptions of these formations are in Pratt and Gwynne (1977: pp 3-13). The formations include:
Pre-Cambrian basement complex
This comprises about 38% of Figure 2.2, and consists of granites, gneisses and migmatites. This is par of the Mozambican Belt of East Africa and is between 600 and 950 million years old. These formations are the result of warping, folding and up-lifting of substrates from the earth's crust. Rocks are varied in colour and often have a banded appearance due to separation of mineral components under high temperature. Basement-complex parent materials underlie areas having mountainous, undulating or flat relief. Basement-complex parent materials tend to dominate soil formation at higher elevations on the Borana Plateau and this has implications for soil chemistry and plant associations (see Section 2.4.1.5: Native vegetation). Fractured depths of the Basement-complex formation make up many of the discontinuous aquifers that supply the deep wells (see Section 2.4.1.7: Water resources).
Sedimentary deposits
These were deposited during the Jurassic Period some 180 million years ago. They comprise about 2% of Figure 2.2 to the north-east, and are composed of shales, sandstones and limestones. These materials largely resulted from oceanic activity.
Volcanics
These comprise about 20% of the area in Figure 2.2 and were deposited during the Tertiary to Quaternary Periods (i.e. from 70 to 3 million years ago). This was associated with massive tectonic disturbances that created the Rift Valley. Volcanics consist of a Trap Series component to the west (Figure 2.2) which occurred during the Oligocene and Miocene subdivisions (i.e. 25 to 40 million years ago), fissural basalts to the south-west and quaternary basalts to the south deposited three million years ago. All of these overlay Basement-complex formations up to a thickness of 500 m. The group of craters evident around the town of Mega (Figure 2.2) represents a chain that ends at Marsabit in Kenya (EWWCA, 1987). Volcanics also contribute mountains and hills and underlie areas with undulating and flat relief. Volcanics tend to occur more, however, at lower elevations of the study area, which has implications for soil chemistry and plant associations (see Section 2.4.1.5: Native vegetation). The few crater lakes in the study area are known for their salty water. Recovering salt from these lakes is a source of employment near Mega (D. L. Coppock, ILCA, personal observation). Salty water is reportedly also an important feed intake for camels at Dilo Goraye to the south-west (D. L. Coppock, ILCA, personal observation). Some crater bottoms also harbour deep water wells (see Section 2.4.1.7: Water resources).
Quaternary deposits
These comprise about 40% of the area in Figure 2.2 and were deposited at least three million years ago. They have resulted from alluvial (river, lake or swamp deposition) or eluvial (in situ weathering of rock) processes.
In sum, the central Borana Plateau is diverse in terms of the types and ages of parent materials for soil formation. These factors influence soil fertility which, in turn, influences vegetation characteristics.
The terrain of the central Borana Plateau includes a central mountain range, scattered volcanic cones and craters and gently undulating and flat plains. The basement-complex mountains largely run from north-west to south-east from Yabelo to Moyale and north from Arero (Figure 2.2); some peaks attain 2000 m in height. These peaks are often distinctive because they contain massive, protruding blocks of resistant rocks that have separated from the more readily erodible materials.
It is important to note that the undulations of the plains are too gentle and irregular to be described as a catena which is a common landform elsewhere in East Africa (Pratt and Gwynne, 1977). There are distinctions, however, in soil and vegetation among lowland sites in valleys and depressions compared to upland sites and these have important implications for land use (see Section 2.4.1.3: Soils and Section 4.3.6: Cultivation). Except along the Dawa River (Figure 2.2), which was excluded from most of ILCA's research, there are no seasonally flooded areas or catchments which could support riverine vegetation or gallery forests. The study area is thus distinctive because it lacks reliable surface water during most of the year (see Section 2.4.1.7: Water resources). These points are made because patches or corridors of seasonal or permanent wetlands have been increasingly recognised as crucial pastoral resources (Coppock et al, 1986a; Ellis et al, 1986; Scoones, 1991).
Landscape units or land systems have been defined as "areas in which there is a recurring pattern of topography, soils and vegetation" (Christian and Stewart, 1953 cited in Pratt and Gwynne, 1977: p 9). Landscape classification systems thus attempt to incorporate climatic, topographic and edaphic criteria. Some 104 landscape facets have been proposed for the central Borana Plateau by Assefa Eshete et al (1986). This classification, integrating aspects of climate, soils, vegetation and land use, will be introduced in Chapter 3: Vegetation dynamics and land use and Annex C: Ecological map of southwestern Borana.
Detailed technical descriptions of the geology of the southern rangelands are reported in AGROTEC/CRG/SEDES Associates (1974i) and EWWCA (1987). Geological maps at a national scale can be found in Kazmin (1973). A physiographic map of the study area can be found in EWWCA (1987: p 54). This map divides the region into four large drainages or watersheds: (1) Dawa Wenz to the north-east, (2) Laga Sure to the southeast; (3) Laga Ririba to the north-west and (4) Laga Walde to the south-west. (The general introduction to East African geology and landscapes in Pratt and Gwynne (1977) is also recommended reading).
Soil develops over time from interactions of parent material, weathering and accumulation of organic matter. Overall, rangeland soils of East Africa are regarded as having low fertility. This is principally attributed to the very old age of common parent materials Pratt and Gwynne, 1977: p 9). Range soils may vary substantially in fertility, however. In general, soils with more clay that are derived from lava or other materials low in quartz are often regarded as having higher fertility than lighter, sandier soils derived from granites and sandstones higher in quartz. This can be extrapolated to landscapes: Bottomlands of valleys and other sites with impeded drainage may be expected to have greater fertility than soils on slopes or hilltops. Despite their low fertility compared with soils in wetter zones, common range soils have a reduced risk of accelerated nutrient loss from leaching because of the lower rainfall. Precipitation regimes ranging from 500 to 900 mm/annum have been proposed as thresholds over which leaching can interfere with maintenance of soil fertility Pratt and Gwynne, 1977: p 13). The low rainfall of rangeland areas may also depress response of range soils to mineral fertilisers. This is because water is assumed to be the major limiting factor to plant growth in many rangeland systems (Noy-Meir, 1973; Pratt and Gwynne, 1977). Ludwig (1987) disputes this, however, and notes that nutrient limitations can be important constraints in run-on areas or patches in dry-land systems where water availability is less of a constraint.
Soil structure and fertility
This section reports on soil surveys for ILCA research sites in Ethiopia conducted by Kamara and Haque (1987; 1988). Sites analysed in the southern rangelands were near Mega, Sarite ranch, Dembel Wachu, Melbana, Yabelo, Medecho and Dubluk (see Figures 2.2 and 3.1 for map locations). The other sites included Debre Birhan, Debre Zeit, Gudder, Deneba, ILCA headquarters, Wogele, Woreta and Were llu distributed among the northern and north-central highlands, Soddo in the southern highlands and Zwai in the Rift Valley. The surveys were intended to provide baseline information from representative sites that could be used in designing agronomic trials. Sites were thus not selected randomly and data were not intended for statistical analysis. The survey does, however, provide some useful background for understanding variation in Ethiopian soils and edaphic constraints found in the southern rangelands.
Vertisols near Mega and at Sarite ranch on the Borana Plateau were described by Kamara and Haque (1987: pp 11, 26, 64-67,81 and 84). Upland soils at Dembel Wachu, Medecho, Dubluk, Melbana and near Yabelo were described by Kamara and Haque (1988: pp 5, 7, 16-18, 24, 26, 30, 46, 62-73, 81 and 83). The following material will only briefly review some general results. Kamara and Haque (1987; 1988) should be consulted for details and a standard soils text for clarification of technical parameters or methods employed.
Vertisols are brown or grey soils that are often poorly drained, are high in organic matter and have a clay content of over 60% (Kamara and Haque, 1987). In the rangelands Vertisols have a restricted distribution in valley bottoms low-lying plains and on flat surfaces in the central mountain range.
Compared to the surface soil (i.e. the top 20 cm) of 15 other Vertisol sites studied throughout the Ethiopian highlands and lowlands, the rangeland Vertisols were typically average in most respects (Kamara and Haque, 1987). For example: (1) available phosphorus (P) ranged from 0.3 to 39.4 ppm across all 17 sites with a mean of 7.8 ppm, and the average for the rangeland sites was 10.9 ppm; (2) per cent total nitrogen (N) ranged from 0.02 to 0.29% across all sites with a mean of 0.13% and the average for the rangeland sites was 0.10%; (3) per cent organic matter (OM) ranged from 1.5 to 5.7% across all sites with a mean of 3% and the average for the rangeland sites was 2.9%; (4) pH ranged from 4.98 to 7.52 across all sites with a mean of 6.02 and the average of the rangeland sites appeared more alkaline at 7.62; (5) bulk density (throughout the profiles) ranged from 0.83 to 1.48 g/cm3 across all sites with a mean of 1.18 g/cm3 and the average of the rangeland sites was 1.04 g/cm3; (6) total porosity (throughout the profiles) ranged from 54 to 84% across all sites with a mean of 65% and the average of the rangeland sites was 71%.
Available water capacity (AWC) ranged from 1.4 to 4 mm/cm over the 17 sites with a mean of 2.4 mm/cm. The average for the rangeland sites was at the low end with 1.52 mm/cm. The picture changes somewhat for total AWC, which reflects variation throughout the profiles. Total AWC ranged from 362 to 686 mm over 17 sites with a mean of 515 mm. The average for the two rangeland sites was 573 mm. Soil depths were only evaluated either to a maximum depth of 2 m or until bedrock was reached. Only four out of the 17 sites had soil depths <2 m, and one of two in the rangelands was in this category (i.e. 180-cm depth). Nearly all of the Vertisol sites (including the rangeland sites) were judged to have an erosion risk of none to slight (Kamara and Haque, 1987: p 32).
In contrast to Vertisols, the upland soils in Ethiopia vary from yellow, brown, grey or red in colour. They are better drained and usually have more equitable proportions of sand, silt and clay (Kamara and Haque, 1988). The clay allows for greater ability to store moisture and nutrients while sand has the least ability in these respects. In the rangelands, upland soils are widespread and occur on mountains, ridges, upland swales and hilly and level plains. The six rangeland sites averaged 53% sand, 17% silt and 30% clay. The eight sites elsewhere in Ethiopia had an average composition of 40% sand, 23% silt and 37% clay. Based on these patterns it could be stipulated that the upland soils of the rangelands have a lower ability to retain water and nutrients than upland soils elsewhere.
Upland soils in the rangelands appeared similar to those found elsewhere in Ethiopia in most other respects (Kamara and Haque, 1988). For example: (1) for the non-rangeland sites available P averaged 3.25 ppm (range: 0.63 to 14.5 ppm) while the rangeland sites averaged 2.8 ppm (range: 1.19 to 5.29 ppm; three sites having values >44 ppm were excluded because this was thought to be related to past fertiliser use); (2) per cent total N for the non-rangeland sites averaged 0.11% (range: 0.01 to 0.16%) while the rangeland sites averaged 0.09% (range: 0.04 to 0.14%); (3) per cent organic matter (OM) for the non-rangeland sites averaged 2.8% (range: 1.6 to 4.8%) while the rangeland sites averaged 2.4% (range: 0.9 to 4.3%); (4) pH for the non-rangeland sites averaged 6.7 (range: 5.1 to 8.1) while the rangeland sites averaged 7.1 (range: 6.4 to 7.8); (5) bulk density for six non-rangeland sites averaged 1.22 g/cm3 (range: 0.99 to 1.35 g/cm3) while the rangeland sites averaged 1.41 g/cm3 (range: 1.19 to 1.63 g/cm3); (6) total porosity (five sites) ranged from 49 to 61 % across all sites with a mean of 54% and the one rangeland site had a value of 49%.
In terms of AWC the non-rangeland sites averaged 1.54 mm/cm (range: 0.80 to 2.08 mm/cm) while the rangeland sites averaged 1.33 mm/cm (range: 0.32 to 2.66 mm/cm). For total AWC the non-rangelands sites averaged 312 mm (range: 176 to 405 mm) while the rangeland sites averaged 43% less at 179 mm (range: 35 to 409 mm). Three of eight non-rangeland sites had soil depths <2 m and these averaged 165 cm (range: 160 to 170 cm). All of the rangeland sites had soils <2 m deep (average: 144 cm; range: 125 to 170 cm). Three of eight non-rangeland sites were scored as having at least a slight-to-severe risk of erosion. Five of six sites were scored at the same level for the rangelands.
The above material provides some basis for proposing hypotheses regarding regional variation within the major soil classes, but the data are notable for their lack of variability in most respects. For example, Kamara and Haque (1987; 1988) concluded that all of the soils studied were markedly deficient in N and P content for sustained and intensified cultivation without fertilisation. Concerning site variation, it is reasonable to hypothesise, at least for the upland soils, that the rangeland sites are sandier and shallower. This suggests that the upland soils in the rangelands are less capable to store nutrients and moisture than sites elsewhere. This could be a major production constraint given that availability of nutrients and moisture are lower in the rangelands (see Section 2.4.4.1: Rainfall).
Differences between Vertisols and upland soils appear to be greater than the regional variation within either group. It is reasonable to postulate that compared to the upland soils, the Vertisols have a higher content of N, P and OM and a higher AWC conferred by their higher proportion of clay and silt and greater depth. The Vertisols are probably also far less vulnerable to erosion. In sum, these postulated differences are in agreement with the contention that Vertisols offer a more reliable substrate for sustainable cultivation than upland soils (Kamara and Haque, 1987).
Given these differences between soil groups, it is also evident that it is the relative proportion of each at the landscape level that would largely define the major contribution of soil to the character of agricultural enterprise in any given region. For example, it has been estimated that <10% of the southern rangelands is suitable for sustainable cultivation. This is largely related to the low proportion of Vertisols (and deep upland swales) that occur on the Borana Plateau. In contrast, the northern Ethiopian highlands are regions of intense cultivation, probably because of the dominance of deep Vertisols (Westphal, 1975). Conversely, the very high proportion of shallow upland soils in the southern rangelands probably makes for a greater vulnerability of the system to opportunistic cultivation and/or heavy grazing pressure (see Section 3.3.1: Ecological map and land use).
This simple dichotomy supports the views of Pratt and Gwynne (1977: p 9) who contend that categorising soils with regards to erodibility is really all that is needed for a fundamental understanding of how soil contributes to the stability and resilience of rangeland systems, and that agronomic studies of soil nutrient features in rangelands are less necessary. This also may support the idea that rangeland systems are more often regulated by moisture availability (Noy-Meir, 1973). A more recent view, however, is that one must take a site-specific approach to judge whether water or soil nutrients are the most limiting factor to plant production in a rangeland system (Ludwig, 1987). This may fit well in the southern rangelands where Vertisols and upland soils provide a testable dichotomy. It is perhaps most relevant to hypothesize: (1) That plant production on the upland soils of the southern rangelands is more likely to be regulated by available water rather than soil nutrients during most of the year; and (2) that plant production on Vertisols or deep upland swales is more likely to be regulated by nutrient availability since soil moisture is relatively more plentiful.
Recognition of this dichotomy is probably fundamental to understanding prospects for the long-term sustainability of the pastoral system in light of increasing pressure from cultivation and cattle grazing (see Sections 4.4.1.1: Pastoralism and cultivation and 7.2: A theory of local system dynamics).
Climate is principally defined by interactions of rainfall and air temperature that determine seasonality and the breadth of ecological niches for plant and animal species. Although AGROTEC/CRG/SEDES Associates (1974d; 1974i; and 1974j) dealt with aspects of climate in the southern rangelands, it was from a more limited data base than exists today.
Rainfall
Monthly and annual rainfall statistics for 10 years over the period 1980 to 1989 can be found in Table A1, Annex A. The following is a preliminary analysis and conclusions are not definitive because a minimum of 50 to 60 years may be required to establish accurate rainfall patterns in semi-arid areas Billé 1983). For example, the 1980-89 data include the 1983-84 drought and some annual means are probably biased downwards. This is because multi-year droughts are thought to occur at a lower frequency than once every 10 years (see below).
Complete data were obtained for seven of 10 sites. Rainfall varied substantially with location. Annual mean rainfall in the seven sites varied from about 440 mm at Wachile to 1100 mm at Moyale on the Kenya border, with an overall average of 700 mm (Table A1, Annex A). Variability was uniformly high and ranged from 38 to 57% of annual means. Annual rainfall varied significantly with elevation in a simple linear regression for six sites (N = 6; r2 = 0.94; P = 0.001; see Figure 2.3). This indicates that over the range of 1000 to 1700-m elevation, annual rainfall increased by 64 mm for each 100 m.
The final regression deleted stations at Moyale, Yabelo, Did Hara and Dubluk. Moyale was dropped because its position on the escarpment with the northern Kenyan desert subjects it to a higher rainfall, and Yabelo and Did Hara were dropped because they occur in a rain shadow of the central mountain range Billé 1983). Dubluk was dropped because of a lower confidence in the data quality (D. L. Coppock, ILCA, personal observation). A rainfall map of the study area in which five moisture zones are depicted is shown in Figure 2.4.
Mean annual totals for rainfall alone do not indicate effectiveness of rainfall for plant production. Effectiveness is strongly influenced by seasonal concentration of moisture and reliability of receiving threshold amounts within certain time intervals (Pratt and Gwynne, 1977: p 13). Data in Table A1, Annex A, indicate pronounced concentrations of rainfall in a bimodal pattern. As a first example, each rainy period is defined as being three months in length to illustrate seasonality. In this case 59% of the annual rainfall occurred during March, April and May at all seven sites while another 27% fell during September, October and November. In sum, 86% of the rain occurred during six months. Over twice as much rain fell from March through May as in September through November. Now considering a two-month duration for each rainy period, 48% of the annual rainfall occurred during April and May, with 20% falling during October and November. Sixty-eight per cent occurred during four months. Over 2.3 times as much rain fell in April and May as in October and November.
Billé (1983) considered that a monthly rainfall of 60 mm was the minimum required to stimulate green-up of herbaceous vegetation in the southern rangelands. He therefore calculated probabilities of rainfall exceeding 60 mm for six sites in each month based on data from 1957 to 1981. All of the sites were at higher elevations and could be considered representative of the study area as a whole (i.e. half occur on the periphery of the study area). The general perspective is useful, however, and the analysis is shown in Table A2, Annex A. Averaged across all sites, the probability of receiving 60 mm ranged from about 0.20 or less from June through August and December through February. The driest month was January with an average probability of 0.09. Probabilities ranged from 0.48 in March to 0.93 (April) and 0.78 (May) during the heavier rainfall period. For the lighter rainfall period probabilities ranged from 0.35 (September) to 0.78 (October) and 0.58 (November). Throughout the rest of this report the period March through May will be referred to as the long rains, while September through October will be referred to as the short rains (see also Billé 1983; Cossins and Upton, 1988a).
Numbers of rainy days for the long and short rains on a decade (10-day) basis are displayed in Tables A3 and A4, Annex A. These data illustrate some of the short term, temporal variation in rainfall delivery that can have a bearing on plant growth (G. King, University of New South Wales, personal communication). Using drier Wachile and wetter Moyale as extremes, it can be seen from Table A3, Annex A, that the peak rainy month of April is characterised by a fairly even distribution of precipitation throughout the three decades. Wachile averaged 3.4 rainy days out of 10 while Moyale averaged 5.9. March and June were similar in the numbers of rainy days for Wachile (average of 1.6 out of 10) or Moyale (average of 2.4 out of 10) and the increasing and decreasing trends in decade rainfall are apparent (Table A3, Annex A). For the peak rainy month of October during the short rains, Wachile averaged 2.1 rainy days out of 10 while Moyale averaged 3.4 (Table A4, Annex A). September and November were similar for Wachile with an average of 1.3 rainy days out of 10, but Moyale showed 1.5 for September and 3.5 for November.
Figure 2.4. Rainfall zones on the Borana Plateau.
Source: EWWCA (1987) as adapted from Billé (1983).
Air temperature
Compared to rainfall, air temperatures vary much less throughout the year in most of sub-Saharan Africa. Temperature thus plays a more minor role in defining seasonality in Africa than in temperate environments. The key issue in warmer climates is how temperature modifies effectiveness of rainfall by influencing evaporation. This in turn affects plant production and the distribution of plant species. Temperature also imposes limitations on whether introduced exotic plants can become established (Skerman, 1977).
The seasonal homogeneity of air temperature on the Borana Plateau is illustrated in Table A5, Annex A. At Sarite ranch (the warmest site) and Yabelo (the coolest site), day-time maxima varied by only 4 to 5°C all year, while night-time minima varied by <2°C. Simple linear regressions relating maximum, mean and minimum temperatures with elevation across seven sites are shown in Figure 2.5. All relationships were significant (N = 6; r2 = 0.52; P£ 0.05) and indicated that temperatures decreased on the order of 1°C with each 200-m increase in elevation.
Figure 2.5. Linear regression analysis of annual air temperatures as a function of altitude for seven sites in the southern rangelands.
Seasonality, forage production and carrying capacity in an average rainfall year
Plant growing seasons for a selection of sites are depicted in Figure 2.6 (a-d). These diagrams were produced under assumptions for soil water balance (see Section 2.3: Methods). Moyale (Figure 2.6b) is merely shown for reference given the higher rainfall there. Others, however, illustrate, that compared to higher and wetter sites (i.e. Negele and Arero), sites at lower and drier elevations (such as Sarite) have a shorter growing period during the long rains and only a nominal growing period during the short rains. Sites such as Sarite could thus have more of a unimodal rainfall pattern which could yield regional variation in net primary production (NPP) and plant species composition. To be most accurate, water-balance models should incorporate estimates of potential evapotranspiration (PET), but there are insufficient field data from the Borana Plateau to make these calculations. The reader is referred to FAO (1984) and EWWCA (1987: p 63) for some estimates of PET for other regions in southern Ethiopia.
Results from the LGP model used in Cossins and Upton (1988a) are shown in Table 2.1. There was a range of 65 to 95 growing days for the long rains and 46 to 67 growing days for the short rains during average rainfall years. The total annual growing period ranged from about 3.8 to 5.0 months. These estimates may be conservative because the authors assumed that there was a carry over of zero soil-moisture storage and rainfall alone contributed the moisture for plant growth at any given time (Cossins and Upton, 1988a: p 121).
Figure 2.6 Climate diagrams for four sites. - Sarite (1052 m) nut - Source: Michel Corra (ILCA, unpublished data).
Figure 2.6 Climate diagrams for four sites. Moyale (1200 m) - Source: Michel Corra (ILCA, unpublished data).
Figure 2.6 Climate diagrams for four sites. - Negele (1530 m) - Source: Michel Corra (ILCA, unpublished data).
Figure 2.6 Climate diagrams for four sites. - Arero (1700 m) - Source: Michel Corra (ILCA, unpublished data).
Figure 2.7 depicts regional patterns of numbers of plant growing days and NPP in an average rainfall year from Cossins and Upton (1988a). This analysis indicates that because the northern zone has from 27 to 47% more growing days than other zones, annual forage production in the northern zone is 12 to 25% higher. In the northern zone around 2.7 t of dry matter (DM)/ha/year may be produced as a result of 140 growing days. In the other zones this ranges from: (1) 1.5 t DM/ha/year from 102 growing days (west); (2) 2.0 t DM/ha/year from 125 growing days (central); and (3) 1.9 t DM/ha/year from 110 growing days (east).
Cossins and Upton (1987: p 202) reported stocking rates of livestock in the four zones throughout the study area in the "average" rainfall year of 1982 to 1983 (see Figure 2.7). In the wet season cattle stocking rates varied from about 13 to 23 head/km2 in the western and eastern zones, respectively, with an overall density of about 20 head/km2. For small ruminants, figures ranged from 7 to 17 head/km2 in the western and central zones, respectively. The overall density for small ruminants was about 8 head/km2. For the 15475 km2 study area this translates to 309000 cattle and 124000 small ruminants or a combined total of 17 Tropical Livestock Units (i.e. 250-kg equivalents/km2). In the dry season the overall mean for cattle decreased by 20% to 16 head/km2 and thus 248000 head for the study area overall. The total density of TLUs for the dry season was around 14 TLU/km2 while the weighted average density for the year was about 16 TLU/km2.
Pratt and Gwynne (1977: p 112) estimated that the "safe" carrying capacity for 600, 500 and 400 mm of annual rainfall in East Africa was 6, 7 and 11 ha/TLU/year, respectively. These are densities at which livestock productivity/head is not compromised and vegetation is not appreciably altered by grazing. Conservatively assuming an average of 500 mm of annual rainfall for the study area overall, the "safe" carrying capacity is 14 TLU/km2. This suggests that for the central plateau overall, the livestock population was stocked at or near carrying capacity in 1982 to 1983. The livestock population was probably at this level again by 1988 following the decimating effects of the 1983 to 1984 drought (Solomon Desta, nd; see also Chapter 6: Effects of drought and traditional tactics for drought mitigation, and Section 7.2: A theory of local system dynamics).
Dry and drought years and their effects on net primary production and carrying capacity
In the LGP analysis of Cossins and Upton (1988a), a dry year and a drought (or very dry) year were defined as years in which the LGP is less than 75% or 50% of the long-term mean, respectively. Given their assumptions about annual rainfall distribution (see Section 2.3: Methods), they concluded that a dry year occurs once in five years and a drought year once in 20. It was noted that this proposed frequency agreed with estimates for northern Kenya from the historical record as analysed by Hogg (1980).
Table 2.1. Estimated mean lengths of growing period (LOP) at five sites in the SORDU sub-project area1
|
Site |
Number of years recorded |
Long rains (days) |
Coefficient of variation (%) |
Short rains (days) |
Coefficient of variation (%) |
Total (days) |
Coefficient of variation (%) |
|
Negele |
29 |
84 |
25 |
67 |
26 |
151 |
19 |
|
Yabelo |
6 |
95 |
26 |
51 |
66 |
146 |
33 |
|
Mega |
3 |
87 |
31 |
52 |
19 |
139 |
25 |
|
Moyale |
5 |
65 |
40 |
49 |
69 |
114 |
50 |
|
Did Hara |
5 |
70 |
47 |
46 |
83 |
116 |
59 |
1 See text for methodological details.
Source: Cossins and Upton (1988a).
Cossins and Upton (1988a: pp 121-122) calculated how NPP could change in dry and drought years as a result of variation in LGP. Given the assumption that LGP and NPP are directly correlated, they estimated that for the study area overall, NPP would drop by 25 to 50% in dry and drought years, respectively. The relative effect may vary somewhat among zones, however, with the north affected less because of its more favourable position in the higher rainfall belts of the southern highlands (see Section 1.3: Climate and zonation of the lowlands). Many cattle were reportedly moved to the north of the study area from other zones during the 1983-84 drought (see Section 6.3.1.1: Livestock dispersal and herd composition).
It thus may be anticipated that the carrying capacity for livestock would similarly decline by 25 to 50% in dry and very dry years to 10 and 7 TLU/km2, respectively. There is evidence to support such dramatic declines in carrying capacity from the 1983 to 1984 drought (see Section 6.2.1: Effects of drought in the lower semi-arid zone). While the utility of the carrying capacity concept has been recently challenged (Ellis and Swift, 1988; de Leeuw and Tothill, 1990; Bartels et al, 1990), observations here indicate that carrying capacity is a relevant concept for interpreting system dynamics (see Section 7.2: A theory of local system dynamics, and Chapter 8: Synthesis and conclusions).
It is important to note that the designation of drought as a one-year event is inconsistent with other analyses (e.g. Donaldson, 1986) which describe droughts on the Borana Plateau as multiple-year phenomena (see Section 6.1: Introduction). Although a 25 to 50% reduction in NPP is a substantial shock to the system in any given year, the vast majority of cattle mortalities and risk of human famine usually occurs in the second of consecutive dry years. Thus, the definition of drought used henceforth in this report is when two or more consecutive dry years occur in which the LGP is less than 75% of the mean.
A dry year is primarily indicated to the pastoralists by a substantial failure of the long rains. Two consecutive failures of the long rains mean a serious drought situation (see Section 6.1: Introduction). From the rainfall analysis of Cossins and Upton (1988a), it can be calculated that the probability of any two consecutive years having near or above-average rainfall is 0.64. The probability of two consecutive years being a combination of an average and a dry year is 0.32. The probability of a two-year drought is 0.04.
Dry years and drought obviously have major implications for animal production and human welfare (see Chapter 6: Effects of drought and traditional tactics for drought mitigation). Cossins and Upton (1988a) defined dry years and drought solely on the basis of metereological phenomena. In Section 7.2 (A theory of local system dynamics) it is argued that higher populations of cattle and people today have increased the vulnerability of the production system to what could otherwise be inconsequential fluctuations in rainfall. This perspective considers that both rainfall deficiency and population density interact to exacerbate the negative effects on the production system.
Plant life histories and savannah ecology
Plant communities on the flat and hilly plains of the central Borana Plateau consist of diverse mixtures of woody and herbaceous vegetation. The dominant community type may thus be characterised as tropical savannah (Plate 2.1); Pratt and Gwynne, 1977). Savannah systems are known for variation in their proportion of woody and herbaceous material as well as the marked shifts in composition that occur in response to heavy grazing, browsing, burning and drought, either alone or in various combinations (Norton-Griffiths, 1979; Walker and Noy-Meir, 1982). In some cases grazing shifts the community toward more trees while browsing and fire favour grass. Much attention has been oriented towards studying the equilibrium behaviour of savannahs; i.e. understanding to what extent savannahs can be altered or degraded beyond recovery to a previous condition (Walker and Noy-Meir, 1982).
Perennial woody plants contribute from 5 to 75% of total plant cover on the central Borana Plateau depending on location. Their recent dominance in many plant communities has been hypothesised to be related to heavy cattle grazing and/or the absence of burning (see Section 3.4.2: Environmental change). Woody plants can have either positive, negative or no effect on the livestock system. It has been observed, for example, that some woody plants are important as sources of forage, cover, fuel and other uses for the pastoral household economy. It has also been hypothesised that woody plants contribute nutrients to soils of overgrazed sites from their annual leaf fall. Some of the negative attributes may include limiting access to herbaceous forage by cattle and reducing growth of herbaceous vegetation in the understorey through competition for light and moisture. These issues are reviewed in Sections 3.3.5.2: Household use of plants and pastoral perceptions of range trend and 3.4.2: Environmental change.
Importantly, the dominant herbaceous plants in the southern rangelands are perennial, rather than annual, grasses. The persistence of perennials is favoured here because of the relatively high rainfall and its bimodal delivery. Pratt and Gwynne (1977) contend that perennial grasses are more likely to occur in East African rangelands when annual rainfall exceeds 250 mm.
Some of the important features of perennial grasses for African livestock systems have been reviewed by Ukkerman (1991). He contends that the productivity of perennials is usually considerably higher than that of annuals, but that some of this advantage is offset because a larger portion of the biomass of perennials is lower in nutritive value than annuals. The importance of perennials for livestock is that they are always ready to green up and grow in response to even small quantities of rainfall. Annuals require more rain over certain periods than perennials because soil moisture has to be high enough for annuals to germinate and successfully complete their life cycles (Harper, 1977). Perennials are thus a more reliable source of green forage at critical times of the year. These include the beginning and end of wet seasons and after brief showers in dry seasons (Ukkerman, 1991).
Perennials are thus an important source of forage stability. Besides their quick greening up, this stability is conferred also by the internal circulation of nutrients within the plant, which allows smaller losses of nutrients in leaves from fire, weathering and grazing compared to annuals (Ukkerman, 1991). The permanent rooting system of perennials also better protects soil against erosion (Ukkerman, 1991).
Perennials are preferred by livestock and are often sensitive to heavy grazing. This is because frequent grazing elicits regrowth which can exhaust root stores of nitrogen and carbon. Grazing also trims off above-ground growing points (see Ukkerman, 1991).
Annuals are more tolerant of heavy grazing, but also risky and unstable. This is again because the production of annuals depends on receiving a certain threshold of moisture before any growth occurs. Annuals, in theory, could only be eliminated by grazing if the pressure is high enough to defoliate plants each year before they set seed and replenish the seed bank. Given that annual grasses may set seed within a month after the first rains (Coppock, 1985), it is unlikely that this degree of grazing pressure could be maintained over a large region. A discussion of the role of perennial and annual grasses in conferring varying degrees of population stability in African pastoral systems is presented in Section 6.4.5: Equilibrial versus non-equilibrial population dynamics. A hypothesis for episodic overgrazing of the perennial grasses of the southern rangelands, with implications for range management and monitoring, is presented in Section 7.2: A theory of local system dynamics.
Seasonality and forage nutritive values
For mature cattle to achieve a sustaining level of energy intake, dietary crude protein (CP; i.e. per cent nitrogen × 6.25) concentration of about 7% (on a dry-matter basis) is considered the minimum for a positive nitrogen balance (ARC, 1980). This threshold can increase for small ruminants, growing cattle and lactating cows, but 7% CP still serves as a useful guideline. Similarly, a suitable minimum digestibility of dry matter is commonly assumed to be on the order of 50% (Coppock et al, 1986b).
The seasonal rainfall patterns in African rangelands are well known for bringing about fluctuations in forage CP content and digestibility (Pratt and Gwynne, 1977; Coppock et al, 1987a). Wet seasons are often characterised by dramatic increases in CP content and digestibility from new growth of forage; CP content can often rise to two to three times maintenance requirements. During dry seasons CP content and digestibility may decline to levels below maintenance. Livestock thus store protein and energy in wet periods and then may lose both in dry periods. Whether or not cattle survive a dry season is also related to the length of time they are on nutritionally deficient diets. Their endurance is related to the amounts of protein and energy they were able to store during the previous wet season.
In a perennial grass system like the southern rangelands, the concentration dynamics of forage nutrients are due to seasonal movements of nitrogen in the plant as well as differences in the degree of construction of cell wall (Coppock et al, 1987a; Ukkerman, 1991). During wet periods when grasses are actively growing, nitrogen is translocated to actively photosynthesizing tissues which have lower ratios of carbon to nitrogen. New cell wall is also at a state of reduced lignification. The reverse occurs in dry periods when nutrients are translocated to the roots for storage and cell wall lignifies to a higher degree. Browse forage, in contrast to grass, tends to maintain higher nitrogen contents in leaves and stem apices longer into the dry season (Coppock et al, 1987a). In part, this is because the growing season is longer for many woody plants because their roots provide access to moisture in deeper soil layers (Coppock et al, 1987a). This is not to say, however, that all green browse is suitable forage in dry periods. Some perennially leafy browse species have leathery leaves adapted to minimise water loss and are poor in nutritive value (Coppock, 1985). Getting nitrogen from other types of leaves can also be hindered by tannins which reduce forage palatability and nitrogen retention (Woodward, 1988; Coppock and Reed, 1992).
Grab samples of seven common perennial grasses were collected during five different seasons in the southern rangelands during 1982 to 1983, which was an average rainfall year (ILCA Nutrition Unit, unpublished data). Species included Cenchrus ciliaris, Chloris mycrostachya, Chrysopogon plumulosus, Cynodon dactylon, Panicum maximum, Pennisetum stramineum, and Themeda triandra with an average of four samples/species/season. Some overall seasonal means (N = 27) are reported here because grab samples are only useful for showing general trends over time. Grab samples do not necessarily reflect material actually selected by livestock and the proportions these species in cattle diets were also unknown. Average seasonal values ranged from 10% CP during the long rains in April 1982 to 5% CP at the end of the warm dry season in March 1983. From June 1982 through February 1983 values remained relatively steady between 6 and 7% CP on average.
In a study of comparative benefits of hay making using local grasses reported in Section 7.3.1.3: Forage improvements), Mulugeta Assefa (1990) estimated values for CP and in vitro digestible dry matter (IVDDM) for grab samples of standing grasses collected during the warm dry season of 1988 to 1989. He reported a mean of 4% CP and 30% IVDDM for these samples. The IVDDM value is exceptionally low for East African range forage. Similar values, however, were found for other grass material collected in the 1989 to 1990 dry season (Coppock, 1993a).
While the results above have some utility, they probably underestimate the quality of the diverse diets selected by animals. Menwyelet Atsedu (1990) conducted a study in which the composition and quality of calf diets were estimated through direct observation of grazing calves during the dry season of 1988 to 1989. Diet profiles were calculated based on the dry-weight contribution observed in bite counts. Forage samples were hand-plucked in an attempt to mimic the calf grazing and chemically analysed to characterise nutritive value. He reported an average of 11.8% CP and 51% IVDDM on a dry-matter basis for 40 grazing trials (Menwyelet Atsedu, 1990: p 47).
Woodward (1988) studied the nutritional dynamics of browse forages selected by goats, camels and sheep in the Bake Pond region near Yabelo during 1985-86. Data for 23 important species are provided in Woodward (1988: pp 166-172), and they illustrate the wide variation in chemical content across species and plant parts as well as some influence of season. Compared to browse stems, browse leaves were typically higher in nitrogen (N) content and lower in neutral detergent fibre (NDF) within a given species regardless of sampling period. Browse provided a relatively stable source of protein to browsing livestock throughout the year when evaluated with respect to the minimum dietary guideline of 7% CP. Averaged over all samples of leaves and stems, mean values for browse ranged from 18.7% CP during the long rains (N = 19) to 10.0% CP during the cool dry season (N = 21), 13.8% CP in the short rains (N = 19) and 13.1% CP in the warm dry season (N = 20). Standard errors were less than 12% of the means in all cases. The high levels of CP in browse forages over different seasons is a common phenomenon that has been reported elsewhere in East Africa (Pratt and Gwynne, 1977; Coppock et al, 1987a). Interpretation of the feed value of the CP is made complicated, however, by the presence of tannins and proanthocyanidins in many forages (Woodward, 1988). These compounds have a variety of effects on nutrition, including reducing forage palatibility and the proportion of dietary N assimilated by the animal. The presence of tannins, however, does not always imply that negative effects on nitrogen balance will occur (Coppock and Reed, 1992; see Section 7.3.1.3: Forage improvements).
In sum, while the nutritional studies based on grab samples or feeding observations were variously limited in design and scope, they do support the idea that forage nutritive value markedly fluctuates with season and that browse forages probably retain a higher CP content than grasses during dry periods. It is also likely that selective feeding at least that of calves, achieves higher quality diets than that estimated by grab samples. It is important to note that these studies can illuminate only a very small part of the picture of the nutritional ecology of livestock here. Since green forage probably provides more than enough CP concentration for compensatory growth and production of cattle in any given wet season (see Sections 5.3.2: Calf growth and milk offtake and 7.3.3.4: The calf: Prospects for growth accelerations the main issue of interest becomes the role of rainfall and stocking rate in regulating the amount of time animals have in wet periods to achieve the body condition needed to reproduce and survive the following dry season. Of considerable importance, then, is whether animals are limited in the quantity of forage they consume during wet seasons and whether such limitations are due to wastage of forage and/or competition among livestock. Evidence will be presented (Section 7.2: A theory of local system dynamics) that the simple model of CP limitation for livestock in dry seasons of average rainfall years (Most et al, 1976; Coppock et al, 1986b) needs to be significantly altered to include dynamics of livestock population cycles, if key constraints of nutrition on cattle production are to be understood. It is likely that this simple CP model holds in the southern rangelands only for a few years after a drought has ended when cattle density is low. Once the herd has recovered its numbers, chronic deficits of energy may become the prime limiting nutritional factors for cattle production and this is postulated to be due to competition for forage within the cattle population throughout the year, not just in dry seasons (see Section 7.2: A theory of local system dynamics).
Flora
The flora of the southern rangelands has been previously described. For a comprehensive species list the reader is referred to AGROTEC/CRG/SEDES Associates (1974d) which has documented scientific names and authorities of some 300 species. Other species list are provided in Corra (1986), Woodward (1988) and Tamene Yigezu (1990). Jenkins et al (1974) lists important forages from the southern rangelands. Nomenclature reported below does not include authorities. Authorities follow those provided in AGROTEC/CRG/SEDES Associates (1974d) and Pratt and Gwynne (1977).
The more common woody genera include Acacia, Commiphora, Combretum, Cordia, Terminalia, Aspilia, Albizia, Juniperus, Rhus, Boscia, Boswellia, Cadaba, Balanites, Salvadora, Dobera, Pappea, Grewia, Delonix and Boswellia spp. Common herbaceous genera include Cenchrus, Cynodon, Themeda, Pennisetum, Enteropogon, Bothriochloa, Brachiaria, Sporobolus, Panicum, Chloris, Aristida, Dactyloctenium, Dichrostachys, Leptothrium, Heteropogon and Hyparrhenia.
A number of plant species common to the southern rangelands are recognised as valuable livestock forages (Pratt and Gwynne, 1977: pp 240-264). These primarily include dry, dehiscent fruits of Acacia tortilis and leaves of A. brevispica, Grewia and Cadaba spp. Some of the following are regarded as nutritious all year and at all growth stages (e.g. Cenchrus ciliaris, Themeda triandra, and Chloris roxburghiana) while others are of greatest value only during rapid growth phases (e.g. Pennisetum, Cynodon, Dactyloctenium, Enteropogon and Leptothrium spp.
Plant species distributions in relation to environmental variables
Tables A6 to A10, Annex A, were derived from Corra (1986) and depict the distribution of 55 key plant species according to elevation, soil colour, slope, vegetation type and soil acidity. Species towards the middle of the list in each table tend to be broadly distributed over a given environmental factor while those listed at the top or bottom are more restricted in occurrence. These data can be used to construct crude niches for species that could be useful as guidelines for range rehabilitation and/or further research (see Section 7.3.1: Range management and improvements). For example:
1) Acacia tortilis, an important forage tree, has a wide range over all factors investigated;2) A. horrida, an invading woody species in the vicinity of Sarite ranch, tends to be found more on flat terrain at elevations less than 1550 m in bush grassland or bush thicket community types;
3) Juniperus procera, an important limber-producer for urban construction, tends to be found in woodlands on reddish soils derived from basement-complex substrates, on steep slopes and at elevations above 1600 m;
4) Cynodon dactylon and Cenchrus ciliaris, important herbaceous forages, have wide ranges over all factors investigated; and
5) Themeda triandra, another important herbaceous forage, tends to occur over 1200 m on a wide range of basement-complex soils and slopes in woodland and grassland formations.
The interaction of environmental features on plant species distribution was clarified by the ordination exercise for 75 species using CANOCO (Figure 2.8). The diagram includes: (1) two main horizontal and vertical axes; (2) seven vectors (arrows) that represent increasing value for continuous environmental variables; (3) discrete (presence/absence) environmental variables whose geometric means are represented in the graph space by triangles only (not by vector arrows); and (4) 75 "average location points" on the graph for each species.
Where continuous variables include: (1) ALTITUDE = elevation in metres, with higher values occurring to the right side of the figure and lower values to the left; (2) BEDROCK, TREECOV, SHRUBCOV, GRASSCOV, TOTALCOV and BARESOIL represent per cent cover for exposed rock, trees, shrubs, herbaceous plants, total vegetation and bareground, respectively. Cover values increase in the direction of the associated vector arrow; (3) SLOPE = slope in degrees from a horizontal plane. Slope also increases in the direction of its vector arrow; (4) SOILCOLR = hue of top soil ranging from browns and greys to the left of the figure to reds on the right. Discrete variables include: (1) presence or absence of SHEET or GULLY erosion and (2) vegetative physiognomic class, where VEGSTRU1 = woodland, VEGSTRU2 = bush-thicket, VEGSTRU3 = grassland, VEGSTRU6 = bushland, and VEGSTRU7 = bush-grassland. Species include Aca bre = Acacia brevispica; Aca bus = A. bussed; Aca dre = A. drepanolobium; Aca etb = A. etbaica; Aca fis = A. seyal v. fistula; Aca hor = A. horrida; Aca mel = A. mellifera; Aca nil = A. nilotica; Aca nub = A. nubica; Aca pao = A. paollii, Aca ref = A. reficiens, Aca sen = A. senegal; Aca sey = A. seyal v. seyal; Aca tor = A. tortilis; Ade obe = Adineum obesum, Alb ama = Albizzia amare; Ari ado = Aristida adscensionis; Asp mos = Aspilia mossambicensis; Bal aeg = Balanites aegyptica; Bos ang = Boscia angustifolia; Bos min = B. minimifolia; Bos hil = Boswelia hildebrandtii; Cad far = Cadaba farinosa; Cad gla = C. glandulosa; Cad rot = C. rotundifolia; Cen cil = Cenchrus ciliaris; Chl gay = Chloris gayana; Chl rox = C. roxburghiana; Com acu = Combretum aculeatum, Com mol = C. molle, Com afr = Commiphora africana; Cor sin = Cordia sinensis; Cyn dac = Cynodon dactylon; Dac oeg = Dactyloctenium aegyptium; Del ela = Delonix elata; Dic cin = Dicrostachys cinerea; Dob gla = Dobera glabra, Dod vis = Dodonia viscosa, Ent mac = Enteropogon macrostachyus; Euc ach = Euclea sp; Eup can = Euphorbia candelabrum; Eup tir = E. tirucalli; Gre bic = Grewia bicolor; Gre tem = G. tembensis; Har ach = Harpachne sp, Het con = Heteropogon contortus; Jun pro = Juniperus procera; Kle lon = Klenia longiflora; Lep aen = Leptothrium senegalense; Lin nut = Lintonia nutans; Mic kun = Microchloa kuntii; Orm tra = Ormocarpum trachycarpum; Ozo ins = Ozoroa insegnis; Pap cap = Pappea capensis; Pen mez = Pennisetum mezianum; Ric com = Ricothamnus sp; Sal per = Salvadora persica; Sch ner = Schoenefeldia sp; Sch tra = Schoenefeldia transiens; See riv = Sesamothamnus rivae; Ser fal = Sericocomopsis pallida; Sol inc = Solanum incanum; Sph uka = Sphaeralcea sp, Spo pyr = Sporobolus pyramidalis, Ste rhy = Sterculia rhynchocarfa; Sve lae = Svensonia laeta, Tar cim = Tarcothamnus cinerea; Ter bro = Terminalia brownii; Tet cen = Tetrapogon cenchroides; The tri = Themeda triandra; Tri ter = Tribulus terrestris; Ver sin = Vernonia cinerascens; and Xim ame = Ximenia americana. Species were selected because they illustrated variability in response to environmental factors.
The diagram is interpreted by understanding that: (1) the most influential continuous variables (i.e. vector arrows) on plant species distribution are those arrows which are: (i) closest to running parallel to the horizontal or vertical axes; and (ii) also happen to be greater in length; and (2) species points are located relative to the arrows and isolated triangles that represent discontinuous variables. Another point of clarification concerns how to visualise trend in the diagram. For example: (1) higher altitudes are to the right of the figure and lower altitudes are to the left; (2) slopes become steeper towards the top of the figure and flatter towards the bottom; (3) soil colour changes on a continuum from browns and greys to the left of the figure to reds on the right. If discrete variables (represented by triangles) end up near the intersection of the two main axes, their explanatory value in terms of influencing plant species distributions was interpreted as lower in the analysis. For example, VEGSTRU1 indicates the epicenter of the woodland type, and GULLEY indicates the epicenter of the gully erosion sites. The results are interpreted as follows:
1) because their vectors were closest to the horizontal and vertical axes, altitude and percentage of exposed bedrock were the main explanatory variables for plant species distributions overall. Together, altitude and per cent exposed bedrock explained 82% of the total variation with about 60% explained by altitude alone (note that this is also indicated by the greater length of the altitude arrow);2) bedrock exposure, however, was also related to several other factors. As per cent bedrock exposure increased, so did slope and per cent tree and shrub cover (Figure 2.8). These conditions are all consistent with ascending a mountain, for example. Similarly, as per cent bedrock decreased per cent grass cover increased, consistent with lowland sites. The vector for soil colour ran opposite that for altitude, indicating that as altitude decreased sites were dominated by more brown and grey soils. Soil colour, however, had relatively little influence in the analysis overall as indicated by the angle and short length of its vector arrow; and
3) overall, the distribution of species points is perhaps most notable because of the relative lack of distinct clustering. This suggests that over the range of environmental variables examined, most species appeared to be widespread in distribution. However, some key indicator species emerged and these help in interpreting the diagram: (1) J. procera appears in the upper right-hand corner with Aristida adscensionis, and this suggests an association of these species at high altitudes, on steep slopes and in concert with other associated factors previously described; (2) T. triandra (in the lower right quadrant) occurs at a somewhat lower elevation and flatter slopes on redder soils and (3) A. horrida (near the top of the lower left quadrant) occurs on flatter slopes on brown/gray soils at lower elevations.
In sum, the main point is that altitude (and the corresponding factors of rainfall and temperature) is strongly related to other variables including exposure of bedrock, type of plant cover, soil colour and soil reactivity as the main explanatory factor overall for plant species distributions. The majority of plant species were notable, however, for their wide distribution in the study area. Because of this it was decided not to define specific plant communities or associations from the CANOCO analysis (Michel Corra, ILCA, personal communication).
To date there have not been any comprehensive studies of wildlife in the southern rangelands. Including wildlife issues into a comprehensive development and management strategy is desirable, however, and that is why wildlife resources are briefly reviewed here.
The only systematic wildlife data collected by ILCA on the Borana Plateau are a few tabulations of ostriches (Struthio camelus) and large herbivorous mammals from aerial surveys in 1983 to 1985 (Assefa Eshete et al, 1987). Other efforts to inventory wildlife or regulate its exploitation in the study area have been limited, being conducted out of a small government office in Yabelo.
Wildlife interests are represented at higher levels on interdepartmental committees within the Ministry of Agriculture when key policy issues regarding local resource management come under review. One example is the re-introduction of prescribed fire in the southern rangelands to help control bush encroachment, a proposed policy change reviewed in 1990-1991 (see Section 7.3.1.4: Site reclamation). There has been a recent and increasing interest in conducting formal surveys and studies to quantify wildlife resources in the southern rangelands as well as to better understand interactions among wildlife, livestock and pastoralists. Such work has been proposed to help form the basis for establishing a controlled system of nature preserves and would be a collaborative effort between Ethiopian and foreign institutions (C. Hillman et al, Ethiopian Wildlife Conservation Organisation, personal communication).
The large mammalian and avian species in the study area are generally those which thrive under conditions of restricted availability of drinking water. Most of the species are thus common elsewhere in arid and semi-arid East Africa. Some key species reported here were observed by ILCA staff in the study area during 1985-1990, usually from sightings of live animals or examination of road mortalities. What follows is not intended as a comprehensive listing. Common and Latin names given here follow Haltenorth and Diller (1977) and Williams and Arlott (1980):
1) predatory and/or scavenging mammals include: lion (Panthera leg), cheetah (Acinonyx jubatus), caracal (Caracal caracal), serval (Leptailurus serval), spotted hyena (Crocuta crocuta), striped hyena (Hyaena hyaena), aardwolf (Proteles cristatus), black-backed jackal (Canis mesomelas), bat-eared fox (Otocyon megalotis), civet (Viverra civetta) and Egyptian mongoose (Herpestes ichneumon). Black colour phases for the serval, and possibly for caracal, have also been observed. Lions and spotted hyenas constitute the main predatory threat to livestock;2) herbivorous mammals include: warthog (Phacochoerus aethiopicus), North African crested porcupine (Hystrix cristata), Grevy's zebra (Hippotigris grevyi), Burchell's zebra (H. quagga), gerenuk (Litocranius walleri), gazelle (Gazelle spp), oryx (Oryx gazelle), lesser kudu (Tragelaphus imberbis), bushbuck (T. scriptus), Gunther's dik-dik (Madoqua guentheri), giraffe (Giraffe camelopardalis) and Cape hare (Lepus capensis). Swayne's hartebeest (Alcelaphus buselaphus Swaynei), considered a threatened subspecies in Ethiopia, was never seen by ILCA staff but a small number reportedly occur to the north near Yabelo (Haltenorth and Diller, 1977: p 83; C. Hillman, Ethiopian Wildlife Conservation Organisation, personal communication). The large herbivores have only been observed as individuals or in small groups. There are no large herds per se that could conflict with pastoral land use today. Except for occasional feeding on cultivated legume plots by kudu (Hodgson, 1990) or raids by warthogs on maize fields (D. L. Coppock, ILCA, personal observation), it can be said that the large herbivores pose no constraint to the livelihood of the pastoralists. This is unlike situations for the pastoral Maasai where wildlife can be a major competitive factor for forage and habitat (Pratt and Gwynne, 1977);
3) primates include the olive baboon (Papio cynocephalus) and vervet monkey (Cercopithecus aethiops). Baboons, as elsewhere in Africa, are a threat to maize fields;
4) predatory and/or scavenging birds include: Secretary bird (Sagittarius serpentarius), whiteheaded vulture (Trigonoceps occipitalis), hooded vulture (Necrosyrtes monachus), Egyptian vulture (Neophron percnopterus), bateleur (Terathopius ecaudatus), pale chanting goshawk (Melierax poliopterus), tawny eagle (Aquila rapax), black kite (Milvus migrans) and black-shouldered kite (Elanus caeruleus);
5) other birds include: ostrich (Stwthio camelus), crested francolin (Francolinus sephaena), yellow-necked spurfowl (F leucoscepus), helmeted and vulturine guinea fowl (Numida meleagris and Acryllium vulturinum, respectively), kori bustard (Ardeotis kori), white- and black-bellied bustards (Eupodotis senegalensis and E. melanogaster, respectively), crowned plover (Vanellus coronatus), ring-necked dove (Streptopelia capicola), namaqua dove (Oena capensis), orange-bellied parrot (Poicephalus rufiventris), white-bellied go-away-bird (Corythaixoides personata), nightjars (Caprimulgus sp), Abyssinian roller (Coracias abyssinica), African hoopoe (Upupa epops africana), red and yellow-billed hornbills (Tockus erythrorhynchus and T. flavirostris), Von Der Decken's hornbill (T. deckeni), D'Arnaud's barbet (Trachyphonus darnaudii), rosy-patched shrike (Rhodophoneus cruentus), honeyguides (Indicator sp), taita fiscal (Lanius dorsalis), grey wren warbler (Camaroptera simplex), grey tit (Parus afer), golden-breasted bunting (Emberiza flaviventris), paradise whydah (Steganura paradisaea), Speke's weaver (Ploceus spekei), red-billed buffalo weaver (Bubalornis niger), white-headed buffalo weaver (Dinemellia dinemelli), gray-headed social weaver (Pseudonigrita arnaudi), black-capped social weaver (P. cabanisi), white-crowned starling (Spreo albicapillus), superb starling (S. superbus), golden-breasted starling (Cosmopsarus regius), red-billed oxpecker (Buphagus erythorhynchus), black-headed oriole (Oriolus larvatus), dwarf raven (Corvus edithae) and the Abyssinian bush crow (Zavattariornis stresemanni). The last species is the only one endemic to the study area (Williams and Arlott, 1980: p 399);
6) common reptiles include a variety of non-venomous and venomous [cobras (Naja spp), black mamba (Dendroaspis angusticeps), puff adder (Bitis arietans)] snakes. Some of the poisonous snakes are responsible for a few livestock mortalities (Donaldson, 1986: p 40). Other reptiles include lizards (Agama sp) and leopard tortoises (Geochelone spp); and
7) termites (unknown spp) are widespread on both red and grey soils. They are mentioned here because they reportedly play important roles in nutrient processing and cycling in African savannahs (Morris et al, 1982). Termites are also an important constraint to several development activities such as grain storage and hay making among Borana pastoralists (Hodgson, 1990; see Section 7.3.1.3: Forage improvements). Bruchid beetles (Callosobruchus spp) are important parasites on acacia seeds (Tamene Yigezu, 1990; Menwyelet Atsedu, 1990). They probably have a role in the population regulation of trees (see Section 3.3.4: Population ecology of woody species) and their infestation of A. tortilis fruits constrains storage of these materials for use as protein supplements for livestock in dry periods (see Section 7.3.1.3: Forage improvements). Tick species are numerous (Hill, 1982; Nicholson, 1985) and constitute major threats to animal health and milk production (see Section 5.4.3: Cattle mortality and health). Tsetse flies (Glossina spp) occur in woody habitats along the Dawa River (Figure 2.2) and are known to spread trypanosomiasis among camels which browse along the Dawa in dry periods (Sileshi Zewdie, SORDU veterinarian, personal communication). Tsetse flies also occur along the Segen River near the border with Gamu Gofa. Boran in the Teltele area graze cattle along this river during dry periods (Menwyelet Atsedu, Colorado State University, personal communication).
The study area thus has a rich fauna, but the status of key populations is unclear. It seems reasonable to speculate, however, that the larger mammalian herbivores and carnivores are under chronic pressure from the pastoralists given the high densities of people and livestock in the region (see Section 7.2: A theory of local system dynamics). It has also been reported that a large decrease in the local wildlife populations occurred as a result the conflict between Ethiopia and Somalia in the late 1970s. Larger herding mammals were driven to northern Kenya and apparently never returned (Menwyelet Atsedu, Colorado State University, personal communication). ILCA staff commonly observed the larger wildlife species on the government ranches at Dembel Wachu and Sarite, which appeared to provide superior forage biomass and cover. The ranches were typically understocked with SORDU cattle and excluded pastoral herds (D. L. Coppock, ILCA, personal observation; see Section 3.4.2: Environmental change). These ranches are in the process of being returned to the pastoralists (see Section 1.4.5.5: Ranch development) and this may bode ill for wildlife. Making proposed nature preserves compatible with the realities of intense livestock exploitation is a key priority in integrated resource management and requires surveys of possible refuge areas where the pastoralists have been less able to herd their stock because of lack of surface water. These include the steep mountainous sites throughout the study area. Getting local people involved in sharing the benefits of wildlife conservation may represent the most viable strategy over the long term (Pratt and Gwynne, 1977).
Long-time residents of the southern rangelands do report that species such as giraffe appear much less abundant today than a generation ago (Tafesse Mesfin, TLDP General Manager, personal communication). It is reasonable to hypothesize that pressure on species such as giraffe has come from traditional use of their hides to make buckets for lifting water from the deep wells and collecting milk (see Sections 2.4.1.7: Water resources and 4.3.5: Dairy processing and marketing). Other species like zebra may be desired for products traditionally perceived to have medicinal value (D. L. Coppock, ILCA, personal observation).
Despite the fact that the Borana pastoralists are heavily armed, there has never been any indication in 10 years of household surveys (see Section 4.3.1: General household structure and economy in average rainfall years and Section 6.3: Results) that wildlife products are routine or significant components of the pastoral household economy. The people have never been observed to eat wild mammals, game birds or eggs, although this may occur to some degree in the poorest households during difficult times. it is thus speculated that competition for habitat would be the prime factor Underlying most of the interactions among pastoralists and wildlife here, as postulated for other pastoral systems in East Africa (Pratt and Gwynne, 1977: p 222). Hunting per se may only be an important factor for a few key species. For example, lions occasionally prey on pastoral stock in the study area, and groups of men attempt to hurt them (D. L. Coppock, ILCA, personal observation). Certain regions are also recognised as more favourable for lions for their increased bush cover (see Section 3.3.1: Ecological map and land use).
The Boran reportedly have a conservation ethos for flora and fauna that is highly developed (Kassam and Gemetchu Megerssa, 1990). Aspects of this will be reported in Chapter 8: Synthesis and conclusions.
The water resource on the central plateau is perhaps the most fundamental feature that has shaped Borana society (Helland, 1980b; Cossins and Upton, 1987; Bassi, 1990). The deep wells in particular are a focal point for social organization and ritual (Helland, 1980b). Surface water has traditionally been scarce in the southern rangelands, and during the past 16 years TLDP has espoused a conservative policy of water development in order to avoid problems of social disruption and range degradation observed elsewhere in Africa as a result of uncontrolled water development (Girma Bisrat, PADEP Coordinator, personal communication). This policy has been maintained in the face of local pressure and official influence to develop water access in the form of boreholes (AGROTEC/CRG/SEDES Associates, 1974i; EWWCA, 1987).
This section describes the major water resources traditionally used by Borana pastoralists. Activities to develop water resources by governmental and non-governmental organizations are described in Section 7.3.1.1: Water development activities.
Water resources in the study area are dominated by the deep wells which are not found elsewhere in SORDU. The study area is thus not representative of the southern rangelands as a whole in terms of water. In over 70% of SORDU (particularly to the east, far north, south and west of the study area), water for livestock and people traditionally has been procured from ephemeral ponds, perennial springs, the perennial Dawa River, a very few seasonal streams and shallow temporary wells dug in stream beds during dry periods. The ethnic groups in these areas include Somali, Garri, Gabra, Burgi, Konso and others (AGROTEC/CRG/SEDES Associates, 1974e; 1974f; 19749) who reportedly prefer to move animals to distant water sources dry periods rasher then invest a large effort in digging permanent wells (AGROTEC/CRG/SEDES Associates, 1974i: p 72).
The Boran mostly use ponds in rainy periods and wells in dry periods to supply water for people and animals. These sources have different costs and benefits. The ponds are easily accessed but are available for only a short period of time. The wells are usually a permanent source of water, but require a large input of labour to lift water to the surface. Social rights of access vary with seasonal and perennial water sources (Helland, 1980b) and these are highlighted below.
The wells: Associated resources and social institutions
In a comprehensive survey by AGROTEC/CRG/SEDES Associates (1974i), the southern rangelands were demarcated into two large regions with differing water-bearing properties: (1) a Basement-complex formation dominant to the west with more favourable water storage characteristics; and (2) a stratigraphic sequence to the east. The survey also reported that there was a total of 543 hand-dug wells which occurred to the west, clustered in some 35 to 40 groups broadly classified as either crater, shallow (adadi), or deep (tula) wells (Helland, 1980b; Cossins, 1983c; Donaldson, 1983; Cossins and Upton, 1987). AGROTEC/CRG/SEDES Associates (1974i) estimated that all hand-dug wells represented 96% of the permanent traditional water points on the central plateau. Wells were mapped, and measures of well depth, water discharge and water quality (physical and chemical factors) reported in AGROTEC/CRG/SEDES Associates (1974i; 1974j). The extractable water volume from all traditional sources of permanent water (wells and springs) was calculated to be about 13800 m3/day during the dry season of 1972 to 1973, with the hand-dug wells providing 84% of this total. Wells located on alluvial substrates were estimated to yield 54% of the total well water, followed by 31% from those on basement-complex formations 9% from those on sedimentary formations and 6% from those on volcanics. The wells were estimated to provide about half of the annual water requirement for people and stock, with ephemeral ponds providing most of the remainder. Many of the largest and most reliable wells have been dug in the highly fractured Precambrian (gypsum and granite) rocks that offer numerous large and discrete aquifers. One conclusion of the work on water quality was that, while water from all wells was uniformly drinkable, the quality was generally regarded to be highest from wells on volcanic substrates (AGROTEC/CRG/SEDES Associates, 1974i: pp 73-74); Nicholson, 1984).
The wells usually occur in groups of four to 20. Crater wells can be found in the bottom of volcanic craters such as at Dilo Goraye or Medecho. Adadi wells consist of wide shafts dug into alluvium and can be up to 10 m deep (Helland, 1980b; Cossins and Upton, 1987). The tula (deep) and crater wells, however, are usually much deeper and require a massive excavation with shafts commonly sunk into rock. Shallow adadi wells may be dug at any time and thus can be an opportune source of water. Tula and crater wells, in contrast, are old; it is often contended that they were dug by another ethnic group possibly more than 500 years ago (M. Bassi, Institute of Ethiopian Studies, personal communication). Helland (1980b) cites Haberland (1963) who believed that the wells had been dug by an unknown Megalithic culture. Helland (1980b) reported that the Boran claim that the wells had been dug by the Warday, a southern Oromo people who were expelled by the Boran and now reside in Kenya (see Section 2.4.2.1: History Helland (1980b), however, also cited Asmarom Legesse (1973) as accepting the idea that the Boran dug the wells themselves.
If the Boran inherited the wells, they have had to adjust their original social system to provide sufficient labour for operation of the well system. Regardless, at least until very recently, new wells have not been excavated. Old wells, however, have been easily brought back into service since 1989, presumably to help cope with a high cattle population (see Section 7.2: A theory of local system dynamics). These are cases where old cave-ins or erosion had to be cleaned out. While this can be difficult, it represents a far easier task than starting a new excavation (Hodgson, 1990; Tamene Yigezu, SORDU manager, personal communication). There has been more pressure in the last few years from the Boran on SORDU to dig new wells using modern machinery, but this has been resisted. The Boran have proposed to pay for this with cattle sales (see Section 7.3.1.1: Water-development activities). Examples of new wells being initiated with pastoral resources are reported later in this section.
The tula wells comprise the most reliable sources of water. They are reported to have a smaller discharge of water during dry and drought years (EWWCA, 1987), or when a watershed just happens to receive lower than average moisture in an otherwise average rainfall year (D. L. Coppock, ILCA, personal observation). Nine groups of tula wells to the east are reported to never dry up, even during severe drought (Cossins and Upton, 1987). It is these wells and their surrounding foraging regions that comprise the last fall-back regions during a severe drought (see Section 6.3.1.1: Livestock dispersal and herd composition).
The tula wells are impressive feats of engineering (Figure 2.9 a,b; Plate 2.2 a,b; Helland, 1980b; Cossins, 1983c; Donaldson, 1983; Cossins and Upton, 1987). Animals and people enter the well site by traveling down a long (i.e. 50 to 150 m) narrow ramp flanked by high earthen walls. Entry is regulated by an individual on duty at the gate of a thorn fence who enforces the prescribed order of herds to be watered each day. The drinking area for animals is a large flat platform (dargula) some 5 to 10 m below the ground surface. The dargula also has a supervisor who helps keep the watering and exit of stock orderly. The well proper consists of several parts. The water source (madda ella) is accessed by a shaft up to 30 m deep which may be 1 to 3 m in diameter. At the top of the shaft is a large storage basin (of hundreds of litres capacity) called fetchana, several metres above which is a system of clay watering troughs (naninga) that services Up to several dozen cattle and other stock at a time. A chain of 5 to 20 people (usually males and referred to as a gogessa) (Helland, 1980b)] stands on lashed wooden platforms or rocky protrusions in the shaft and pass water from the madda ella to the fetchana. One to three more people (youths and adults of both sexes) pass water from the fetchana to the naninga. Water is passed using small durable leather buckets (2 to 5-litre capacity). These buckets (okole) often have a thumb hole in one of the two upper corners and are traditionally made of giraffe or buffalo hide (Donaldson, 1983; Cossins and Upton, 1987). With the increased scarcity of these wildlife species, plastic or metal containers are more commonly used nowadays. These are more awkward to handle than the traditional ones (Hodgson, 1990).
Figure 2.9 Schematic diagrams of a tula well on the Borana Plateau: aerial view - Source: Cossins and Upton (1985).
Figure 2.9 Schematic diagrams of a tula well on the Borana Plateau: lateral view. - Source: Cossins and Upton (1985).
Plate 2.2 Cattle drinking at a naninga attached to a fetchana. - Photograph: JEPSS
Lifting water begins early in the morning to first fill the fetchana. After this a steady flow of water is maintained from the madda ella to the fetchana and from the fetchana to the naninga; this whole task is physically intense (Cossins and Upton, 1987) and is spurred by rhythmic chanting. After a few hours the work crews are replaced. Rates of water extraction have been estimated as 2.4 to 7.5 m3/hour (Cossins, 1983c). During periods when water discharge is low or the number of animals to be watered is high, watering may continue through the night aided by light from torches. Leakage of water from buckets, fetchana and naninga have been identified as sources of inefficiency in water lifting and some development solutions have been proposed and/or implemented (Cossins, 1983c; Cossins and Upton, 1988b; Hodgson, 1990; see Section 7.3.1.1: Water-development activities.
A continuous and coordinated supply of labour is thus essential to the smooth functioning of tula wells (Helland, 1980b; Cossins, 1983c; Donaldson, 1983; Cossins and Upton, 1987). Labour is supplied by the users of each well. In contrast to the demand for labour to herd cattle whereby one herder can manage some 50 came at least, the demand for labour to lift water is more of a direct linear relationship between numbers of people and animals and may underscore a key management constraint in the system. Members of poorer households may supply labour to water larger herds of the wealthy, and in exchange the poor receive food and an occasional promise of a future calf (Cossins and Upton, 1987). Labour is also needed to regulate animal traffic, constantly sweep the ramp and platform of loose soil, collect manure and to repair the naninga each morning with fresh clay.
Water rights indirectly confer grazing rights by virtue of gained access to nearby forage. It has been estimated that the grazing radius of cattle from a water source is on the order of 16 km (Helland, 1980b; Cossins and Upton, 1987). Access to local grazing due to water access is only mediated when needs of herds with different production priorities are considered. Lactating herds (Ioni warra) based at olla reportedly have the grazing priority over satellite herds of dry cows and males (Ioni forra). Haberland (1963), as cited by Helland (Chr Michelson Institute, personal communication), stated that a herd already occupying a given grazing area has priority over others that want to enter.
The labour required to lift water places a very high demand on the population during dry periods. Data in Table 2.2 indicate that from 1 to 60% of available people in different regions may be required to lift water from various wells on a given day in the warm dry season.
Wells are usually located within a two to four hour walk from encampments or villages (olla see Section 4.3.2: The encampment and the role of cooperative labour). Olla can have anywhere from 4 to 60 households, but average 10 to 15. Many olla form a circle or semicircle within a 10 to 16-km radius of a given well group. Cossins and Upton (1987: p 203) state that visually all olla lie within 16 km of a well. The olla supply animals to be watered and labour to operate the wells. In the dry season cattle are commonly watered once every three days, small ruminants once every five days and camels once every 8 to 14 days (Cossins and Upton, 1987; see Section 5.4.4: Cattle productivity and watering frequency). These watering regimes represent an attempt to optimise labour input in livestock management (Cossins, 1983c; Cossins and Upton, 1987). The average number of 250-kg Tropical Livestock Units (TLUs) watered per 3-day cycle at particular wells may average from 5000 to 17700 in the central and eastern zones of the study area, respectively (see Figure 2.7 for a map of zones (Cossins and Upton, 1987)). Donaldson (1983) estimated that individual well groups could service from 3500 head in a 3-day watering cycle at Arabelle in the west to 47000 head at Burbur (or Borbor) to the east. Cossins and Upton (1987: p 205) calculated that the only region where well water is not a significant constraint, compared to forage, is to the east. Water shortages that result in unexploited grazing may be most acute to the west and north (Cossins and Upton, 1987).
1 Estimated from aerial survey of population and household demographic structures extrapolated within the proximity of 139 wells.2 Includes active workers and those held in reserve.
3 Wells included tula, adadi and crater types combined.
4 Where E/F = ella to fetchana stage; F/N = fetchana to naninga stage; and D = Dargula stage. For definition of terms, see the text.
The watering schedule is formulated by a well council composed of well Users (chora ella) (Helland, 1980b; Cossins and Upton, 1987; Bassi, 1990). Every well belongs to a particular clan (Helland, 1980b). Clans are intermediate levels of organization in the kinship system (Asmarom Legesse, 1973: p 39). There are about 17 clans in the Borana system divided among two social moieties (Asmarom Legesse, 1973; M. Bassi, Institute of Ethiopian Studies, personal communication). In the classic sense, the clan in Borana is composed of families claiming descent from a common male ancestor. The clan affiliation of a particular well corresponds to the identity of the abba ella or well father (Helland, 1980b). The responsibilities and accompanying duties that underpin the relationship between an abba ella and his well is known as confi and is a sort of trusteeship. The confi is patrilinearly inherited and cannot be lost, even if the well collapses through disuse and someone else re-excavates it (Helland, 1980b). The confi may be transferred to a caretaker on a temporary basis if the abba ella moves elsewhere. In this case the holder of the confi is under the scrutiny of clan elders who ensure that the caretaker fulfills his obligations in accordance with the Ada-Sera Borana, or the customs and laws of the Boran (Helland, 1980b).
Daily routines at the well such as cleaning ramps, repairing small cave-ins and lifting water are supervised by an officer known as an abba hirega or father of the watering order, who is appointed by the well council (Helland, 1980b). The watering order (or rotation) usually lasts three or four days. On day one the holder of the confi usually functions as abba hirega (Helland, 1980b). Overall authority over use of the well is vested in the well council. Watering rights in any well must be gained and maintained through participation in the well council, and watering rights indirectly confer grazing access rights (Helland, 1980b; Bassi, 1990). Setting the watering rotation is the most important task of the well council, because this implies allocating watering privileges when water volume is a constraint, such as in a dry year or drought (Helland, 1980b; Bassi, 1990). A recent example of this was a situation where a non-resident herdowner with a very large cattle herd needed access to a certain well. He was not denied access, but instead was relegated to be last in the watering order. The constraints of having to water cattle at night because of low water discharge in this particular dry season meant that the herd had to be moved elsewhere (M. Bassi, Institute of Ethiopian Studies, personal communication).
There are also limits on the number of cattle that can be watered for a given herdowner. Owners with more than 200 head can be turned away, particularly if they have not recruited enough labour and/or local forage resources are in short supply (D. L. Coppock, ILCA, personal observation). This illustrates the contention that there are few explicit or formal rules governing access to wells, but that access is indirectly governed through contacts, persuasion and competition (Helland, 1980b). In principle, a clansman of an abba ella cannot be formally excluded from a particular well but inspection of watering orders reveals that there are many exceptions (i.e. users who are not clansmen). Bassi (1990) reported eight groups of clans that appeared to collaborate in the management and use of wells.
Clan affiliation is thus just one factor needed to gain access to a given well, but clan organization of the Boran is cross-cut by other organising principles such as the Gada system and age sets or Hariya (Helland, 1980b; see below). Clans are also linked by marriage, friendship and other alliances, and all are legitimate bases for claiming watering rights (Helland, 1980b). In support of this view, Bassi (1990) noted that descent relationships other than clan-based ones allowed access to wells, but seniority within a clan usually had a prioritising function. Bassi (1990) also found that descendants of persons who had donated cattle in support of the original excavation of wells (abba mere) also had special access rights, regardless of other descent linkages. People who had certain personal relationships with the abba ella also gained access, as did those who merely joined their cattle with another herd which already had user rights (Bass), 1990). Helland (1980b) reported that key decision makers can be bribed. Gaining access to a well also depends to a large extent on how successful a man is in presenting and defending a claim before the well council (Helland, 1980b). Council meetings are informal and any man can attend and voice his opinion. Decisions are made by gradually reaching consensus within the framework of continual reference to the Ada-Sera Borana (laws and customs). Concepts of legality and legitimacy are flexible to allow for individual interpretations of rules (Helland, 1980b; Bassi, 1990). It is also likely that acute problems with forage supply enter the assessment of whether well access can be granted in a particular area (Cossins and Upton, 1987) and this may override other considerations to favor local residents over immigrants during periods of crisis (see Section 7.2: A theory of local system dynamics).
Participation in well excavation can also be important to gain future access to water. Bassi (1990) reported that traditionally a well can be dug on behalf of an individual or clan. If initiated by an individual, he pays at least a large part of the expenses himself. He can become the abba ella of the well and choose who uses the water with him. If initiated by a clan, clan members share all expenses and use follows the traditional model described in Helland (1980b). Bassi (1990) reported the outcome of two general meetings held in 1989 where the excavation of new wells at Dubluk was discussed. The Dubluk well was dug at the initiative of a local Borana administrator who paid about EB 3300 of the expenses himself. It was later determined, however, that a clan could use the well and the administrator was refunded by clan members. Bassi (1990) noted that cash, not cattle, was collected for the reimbursement, showing the Boran had adapted to changed economic circumstances. Cattle have been the traditional form of remuneration for well excavation work (Asmarom Legesse, 1973).
The wells influence one level of land use referred to as madda. Most Boran live and herd their milking animals in one madda (Hogg, 1990a). There are about 35 madda on the central plateau with an average size of 500 km2. These were first mapped in the early 1980s and have been used as a basis for regional administration and tax collection by the government (Hogg, 1990a). A 500-km2 madda can contain around 100 olla, 4000 people, and 10000 cattle (see Section 4.3.2: The encampment and the role of cooperative labour). A madda map is shown in Figure 2.10. The delineation of fixed boundaries is misleading because tradition allows people and animals to move among madda. Hogg (1990a) defines madda as regions in which the residents have defined rights of access and responsibility for the upkeep of a particular group of wells. In a similar definition oriented towards water, the term madda links the life-giving properties of water to the Borana world view and can be translated from Oromigna as "origin", "springs" or "wells" (J. Helland, Chr Michelsen Institute, personal communication).
People have the right to use wells in other madda with permission. This is more common for Ioni forra (satellite dry) herds which can roam outside their home madda to avoid resource competition with Ioni warra (resident milking) herds (Cossins and Upton, 1987; Hogg, 1990a). Some madda, particularly to the east, are prioritised for Ioni forra on a collective basis and have traditionally served more as reserved grazing areas during drought rather than madda having a large population of permanent residents (see Section 6.3.1.1: Livestock dispersal and herd composition). Haberland (1963) also emphasised that madda do not correspond to clan territories, but instead serve many clans.
Clans have no norms for common residence and rather serve as regionally dispersed systems for social networking to obtain access to a wider array of resources (Bass), 1990). For example, although each well in a cluster of 15 may primarily serve one clan, members of all of the 15 clans would probably have access to much of the same grazing. While Hogg (1990a) defines madda in terms of water rights, he also listed madda as only one level of territorial organization. This interpretation may be disputed (J. Helland, Chr Michelsen Institute, personal communication). The role of madda as territorial units may be more implicit than explicit. It is also possible that madda function as territories or common areas in a dynamic fashion depending on resource availability. Some madda boundaries were observed to be closed to non-residents during times of scarce grazing in the dry season of 1989-90, but there was intense social pressure to reopen these borders (D. L. Coppock, ILCA, personal observation). It is also possible that some functions of madda evolve over time in response to changing population pressure or social circumstances (see Section 7.2: A theory of local system dynamics). The social diversity of madda may not allow them to be regarded as a truly cohesive organisational unit (M. Bassi, Institute of Ethiopian Studies, personal communication). Despite this madda can be useful as units for the implementation of some types of development projects that focus on widely recognised regional problems (Hogg, 1990a; Bassi, 1990).
Figure 2.11 illustrates an example of dry-season grazing radii for cattle in relation to well groupings in the study area. Areas outside the grazing orbits are accessed during and soon after rainy periods using ephemeral ponds. Improving efficiency of use for range outside of dry-season grazing orbits was a major objective behind the pond construction project undertaken by TLDP and described in Section 1.4.5.2: Water development strategy. Before the pond construction programme, it was estimated that <70% of the grazing on the central plateau was accessible to cattle using traditional water sources (N. J. Cossins, former ILCA rangelands team leader, unpublished data). Schematic diagrams of cattle grazing orbits in relation to use of ponds and wells in dry and wet seasons are shown in Figure 2.12a, b. These diagrams show a seasonally variable watering frequency of once every two to three days for Ioni warra (milking) herds in wet and dry seasons, respectively, while Ioni forra (dry) herds usually drink once every three days regardless of season. The warra herds are constrained in that they must return to the encampment each evening for milking.
The critical nature of the wells in dry-season watering of livestock is demonstrated by the information presented in Table 2.3. Of the 337000 head of livestock observed watering during the warm dry season of 1982, about 77% were watered at wells and 23% were watered at springs.
Other water sources
In their comprehensive survey, AGROTEC/CRG/SEDES Associates (1974i) noted that there were some 25 mountain springs and 31 boreholes in the SORDU region during the early 1970s, and that these contributed only about 10% and 6%, respectively, of the daily water extraction estimated for the dry season of 1972-1973. The wells provided the remainder. The boreholes were constructed in earlier development efforts and ranged from 25 to 370 m in depth. They are of no real consequence to the pastoral system overall and will not be considered further.
The springs occur mostly in sedimentary and alluvial formations (90% of the total), with the remainder located in the basement-complex and volcanic areas. Although a perennial source of water, springs are also too limited in water volume to be of anything but local consequence. Development of springs may involve simple pipe systems to better channel water to drinking areas for people and animals (Hodgson, 1990).
Another minor source of water are temporary pools, puddles and run-off (see Section 7.3.1.1: Water development activities). These are common in rainy periods and are termed Iola (Helland, 1980b). Use of this water is governed by free access, but priority may go to people who live closest to these sources (Helland, 1980b).
After the wells, ponds are the most important water source on the central plateau and are termed hara (Helland, 1980b; Hodgson, 1990). There is no formal estimate of the number of ponds in the traditional system prior to mechanised pond-development programmes which started in the 1950s (Tilaye Bekele, 1987). A map of all types of ponds in the SORDU area is provided in Tilaye Bekele (1987: p 18), but the scale may be inappropriate to enumerate all of the smaller ponds. Ponds were traditionally excavated during dry seasons when the people were still physically fit and the soil was suitably dry for easy removal. Soil removal employed simple wooden tools and hands for scooping. Metal hand tools were not widely available until the late 1980s and animal power was also never used (see Section 1.4.5.2: Water development strategy). The initiative to excavate a pond usually comes from a local leader eventually referred to as the pond father or abba hare.
Excavation starts in a place where water collects naturally and soil or silt is removed each year by individuals who expect to make use of the pond (Hodgson, 1990). It is Unclear if the abba hare provides food or cattle as remuneration to pond workers; he may only provide leadership. This may also depend on the size of the pond. The use of hare is not subject to the same degree of regulation invoked for wells, although they do need some regulation and upkeep as siltation is a recurrent problem (Tilaye Bekele, 1987). Helland (1980b) postulated that the more reliable a pond is each year, the more likely that it will receive regular maintenance of its thorn fence and Use will be monitored more closely.
In sum, while this all serves as a useful initial survey of water resources on the Borana Plateau, much of the information regarding regulation of access and even location of water points can be improved upon. Recent work in the Pilot Project (see Section 1.4.3: The SERP and the Pilot Project) has provided more accurate information on water utilization (R. S. Hogg, TLDP consultant, personal communication). A comprehensive livestock survey conducted by Solomon Desta (nd) also gives details on types and locations of water points throughout the SORDU project area.
2.4.2.1 History
2.4.2.2 Some cultural and organisational features
Since some key aspects of Borana history and social organization have already been mentioned this section will review a few more details, with emphasis on some of the complex mechanisms by which the Boran attempt to regulate human population growth, settle disputes, interpret and enforce resource-use policies and redistribute wealth. These are essential factors in understanding how best to implement technical improvements in the local economy, food security strategies and general well-being. This is not intended, however, as a comprehensive review of the large body of scholarly information on the structure, functions, rituals, politics and history of Borana society. That is beyond the scope of this volume. For an in-depth ethnographic analyses the reader is referred to Huntingford (1955), Haberland (1963) and Asmarom Legesse (1973). The last work is mostly referred to here as the benchmark source out of convenience, but it reportedly contains some controversial material (Helland, 1980b; M. Bassi, Institute of Ethiopian Studies, personal communication).
Table 2.3. Four types traditional wells and their associated livestock populations during the warm dry season (February to April) of 1982 on the central Borana Plateau.
|
Well type1 |
Livestock |
|||
|
Cattle |
Sheep and goats |
Equines |
Camels |
|
|
Tula2 |
78966 |
12440 |
3693 |
623 |
|
Adadi3 |
61495 |
23191 |
2022 |
615 |
|
Crater4 |
43104 |
51664 |
2954 |
2091 |
|
Spring5 |
46615 |
4755 |
2036 |
1045 |
|
Total |
230180 |
92050 |
10705 |
4374 |
1 For descriptions of well types, see the text.2 These include Web, Igo, Dubluk, Gayu, Das, Melbana and Elwaya.
3 These include Borbor (which alone served 75% of the came and 97% of the sheep and goats for this well type), Kobole and Romso; Elkum, Sadetei and Hobok not included (the latter was not in operation because of rains that provided surface water to the west).
4 These include Goraye, Dilo, Medecho and Megado. Kula was not included.
5 These include Dsbesso, Utalo, Arabelle, Arero, Dokole, Faro, Gobso, Saki, Tesi, Gololcha, Harwe-U and Mega; 40% of cams for this well type were served at Arero and Mega, while 76% of the camels were served at Arero. El Dima, Gulaba and Kadim were not included.
Source: Cossins (1983c).
The Boran are a branch of the Oromo (or Galla) peoples whose language belongs to the Cushitic subfamily common to most of north-eastern Africa (Asmarom Legesse, 1973). Most of the Oromo speak closely related dialects of the Oromigna (or Galliñña) language and share a common cultural heritage. The Oromo are regarded as one of the most expansive African cultures on record (Asmarom Legesse, 1973). Their spread over much of what is now Ethiopia and Kenya during the 1500s resulted from massive population growth combined with an aggressive, militaristic culture. About half of present-day Ethiopia fell under their dominance, including what are now the administrative regions of Gojjam and Tigre (Asmarom Legesse, 1973).
The cradle of Oromo culture is generally recognised as a large, rectangular area that begins at the north-central edge of present-day SORDU and extends north to the Bale Administrative Region (Asmarom Legesse, 1973). This region has many hills and mountains and includes ecosystems in the lowlands as well as the southern highlands. It is thus dominated by a much more mesic climate compared to the ILCA study area. Today these highland, humid, subhumid and upper semi-arid environments are exploited by a variety of agropastoral and farming peoples (Westphal, 1975). The closest other group to the ILCA study area are the agropastoral Gujji, another Oromo people who share many cultural features with the Boran (Asmarom Legesse, 1973; Helland, 1980b). Today some of the most important Borana shrines are found in Gujji territory (Asmarom Legesse, 1973). The centre for political and ritual activity for the Boran, however, is found in the southern rangelands.
It is unclear whether what is now the ILCA study area was invaded from the north during the Oromo expansion of the 1500s (expelling an indigenous group like the Warday; see Section 2.4.1.7: Water resources), or had already been occupied as part of the Oromo cradleland (Asmarom Legesse, 1973; Helland, 1980b; Wilding, 1985a; Hogg, 1990a). This point also relates to the question of who originally dug the wells on the central plateau. Asmarom Legesse (1973) contends that most of the traditional cultural institutions of the Oromo are still preserved among both the Gujji and Boran, implying that they have either always resided undisturbed in these areas or supplanted much weaker peoples who had little reciprocal influences on their original Oromo culture. In the Ethiopian highlands the Oromo culture has been somewhat diluted by the Amharic and Tigriñña-speaking peoples (Asmarom Legesse, 1973). There is evidence that the present Borana territory in the southern rangelands has been somewhat reduced since 1910, mostly due to Somali encroachment from the east. This is reportedly due to drought and/or overgrazing that caused the Boran to move their cattle westward with the vacuum being filled by Somali herds of small ruminants and camels better suited to the induced habitat change (Asmarom Legesse, 1973). Pressure prevails on all sides of the Boran today, however, with Somali to the east, Gujji and Arsi to the north and north-east and Hamer to the west, among others. Low-elevation desert occurs to the south in Kenya. Large-scale conflicts occurred between the Boran and Somali in the late 1970s during the Somali invasion of Ethiopia. Small isolated conflicts between the Boran and Gujji occurred to the north during the 1983 to 1984 drought when both groups were pressed for resources (P. Webb, IFPRI, unpublished data). Numerous armed conflicts occurred among Boran, Gabra, Gujji and other groups throughout the last half of 1991, largely as a result of stress from low rainfall, weapons proliferation and the demise of central governmental authority (D. L. Coppock, Utah State University, unpublished correspondence).
The Oromo expansion period was reportedly spurred by aspects of the Gada system in which periodic, outward pulses for warfare were essential cultural components (Asmarom Legesse, 1973; 1989). The Gada as a generation system (distinct from an age grade system) is introduced below. It has also been hypothesised that after the Oromo expansion the people remaining in the cradleland modified some of the tenets of the Gada system in order to provide means for population regulation (Asmarom Legesse, 1973). This could have been an attempt at cultural adaptation to crowded conditions in a core region prone to degradation, with limited opportunities for emigration. The point is that apparently at least some segments of the society shifted their cultural ways from an orientation towards high population growth rates and expansionism to one of population regulation as a response to a limited resource base. Asmarom Legesse (1973) reported the likelihood of such population control among the Boran from his demographic analysis of the 1960s. The Boran reportedly had slow rates of population growth earlier this century (see Section 2.4.3: Human population growth). A major question today is whether the people are still able to regulate population growth given a shrinking or static resource base, destabilising effects from outside the traditional sector and with no opportunities for territorial expansion (Helland, 1980b).
Kinship
In the Borana social system descent is recognised only through the male line and men and women descended from a common ancestor constitute a corporate group in that they share many collective rights and obligations. The social system is best described as a hierarchy (Asmarom Legesse, 1973: p 39). The smallest unit is the hearth (ibidda) which corresponds to the nuclear family with one male head of household, his wife or wives and children. This is followed by the warra (extended family), mana (lineage) and gosa, which broadly nests clans within submoieties and moieties.
When a woman marries she acquires the right to her own home and forms a new household unit with her husband. Married women are the household managers but are subordinate to men who serve as the household heads and represent the household to the outside world (Hogg, 1990a). The men are called abba warra or father of the households. They make the strategic decisions regarding livestock production and sales. The household is discussed further in Section 4.3.1: General household structure and economy in average rainfall years. Extended families may have all close relatives residing in the same olla, but this is not a requirement. The father of the encampment (or abba olla) is selected from among the abba warra. He is a respected individual who provides leadership, but otherwise has no special authority over other members of the olla (Haberland, 1963).
Lineages are the basic component of the descent system and are usually reported as 6 to 10 generations deep. As the basic source of the privileges, duties and identity of members, lineages determine roles in ritual, water management and wealth redistribution (Asmarom Legesse, 1973).
Clans are groups of lineages. It has been speculated that lineage members are unable to trace their links to a common ancestor (J. Helland, Chr Michelsen Institute, personal communication). Hogg (1990a), however, contends that lineages within a clan share a common male ancestor. Clans are not corporate property-owning groups, nor is it desirable that they reside in the same location; the reverse is actually more advantageous (see Section 5.3.1: General aspects of cattle management). Clan members are expected to help each other in times of hardship and clans can provide a wider network of mutual assistance than individual lineages (Bass), 1990; Hogg, 1990a). Members of clans reportedly settle their disputes amicably at clan meetings in which clan elders (jarsi gosa) use moral authority to settle disputes, imposing fines on wrongdoers and seizing property (Hogg, 1990a). Clans thus also have roles in ritual, maintenance and regulation of water resources and the redistribution of wealth (see below).
There are two moieties (Sabbo and Gona) and these represent the highest social division of Borana society (Asmarom Legesse, 1973). Members of one moiety can only marry into the opposite moiety, and moieties are approximately equal in population size, distributed evenly throughout the central plateau at the olla level. The source of social justice in the system is the balance of power between Sabbo and Gona that permeate all aspects of collective decision making. The Sabbo moiety contains three submoieties with two clans each and each clan contains from 3 to 16 lineages or minor lineages. The number of lineages and minor lineages total about 60. The Gona moiety is different. It contains two submoieties each with seven clans, but no discernible lineages. The moieties, and occasionally the submoieties, can be involved in ritual and political conflict. Moieties play a prominent role in the election of Gada councillors (see below). The men, responsible for organising the election of Gada leaders every eight years, and act as the ultimate adjudicators of major conflict, are the heads of the two moieties referred to as Kallu. They also have ritual leadership duties (Asmarom Legesse, 1973). Bassi (1990) contends that the size and operation of functional descent groups such as clans may vary depending on moiety. Moieties share duties in politics through the Gada system and the age set system (see below).
Assemblies
The Boran debate and reach consensus through assembly (Hogg, 1990a). Participation at meetings can cut across many levels in the social hierarchy. Local assemblies can deal with an issue at the household, olla, neighbourhood or madda level. Any household head can come and express his views (Hogg, 1990a). If a problem cannot be resolved at lower levels it is passed to a clan assembly or to Gada officials. The ultimate body of appeal is the assembly of all Boran (the Gumi Gayu) held every eight years in southern Ethiopia. It was last held in 1988 (see below).
Social aspects of wealth redistribution
Clans provide perhaps the best degree of networking required for reliable redistribution of wealth, as shown by the following account (M. Bassi, Institute of Ethiopian Studies, personal communication):
Clan assemblies generally occur each year from April through August except during a drought. Meetings may be called by any wealthy clan member and anyone in the clan can attend, although people in need of cattle usually dominate. A small meeting would have some 30 to 40 people and lasts about a week. All clan leaders (jalaba) must attend. There may be up to 100 such meetings each year in total, which suggests that some of the 17 or so clans have more than one meeting/year. Meetings may also be skewed towards one moiety over another; over 90% of the meetings enumerated by M. Bassi (Institute of Ethiopian Studies, personal communication) were in the Sabbo moiety. People who have lost virtually all of their cattle (referred to as quolle) petition the leaders for cows at these meetings. The clan must respond with some help, but if the quolle lost cattle through negligence or inappropriate sales the request may be denied. Losses of animals to disease may imply partial negligence while losses during drought are usually accepted as wholly legitimate. Traditionally, each of the several quolle would receive 5 to 10 milk cows, with each wealthy clan member giving at least one cow. However, it is reported that in the past decade, it has been more difficult to meet the demands of quolle, both because of an increasing number of quolle and the substantial losses of cows from herds of the wealthy during the 1983 to 1984 drought (see Section 6.3.2: Drought effects in the upper semi-arid zone).
Spirituality
The Boran follow indigenous religious beliefs. Islam has been reported to be making inroads very recently, perhaps through the small sympatric groups of Muslim Gabra (C. Fütterknecht, CARE Ethiopia, personal observation).
The Boran believe that God sent down Kallu, their supreme spiritual leader, who taught the Boran how to sacrifice animals and instructed them in the "Peace of Borana" or Naigaya Borana (Hogg, 1990a). The importance of the "Peace of Borana" should not be underestimated. It is invoked in all aspects of collective decision-making and shapes debate and consensus according to traditional values of well-being and law (Asmarom Legesse, 1973; Helland, 1980b). It helps ensure that internal disputes are settled in an egalitarian manner without violence; that cordial cooperation facilitates water-point maintenance and resource allocation; and that criminals are punished through exclusion from community resources. It is unclear whether the "Peace of Borana" has ever been transcribed. This may be an important task that underpins design and implementation of appropriate development strategies (see Chapter 7: Development-intervention concepts). It is also unclear whether Borana philosophy contains prophetic predictions of future calamity. It has been recently reported that some Boran in the ILCA study area are fearful of an imminent and ill-defined natural catastrophe perceived to be worse than the 1983 to 1984 drought (M. Bassi, Institute of Ethiopian Studies, personal communication; D. L. Coppock, ILCA, unpublished data). This is mentioned because such an outlook could have a decisive influence on the participation of the Boran in certain types of long-term development activities (see Chapter 7: Development-intervention concepts).
The Hariya age-set system, the Gada generation system and the Gumi Gayu (all Boran) assembly
Asmarom Legesse (1973: p 50) noted that the Gada system offers one of the world's richest social contexts for the study of relationships between time and human society. Describing and interpreting such a complex system in full is beyond the scope of this volume. Readers interested in details are referred to Asmarom Legesse (1973).
Asmarom Legesse noted that Borana society is stratified into two distinct, but interwoven, systems of peer-group structures for males. One is a system of age sets (Hariya) in which members are recruited on the basis of age. This is similar to age-set systems practiced by other groups such as the Kikuyu, Maasai and Nuer. Age sets are listed in Asmarom Legesse (1973: p 60) and these consist of 10,8-year blocks from age 12 to 91. Each set thus consists of similarly aged males born in the same 8-year period who share a corporate identity that evolves over their lifetimes. The members of each age set share a series of basic and collective military, economic, political and ritual duties, with a rite of passage occurring between stages. For example, a common typology of an age-set system may consist of: (1) young boys herding stock; (2) young men acting as warriors and livestock raiders; (3) mature men being eligible for herd ownership and marriage; and (4) older men assuming ritual and political duties. One common interpretation of such systems is that they are authoritarian, governed by the elderly, and serve to maintain the social and economic status quo. Asmarom Legesse (1973: pp 112-113), however, disputes this in the case of the Boran. He argues that their age-set system serves to distribute privileges more equitably across generational lines. For example, the old and young Borana males tend to have more ritual power while those at the intermediate levels tend to have more political authority. This allows, what would otherwise be marginalised, generations to have meaningful roles within the system (Asmarom Legesse, 1973: p 117). For the purpose of clarity, in this review it is assumed that the ritual and political duties in the age-set system are largely distinct from those invoked in the Gada grades (see below), although this is only occasionally explicit in Asmarom Legesse (1973).
The Gada, in contrast to age sets, is a system in which males are recruited into generation classes (lube) on the basis of genealogy (Asmarom Legesse, 1973). There are very many Gada classes, and these are in a perpetual state of being created every eight years, whereas age sets are a given. The members of a lube thus have a similar status of genealogical relatedness (but not necessarily a similarity in age), and they collectively pass through a series of Gada grades that last eight years in duration. These grades are 11 stages of social development and responsibility in relation to the philosophy of maintaining the "Peace of Borana" (see below). Compared with simple age sets, Gada systems are more unusual and complex. The Gada system of the Boran may have evolved from a simple age-set system some 500 years ago. Gada systems are also found in other Oromo people in Ethiopia such as the Gujji to the north of the study area (Asmarom Legesse, 1973). The Gada and age-set systems occur in parallel and cross-link each other at certain stages while their ultimate functions are complementary.
All Borana males thus have a position in an age set as well as in a Gada class. They are simultaneously in the process of passing through a segment of the age set and a certain Gada grade (Asmarom Legesse, 1973). Females obtain an ancillary position in a Gada class through their fathers and later husbands, but have no position in the age sets. In some respects Gada grades have roles that are grossly similar to those of age sets with the degree of similarity depending on the particular age set and grade taken. Whether a male in a certain Gada grade can perform all pertinent duties must be related to age to some degree (but this also is not explicit in Asmarom Legesse, 1973).
The key functional difference between recruits for age sets and Gada classes is that while cohorts in the age sets are similar in age, a given Gada class can contain persons that are vastly different in age. The genealogical association, for example, could be that members of a certain class are grandsons of brothers but one grandson could be an infant and the other 20 years old. The basic rule is that regardless of the age of the father, his infant son enters the grade system 40 years (i.e. five grades) behind.
The Gada grades described in Asmarom Legesse (1973: pp 52-69) and occupied by a large number of genealogical lube include:
1) Grade I (daballe) which includes all the sons born to the senior men currently in the powerful Gada grade VI (see below). These sons have a feminine appearance in terms of hairstyles and dress and are treated preferentially. They are considered to be among the principle mediators between man and God;2) Grade II (Junior Gamme) which includes 8-year old initiates from among the daballe, who consequently receive a name and a masculine status. They are now eligible to become herders of small ruminants and calves. This grade could also include infants born to men in Grade VII;
3) Grade III (Senior Gamme) which includes 16-year-old initiates from grade 11 who are old enough to herd cattle on forra and participate in hunting and raiding. It also includes infants born to men in Grade VIII;
4) Grades IV and V members (Cusa and Junior and Senior Raba) includes 24-year-old initiates from grade III who can become mature warriors or raiders. Junior Raba after age 32 can marry. These two grades each span 24 years in total with a maximum age of 45; it is not 48 because the Senior Raba period is preempted by a period of transfer of power to the next grade. These grades can also include infants born to men in Grades IX and X;
5) Grade VI members (Gada) are the ones who can be elected to positions of Gada councillors. The initial age range upon entry into Grade VI is from birth to 45 years and thus includes infants born to men in the final Grade XI (see below). The political roles thus must vary markedly from junior to senior members, but all (including young children) can enjoy a similar status in ritual (Asmarom Legesse, 1973). The senior elected members of the Gada council act as upholders of the "Peace of the Boran" philosophy by serving as "supreme court' members for conflict mitigation and as leaders for ritual prayer and sacrifice (Asmarom Legesse, 1973; Helland, 1980b; Hogg, 1990a);
6) Grades VII through X cover 27 years and are referred to as Yuba as a whole. The Yuba contain males having an entry age of anywhere from 8 to 53 years and an exit age of 35 to 80 years. There are no infants in this grade because there is no grade above 11 (see no. 5 above). The roles include politics and ritual and at least partial retirement for older members. Men in Grade VII also have important ritual and political duties during the Gumi Gayu assembly; and
7) the terminal and sacred grade is Gada Mojji, with an entry age of 35 to 80 years. This grade is followed by full retirement, but it is unclear if this is mandatory for all members regardless of age.
This description of the Gada grades is slightly at variance with some details of the model of Asmarom Legesse (1973: p 131). It portrays, however, a basic and informative picture. The apparent high virility of the very old men in Grades IX, X, XI (i.e. at 72 years of age at least) is attributable to two factors: (1) they marry very young fertile wives (starting at age 13); and (2) their wives can carry on with an active cicisbeism, or extramarital relations with lovers from their husband's lube. The children born from these liaisons are recognised as children of the husband.
Asmarom Legesse conducted a computer simulation analysis on the demographic stability of the Gada system given that members of different grades have different and absolute rules regarding child rearing. These fundamental rules have traditionally included: (1) no man is allowed to have children before a minimum age of 40 (note that this would be in Grade V and there is no entry slot for newborn sons five grades lower); and (2) no man is allowed to marry before a minimum age of 32. Details that underscore these major rules include: (1) since the children of cicisbeism are regarded as children of husbands, this effectively stops recruitment from wives as well; (2) junior males in Gada grade VI also are not allowed to father children; (3) senior males in the Gada grade VI are allowed to procreate only sons; and (4) men are only supposed to raise sons starting at age 40 after their fatherhood ceremony, can raise daughters only after they are 48. Asmarom Legesse (1973: p 68) also stated that the traditional premarital sex rules for men support the structure of the Gada system. Marriage for men can also be delayed by economics in terms of the need to attain a modest bridewealth (D. L. Coppock, ILCA, personal observation).
For these rules to be enforced it is apparent, given that young men are not celibate (Asmarom Legesse, 1973), that something must happen to: (1) all children born before a husband turns 40; (2) those children born to junior men in the Gada grades; (3) those daughters born to senior men in the Gada grades; and (4) those daughters born to men between the ages of 40 to 48. Asmarom Legesse concluded from demographic analysis that various forms of infanticide and putting infants up for adoption outside the system were occurring during his field work in the early 1960s. This occurred despite an official ban on infanticide from the Ethiopian Government (Asmarom Legesse, 1973).
Asmarom Legesse also concluded from his simulation analysis that the Gada system has had considerable effects on Borana population growth for hundreds of years. He hypothesised that the transformation of the Gada, from a simple age set system to its present forms, was related to the period of rapid population growth in the 16th century. Calculating back from the computer simulation and his demographic survey of 1963, he stipulated the year 1623 as a likely time when rules limiting reproduction that are in effect at the present came into being. Starting with a normal age-graded population structure in 1623, and then imposing Gada rules on reproduction, he simulated a 40% decline in population until the year 1703. The decline continued until 1863 when the population stabilised at about 50% of the original density. After a period of steady-state performance, the population then exhibited a modest degree of growth. This huge effect of the Gada on population dynamics was in part due to the postulated large portion (30%) that the affected male cohort, aged 16 to 40, comprised of the original population.
Population regulation, cultivation in the highlands and massive territorial expansion throughout Kenya and Ethiopia (see Section 2.4.2.1: History) were all strategies to accomodate high population density in Oromo society during the 1600s. In the 1960s, however, Asmarom Legesse noted that only 18% of the male population was aged 16 to 40 so that Gada practices would be anticipated to have a smaller effect on population regulation. There was also no indication that the position of the population on the Gada cycle had stabilised since the late 1800s, and it was unclear if it would ever stabilise in the future. Asmarom Legesse also noted that the numbers of retirees in the advanced Gada grades were increasing while numbers in the lower grades were dwindling. The Boran however, perceived this to be due to declines in fertility and not to instability in the Gada cycle.
Other factors may thus come into play regarding population regulation in the southern rangelands, and these prominently include effects of an improved delivery of health care, food aid and a decline of traditional leadership and values plus routine regulation of conception, topics addressed in the next section.
The Gumi Gayo (Assembly of the Multitudes) is a pan-Borana meeting that takes place for a week once every eight years in the southern rangelands. It last occurred in 1988. This is regarded as the most inclusive event in Borana life (Asmarom Legesse, 1973). The Gumi, which holds the ultimate authority regarding all matters, is an assemblage of representatives of all Boran. But it is actually the multitude that sits in judgement, often led by an Abba Gada. A transcript of a meeting in 1966, attended by 600 persons, is reported in Asmarom Legesse (1973: pp 94-99). The agenda dealt with resource conflicts, divination for the future, patching-up schisms among submoieties intertribal issues involving the Rendille and debate on 12 cardinal rules that had been violated as a result of a decline in customs and carelessness. These codes involved routine administration, social behaviour, the care of horses, sale of water, feminine modesty and rules of bridewealth. In the debates there was a deliberate attempt at rethinking and modifying customary laws where appropriate (Asmarom Legesse, 1973: p 97).
The outcome of the meeting in 1988 included proclamations on a wide range of topics (D. L. Coppock, ILCA, unpublished data). These included that: (1) encouragement be given to keep water points in good condition; (2) owners of ponds and wells must not accept money from users; (3) everyone establish kalo or fodder reserves for calves and sick cattle in the dry season; (4) everyone make an effort to determine where forra cattle can freely graze; (5) everyone try to stop unnecessary cultivation of land; (6) trees with value for forage and shade must not be disturbed; and (7) government tax on salt from salt craters (Soda, Dilo Goraye, etc) be reduced to former levels.
There was also a debate on alcohol abuse in the community. All points above except (7) have a fundamental bearing on the implementation of technical improvements in the system as well as managing it well enough for sustainable output, topics dealt with in detail in Chapter 7: Development-intervention concepts.
Helland (1980b) reviewed the Gada system and rules on reproduction as proposed by Asmarom Legesse (1973) and Haberland (1963), and noted the importance of population regulation for the Boran as an ecological adaptation because of their reliance on a finite resource base. Citing AGROTEC/CRG/SEDES Associates (1974e) for estimates of population growth, he found the net rate of natural increase in the Borana population in 1972-73 to be on the order of 1.5 to 1.8% per annum. An annual outmigration and urbanization rate of 5% was also stipulated, which would lead to a net growth rate of 1 to 1.3% per year. This means that the population would double every 55 years, a very low growth rate for semi-settled pastoralists such as the Boran (Meir, 1987).
Helland (1980b), however, expressed concern about the degree of control that the Gada system retained given increasing outside influences on the society. The demise of traditional regulation of population growth among Somali pastoralists due to external was noted by Swift (1977). Sindiga (1987) noted that improved human services facilitated population growth among the Maasai. Surveys of Borana society conducted in 1990 (Coppock, 1992b) confirm that wide generation gaps are perceived by the elders, and that mushrooming small towns on the plateau are probably having a pervasive effect on social attitudes and economic trends. The generation gaps involve variation in traditional values and changes in economic attitudes towards livestock commercialisation. Respondents from the older generation in the survey felt, for example, that male youths were being increasingly attracted to opportunities outside the traditional sector, such as participating in the cattle black market to Kenya and routine selling of more cattle than the elders felt was prudent. The elders were also very concerned about the looming critical labour shortage that would occur as a result of young men leaving the system (Coppock, 1992b). It must be said, however, that the younger generation probably has fewer options to diversify their economic activities given current population pressure and lower per capita numbers of cattle (see Section 7.2: A theory of local system dynamics). Herding cattle appears to be a less-attractive option for young men contemplating their future today compared to the past, as it is probably more difficult to become wealthy from herding cattle today. Besides, they are now aware from contacts with outsiders that there may be more attractive options elsewhere (see Section 7.1.3: Review of dynamics and past interventions).
Regarding the importance of Gada, Helland (1980b) added that it was not clear how many Boran really follow the Gada rules today or how the rules are articulated in general throughout the population. Demographic studies on the Borana Plateau carried out by B. Lindtjørn (University of Bergen, unpublished data) in the late 1980s estimated a net population growth rate of 2.5%, consistent with that for other semi-settled pastoral groups (Meir, 1987). This growth rate has a population-doubling time of 28 years. Menwyelet Atsedu (1990: p 31) presented data from AGROTEC/CRG/SEDES Associates (1974e) and SORDU in 1988 that suggest that the human population in the western half of the Borana Plateau doubled from 261000 to 520000 over 15 years. This means a population growth rate closer to 5% per annum, but it should be expected to include a large component of highland immigrants moving into small towns in the rangelands. It is unclear whether the exact same areas were sampled in the surveys by AGROTEC/CRG/CEDES Associates (1974e) and SORDU whose survey also may have included a larger area (Menwyelet Atsedu, 1990: p 31). From an aerial survey in 1982, Milligan (1983) estimated a human population of about 91000 to 135000 for the study area giving a mean density of 7.3 persons/km2.
It seems reasonable to hypothesise from the data of AGROTEC/CRG/SEDES Associates (1974e) and B. Lindtjørn (University of Bergen, unpublished data) that the net population growth rates among the Boran are increasing. Several factors could be contributing to this: (1) Gada rules and values are becoming less adhered to; (2) rural systems of social surveillance imposed by the Ethiopian Government during 1978 to 1991 were an effective check on illegal practices such as infanticide; (3) improvements in health delivery and access to cereals through food aid and markets enhance the health and fertility of women in their child-bearing years. Another factor that may become more important in the future is the reported recent and growing interest in Islam by the Boran (C. Fütterknecht, CARE-Ethiopia, personal communication). Given that Muslims have larger families, the spread of Islam has important implications for population growth (M. Bassi, Institute of Ethiopian Studies, personal communication). It may also pose some threat to the Gada system itself in the future.
In one sense there appear to be contradictions between some of the Gada tenets and other aspects of contemporary ritual. For example, M. Bassi (Institute of Ethiopian Studies, personal communication) noted that fertility is greatly emphasised in the ritual ideology and Borana women want many children, but in practice fertility may be curtailed - two sons being the desired norm. Besides the Gada rules (above), the Boran practice some form of contraception. This may be as simple as women breast-feeding their young children for several years, which may contribute to long-term anoestrus. Birth control also has an economic function in that each household tries to have children in proportion to their economic condition as reflected in herd size. Drought and other perturbations, however, make it more difficult for the Boran to plan family size in this manner given their often unpredictable losses of cattle (M. Bassi, Institute of Ethiopian Studies, personal communication).
Although human morbidity was widespread during the 1983 to 1984 drought (see Section 6.3.1.4: Human diet and mortality), the human population appeared to be little affected in terms of drought-related mortality. Cossins and Upton (1988a) reported negligible deaths from the survey of five olla at Did Hara, Medecho and Melbana. In a survey of 48 Borana and Gabra households near the Beke Pond in 1987 (D. L. Coppock, ILCA, unpublished data), no deaths were reported due to the drought. More than 35 families, however, reported one birth each during the drought (see Section 6.3.2.2: Human welfare). Although regional variation relating famine and human mortality is to be expected, there was no evidence from these limited surveys that human mortality rates were affected by this drought in a density-dependent manner (i.e. higher drought-induced mortality because of a larger pre-drought population). This was in marked contrast to cattle, as 45% of milk cows, 57% of calves and 22% of mature males died (Donaldson, 1986; see Section 6.3.1.1: Livestock dispersal and herd composition).
This thus introduces a concept that is probably fundamental to understanding the hypothesis that the Borana production system is becoming increasingly vulnerable to drought and poverty (introduced in full in Section 7.2: A theory of local system dynamics). This hypothesis proposes that cattle mortality can be affected in a density-dependent manner as a result of environmental perturbation while human mortality, at least during recent times, has not been appreciably affected. For a comprehensive view of integrated research and development perspectives, the reader should consult Chapter 8: Synthesis and conclusions.
![]()
![]()
![]()
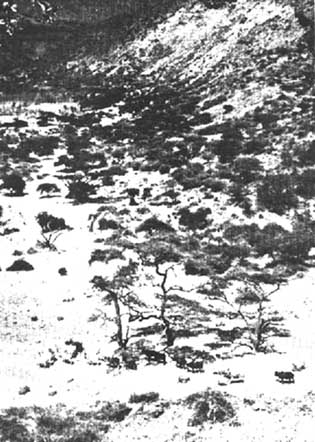
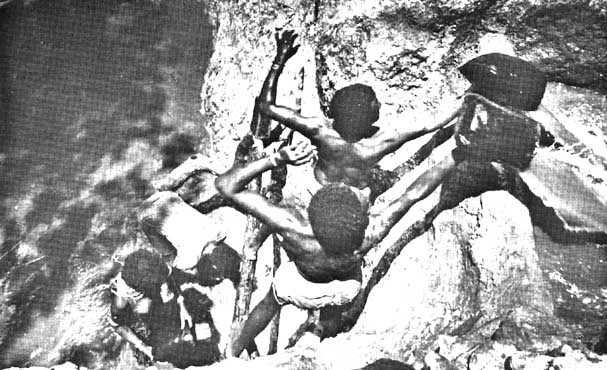
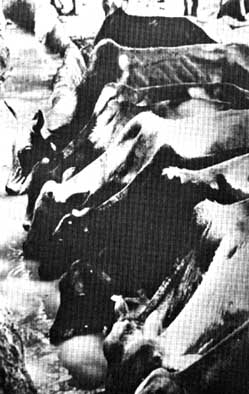