![]()
![]()
![]()
3.3.1 Ecological map and land use
3.3.2 Long-term vegetation change
3.3.3 Short-term vegetation change
3.3.4 population ecology of woody species
3.3.5 Use of native vegetation
An ecological map (scale of 1:500000) is presented as a fold-out at the back of this volume (see Figure B1, Annex B). It illustrates the ecological diversity of a 26600-km2 area in the western region of the Borana Plateau. This is roughly 70% larger than the area for which aerial surveys were conducted for population and land-use studies (see Section 4.2.6: Grain cultivation).
Overall, the 26600-km2 area is comprised of the following six agro-ecological zones: (1) subhumid (6.5% of the mapped area); (2) upper semi-arid (22.4% of the mapped area); (3) lower semi-arid on basement-complex veil (19.9%); (4) lower semi-arid on other mixed soils, including volcanics (20.4%); (5) arid (19.2%); and (6) bottomlands, dominated by Vertisols (11.6%). It is important to note that both climate and soils are integrated in this classification scheme, with soil type contributing the degree of moisture stress (Assefa Eshete et al, 1986).
The six zones were broadly differentiated on the basis of elevation and rainfall while other aspects of classification were based on vegetation structure as influenced by soil depth and fertility (Assefa Eshete et al, 1986). For example:
(1) subhumid environments (annual rainfall averaging approximately 900 mm) are either currently or formerly densely wooded with juniper (Juniperus procera) or mixed associations of trees such as Olea, Euclea, Dodonea, Tarconanthus and Terminalia spp;(2) upper semi-arid environments (annual rainfall averaging around 650 mm) offer the best grazing resources, and are primarily indicated by broad-leaved trees (e.g. Combretum, Euphorbia, Terminalia spp) with Acacias also common;
(3) some lower semi-arid environments (with annual rainfall between 450 and 650 mm) occur on basement-complex substrates with enhanced soil-plant-water relations. These are represented by Acacia-Commiphora spp associations as well as by patches of open grasslands;
(4) other lower semi-arid environments (also with annual rainfall between 450 and 650 mm) on mixed (granitic, metamorphic and volcanic) soils offer high spatial variability in terms of plant associations. Wooded Acacia savannah, open grasslands and bushed grasslands are a few of these associations;
(5) arid environments (with an annual rainfall <450 mm), which are defined by either reduced precipitation at lower elevations to the west, or shallow volcanic soils with a low water-holding capacity that occur throughout the study area. Acacias such as A. mellifera, A. reficiens and A. horrida commonly dominate vegetation in arid sites. Sparse grassland on lava is also typical; and
(6) bottomlands, dominated by Vertisols at high and low elevations. Acacia drepanolobium, Pennisetum spp and A. seyal are found where seasonal water-logging occurs. This zone also includes limestone valleys and units of riverine vegetation which are very restricted in occurrence. Landscape features which foster water collection at these sites render the role of annual rainfall less relevant to plant production than in other zones.
Considering the importance of traditional socio-territorial units of the Boran (or madda; see Section 2.4.1.7: Water resources) for development planning (Hogg, 1990c), a breakdown of agro-ecological zones for 29 madda is depicted in Table B1, Annex B. A madda map is provided in Figure 2.10. The key finding regarding the distribution of agro- ecological zones is the variation in zonal diversity among madda. bottomlands, regarded as critical for sustainable cultivation and dry-season forage (see Section 2.4.1.3: Soils), did not occur in nine of the 29 madda but comprised over 10% of the area of seven others (Table B1, Annex B). The high elevation subhumid zone, probably the most stable and predictable in terms of annual forage production (see Section 2.4.1.4: Climate, primary production and carrying capacity), did not occur in 12 madda, but comprised over 20% of six others. The arid zone, probably the least stable and predictable in terms of annual forage production, was absent in eight madda but comprised over 25% of nine others. Madda thus vary substantially in terms of zonal diversity. Three madda possessed all six zones; 16 possessed four to five and. 10 possessed two to three. The most diverse madda were Gobso, Harwe-U/Deritu and Orbate Gedi and the least were Dubluk and Kadim.
Variation in types and diversity of ecological zones within madda strongly influences development potential, and thus mitigates against having only one resource-intervention strategy (see Chapter 7: Development-intervention concepts). Different properties of zones, ecological units and subunits in terms of suitability for grazing, cultivation and other aspects of sustainable use are reviewed in detail in Annex C and Assefa Eshete et al (1986). In general, these investigators concluded that the subhumid zone has been fairly stable in terms of the conservation of the juniper forest and mixed woodlands since 1970. This is largely a tribute to enforcement of local forestry regulations, since most major towns occur in these areas and demand for wood for fuel and construction is high. The upper semi-arid zone is regarded as the most vulnerable to bush encroachment as a result of heavy grazing. The lower semi-arid zones may require the most flexible herd management strategies for warra/forra herds of cattle (see Section 5.3.1: General aspects of cattle management) because of the higher annual variability in rainfall and forage production (Assefa Eshete et al, 1986; see Annex C).
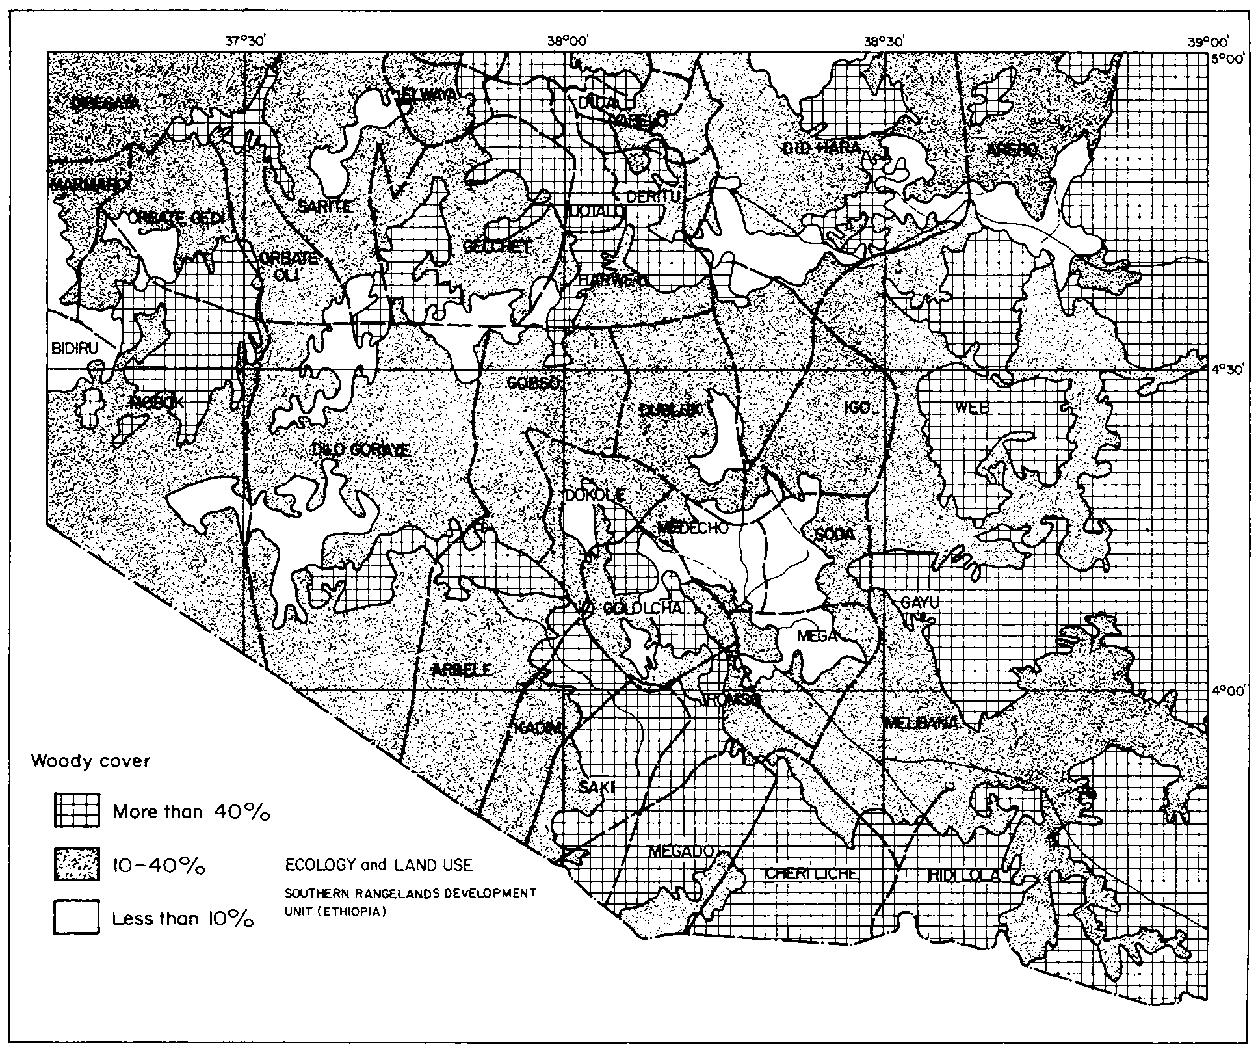
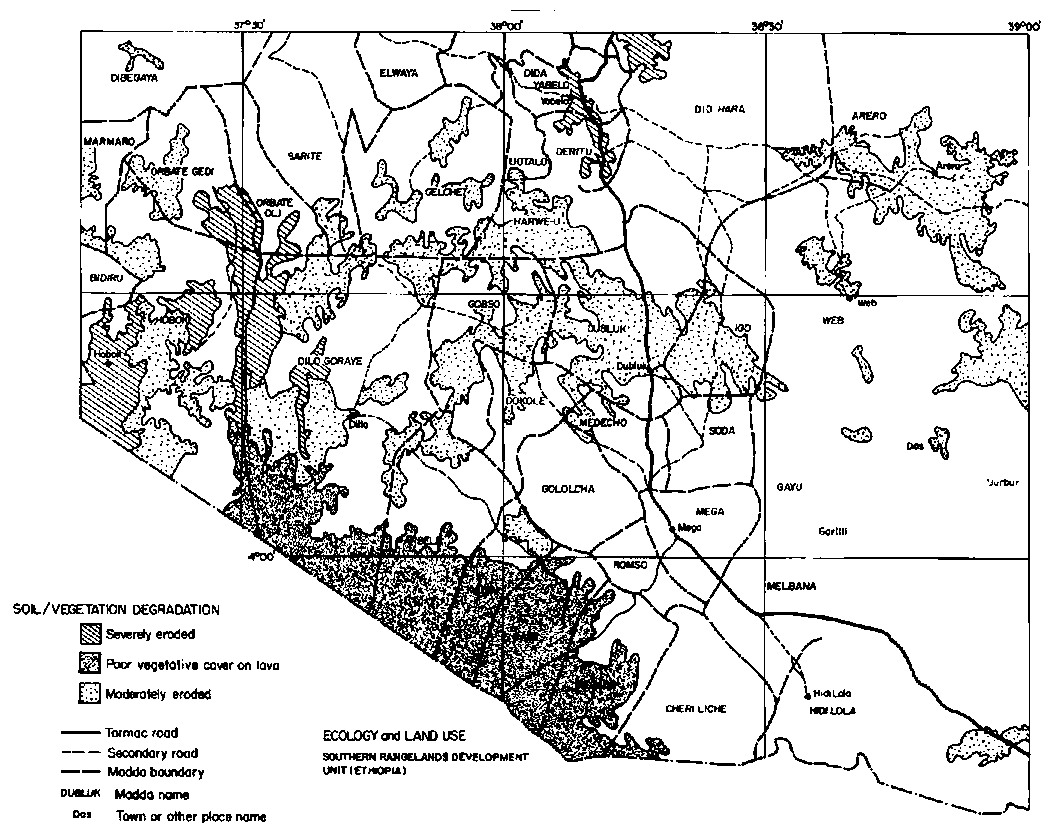
Results from satellite imagery and ground surveys revealed a large extent of dense woody cover and a significant degree of soil erosion. Roughly two-fifths of the region had a woody cover exceeding 40% in the mid-1980s, largely in the east, south and north-central sections (Figure 3.2). Madda such as Web, Gayu, Hidi Lola, Cheri Liche, Megado, Gololcha, Orbate Gedi, Gelchet, Uotalo, Deritu, Did Yabelo and Did Hara appeared to have the greatest extent of dense woody cover. Severe erosion was observed in the north-central and western portions of the study area (Figure 3.3), amounting to 4% in the mid-1980s. Moderate erosion was observed throughout an east-to-west belt and comprised 15% of the area overall. In total nearly one-third of the study area was assessed as degraded and in need of grazing control (Assefa Eshete et al, 1986). This is important given that degradation was defined by these investigators as instances where perennial plant cover had been "substantially" reduced and erosion occurred as sheets or gullies. These impacts were supposed to have occurred over many generations and largely due to heavy grazing during rainy seasons, with effects magnified on shallow soils (Assefa Eshete et al, 1986: pp 23-24).
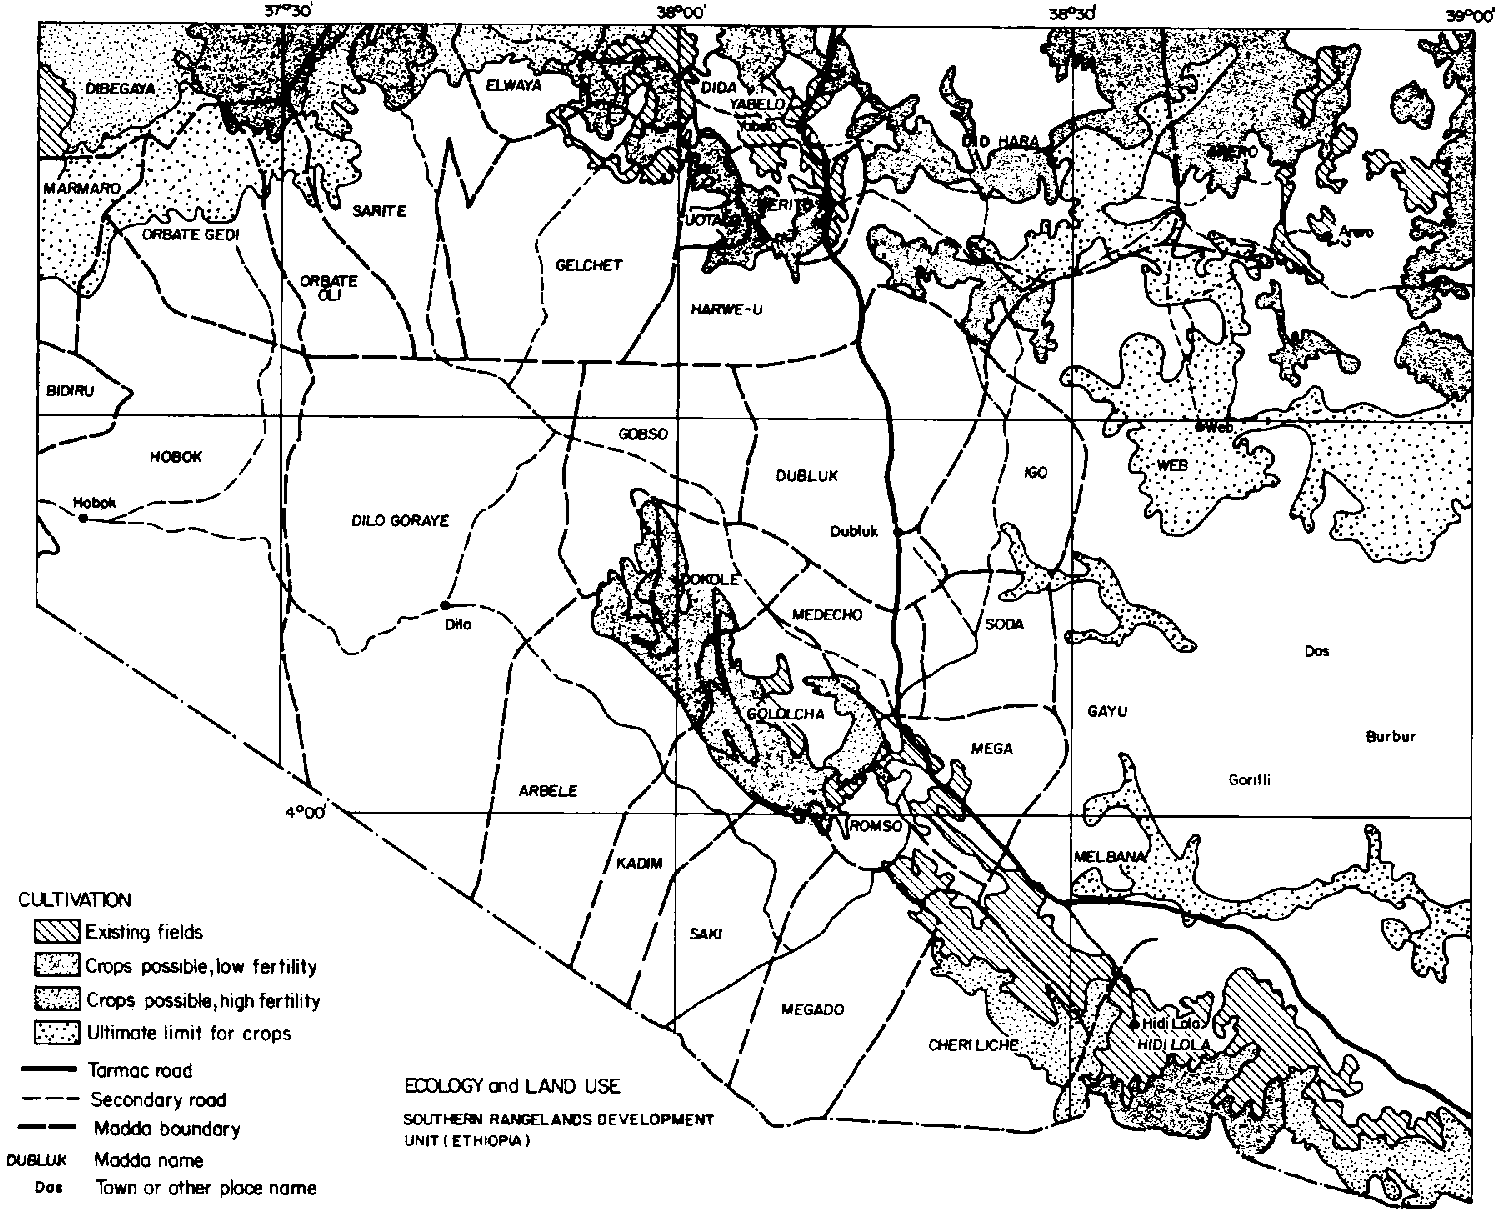
Assefa Eshete et al (1987) reported widespread instances of small cultivated plots in the study area after the 1983 to 1984 drought (see Section 4.3.6: Cultivation). In terms of extent, cultivation was most significant at higher elevations near towns such as Yabelo, Mega, Arero, Hidi Lola and in rural areas to the north-central north-west and north-east, and at higher elevations near the Kenya escarpment (Figure 3.4). Roughly 4% of the study area was covered by cultivated fields in the mid-1980s. The ultimate area possible for cultivation, however, may be on the order of 30% overall (Assefa Eshete et al, 1986,1987). Much of this would occur on slopes at higher elevations and may not be sustainable except under careful management. Note that lower-elevation sites in the semi-arid interior that offer opportunity for expansion of cultivation are often coincident with Vertisol bottomlands, depicted in Figure B1, Annex B. Cultivable sites not located within reasonable reach of wells may also not be utilised. According to the criteria used by Assefa Eshete et al (1986) about half of the madda appear unsuitable for cultivation. This suggests that development of sustainable agropastoralism would be highly dependent on site and region-specific features (see Section 7.3.2: Land-use policy and agronomic interventions).
3.3.2.1 Central semi-arid regions
3.3.2.2 Contrasts of lower and upper semi-arid regions
Highlights of results are presented here. Details may be found elsewhere Billé and Assefa Eshete, 1983b; Billé et al, 1983, Billé and Assefa Eshete, 1984).
Based on an average of 43 sample points/block, canopy cover of herbaceous plants was similar among blocks and ranged from an average of 20% for Web, Goff and Dass to 29% for Melbana. Blocks were more variable, however, in terms of woody cover. Goff had a woody canopy cover of 70% while the other three blocks were similar and averaged 45%. This difference in woody cover represented variation in density and size of woody plants. Size-class distributions for woody populations are shown in Figure 3.5 (a-d). These data were interpreted to show a relatively mature and stable woody population in Melbana, a more heterogeneous population in Dass and younger populations in Web and Goff. Inspection of areas under the curves in Figure 3.5 (a-d) indicates that the Web population had only 22% of individuals with bole circumferences of over 20 cm (i.e. over 70 years old) while Goff had 24%, Dass 50%, and Melbana 78%. At both Web and Goff woody plants were considered to be reaching maximum densities (i.e. 800/ha). Billé et al (1983: p 24) noted that despite the general similarity of population curves for Web and Goff, there were important differences in the number of very old trees (i.e. those having a bole circumference of over 30 cm). Less than 10% of the trees were in this category at Web, but this increased to about 30% (or 260/ha) in Goff.
Figure 3.5 Distribution of various size classes of woody plants in four locations on the central Borana Plateau during the early 1980s. - Source: Billé et al (1983). - Dass
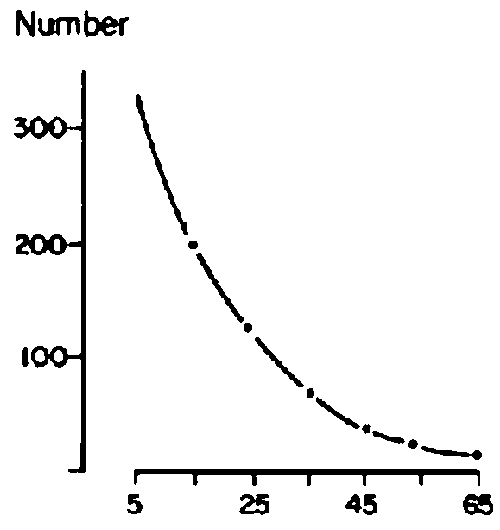
Figure 3.5 Distribution of various size classes of woody plants in four locations on the central Borana Plateau during the early 1980s. - Source: Billé et al (1983). - Melbana
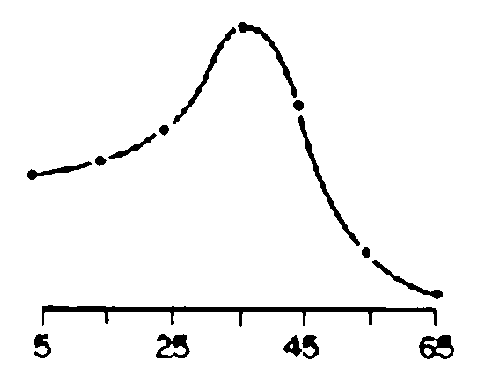
Figure 3.5 Distribution of various size classes of woody plants in four locations on the central Borana Plateau during the early 1980s. - Source: Billé et al (1983). - Webb
Figure 3.5 Distribution of various size classes of woody plants in four locations on the central Borana Plateau during the early 1980s. - Source: Billé et al (1983). - Goff
Frequency distributions for optimum and observed intensities of grazing pressure and erosion for the four blocks are shown in Figure 3.6 (a-c), and optimum distributions in Figure 3.6b should be compared against those observed in Figure 3.6 (a,c) to visualise trends. Current grazing pressure was skewed towards higher levels for Web and lower levels for Melbana (Figure 3.6a). Erosion appeared more intense for Goff and less so for Melbana (Figure 3.6c). Billé et al (1983) speculated that the data made sense if the four blocks were regarded as different stages in a historical cycle of heavy grazing, woody encroachment, reduced grazing pressure, gradual regeneration of the herbaceous layer and subsequent decline in recruitment of woody plants. Thus:
1) Dass was hypothesised to represent an initial stage of impact in which a high intensity of grazing had been occurring for a relatively short period of time. Some grazing-induced erosion had occurred but the scattered woody population had not yet been affected in terms of age structure or density;2) Web represented the next stage of impact in which the incidence of erosion increased and widespread establishment of young woody plants had occurred;
3) Melbana represented the third stage. Woody plants had increased here many years ago and the pastoralists subsequently abandoned the region (perhaps due in part to heavy utilization of grasses). The herbaceous layer then recovered in many places, establishment of more woody plants was curtailed and the woody population stabilised and matured. The recovery of the grass layer probably started in the 1960s and was still in progress in the early 1980s; and
4) Goff was hypothesised to be a variant of the third stage. It had apparently been heavily grazed for many decades and a high degree of erosion was noted to have markedly changed the landscape. The mixture of very young and very old trees suggested that successive waves of cattle grazing had not permitted recovery of the grass layer as observed in Melbana.
Based on an average of 39 sample points/block, blocks at Medecho and Did Hara were similar in terms of herbaceous canopy cover (28 to 32%), but less so in terms of woody plant density (460/ha at Medecho versus 640/ha at Did Hara). However, the most interesting differences were in terms of the age structure of woody populations (Figure 3.7). Did Hara had a younger Commiphora-dominated community with 64% of the population having a bole circumference of <10 cm while the same-size class at Medecho comprised only 25% of the aggregate population. Conversely, Medecho had a higher percentage (26%) of very old trees (bole circumferences of over 30 cm) compared to Did Hara (2%). Both blocks were being heavily utilised by cattle at the time of the study, with grazing pressure rated from high to very high for an average of 65% of the sample points in both blocks Billé and Assefa Eshete, 1983b: p 25).
The impacts of recent pond development (especially Beke Pond) on vegetation in Gololcha in the upper semi-arid zone were reported by Billé and Assefa Eshete (1984: pp 22-27). Based on 47 sample points, average density of woody plants in this block was estimated to be 1170/ha. The age structure of these populations was not assessed because of the density and complexity of the vegetation Billé and Assefa Eshete, 1984: p 23). Gololcha was thus regarded to be threatened by severe encroachment from species such as Acacia brevispica and Commiphora spp Billé and Assefa Eshete, 1984: p 23). Erosion and grazing intensity appeared to be interrelated and both were ranked from high to very high at over half of the sample points, the most for any block. Marked erosion occurred when grass cover was less than 20% Billé and Assefa Eshete, 1984: p 26). Compared to other blocks, the pronounced impact in Gololcha was probably due to a combination of a higher density of livestock throughout the year (see Section 3.2.2: Long-term vegetation change), higher rainfall that favoured faster establishment of woody vegetation and a greater degree of hilliness that predisposes the area to cattle-induced erosion Billé and Assefa Eshete, 1984; D. L. Coppock, ILCA, personal observation).
Figure 3.6 Frequency distributions for grazing pressure. - Source: Billé et al (1983).
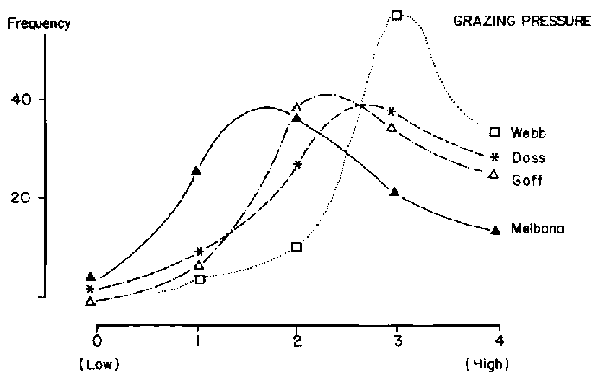
Figure 3.6 Optimum situations are shown. - Source: Billé et al (1983).
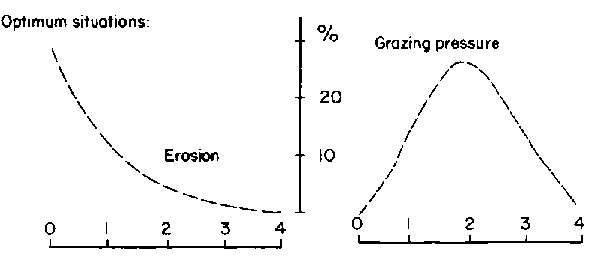
Figure 3.6 Frequency distributions for erosion intensity for four locations on the central Borana Plateau during the early 1980s. - Source: Billé et al (1983).
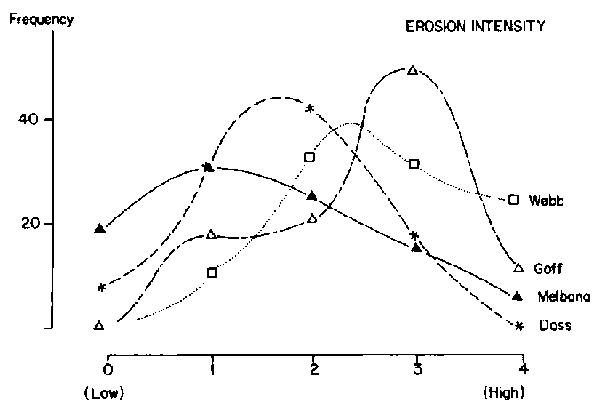
Figure 3.7. Contrast of age structures for woody populations in two locations on the central Borana Plateau. Medecho was a site with a long history of pastoral occupation, while Did Hara had been occupied for about seven years. - Source: Billé and Assefa Eshete (1983b).
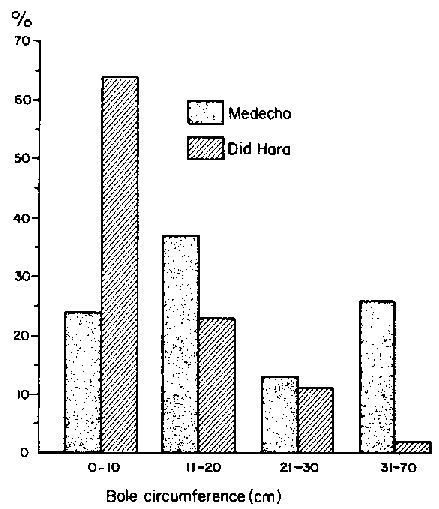
Billé and Assefa Eshete suggested (1984) that environmental impacts of livestock at Medecho, Did Hara and Gololcha illustrated the same principles as those inferred from conditions at Dass, Web, Melbana and Goff. Recent and heavy grazing pressure in Did Hara, which had previously been relatively undisturbed by livestock because of poor access to water, elicited a new wave of woody encroachment. Heavy grazing at Medecho in the past was evident in the mature age structure of the woody populations. Gololcha, under the highest rainfall regime, exhibited a particularly strong tendency for woody encroachment from grazing perturbation.
In sum, traditional pastoral exploitation patterns under lower population densities of humans and livestock were hypothesised to consist of the following stages Billé and Assefa Eshete, 1983b: pp 32-34; Billé and Corra, 1986):
(1) pastoral settlements would be maintained around a given well group until the area was overgrazed to the extent that cattle productivity was compromised. Besides heavy grazing, negative effects on the herbaceous layer could also accrue from a possible reduction in availability of top-soil nutrients (due to nutrient redistribution from forage in grazing areas to corrals at settlements via livestock faeces) and from encroachment of woody vegetation which could limit herbaceous growth through competitive effects for light, moisture and nutrients;(2) these sites are eventually abandoned, and the grass layer then begins to recover in the absence of grazing. Recruitment in the woody population consequently slows down due to increased competition from grasses, and woody populations mature. To some degree grass recovery could be facilitated by the physical obstruction of woody plants which limit livestock access, and annual leaf litter from deciduous woody plants that could help replenish top-soil nutrients. Nitrogen fixation by woody legumes may also provide important inputs. As the herbaceous layer recovers further, fuel loads would build up and set the stage for fires to thin the woody populations. A fertile open savannah is thus re-established; and
(3) pastoralists then recolonise the site in a cycle that could take from 60 to 100 years for completion.
3.3.3.1 Effects of excluding livestock
3.3.3.2 Interactions among woody and herbaceous plants
In terms of soil properties, seven years of protection from continuous grazing only had minor effects (P<0.05) on exchangeable cations (Table 3.1). There was also no significant trend (P>0.05) among protected kalo and unprotected sites in terms of: (1) per cent basal cover of herbaceous vegetation or small shrubs (Table B2, Annex B); (2) density of medium- to large-sized woody plants (an average of 1350/ha within kalo versus 1180/ha off kalo; (3) crown cover of medium- to large-sized woody plants (an average of 16% within kalo versus 13% off kalo; and (4) plant species diversity.
Table 3.1. Chemical and physical features of top soils on and off protected calf pastures (kalo) in the southern rangelands.1
|
Site |
Chemical and physical features2 |
||||||||||
|
Texture (%) |
pH |
OM (%) |
N (%) |
P (ppm) |
Exchangeable cations (meq/100g) |
||||||
|
Sand |
Silt |
Clay |
Na |
K |
Ca |
Mg |
|||||
|
Protected pasture (kalo) |
67 |
16 |
17 |
6.9 |
1.9 |
0.09 |
33.7 |
0.1 |
1.6 |
17.4 |
4.3 |
|
Unprotected pasture |
65 |
16 |
19 |
7 |
1.9 |
0.1 |
28.8 |
0.02 |
1.5 |
19.9 |
4.8 |
|
Statistics3 |
NS |
NS |
* |
NS |
NS |
NS |
NS |
* |
NS |
* |
* |
1 Where protected sites had been kept from continuous grazing pressure for at least seven years.2 Where OM = organic matter, N = total nitrogen, P = phosphorus, Na = sodium, K = potassium, Ca = calcium and Mg = magnesium. Percentages are expressed on an oven-dried basis.
3 Based on paired t-tests for eight pairs of sites. NS denotes not significant with P>0.05. Asterisks denote significant variation for their respective columns at P<0.05.
Source: Menwyelet Atsedu (1990).
More resolution, however, is provided from production data for herbaceous functional groups (Table 3.2). Subtracting standing-crop values before the long rains from those after suggests that total dry-matter production in kalo over the wet season was 158 g/m2 (or 1.58 t/ha), while that for unprotected sites was 83% higher at 299 g/m2 (or 2.99 t/ha). The composition of production was also markedly different. Production on kalo consisted of 62% grasses, 12% legumes and 26% fortes while that for off-kalo sites was 38% grasses, 7% legumes and 55% fortes (Table 3.2).
In sum, these findings are interpreted to show that seven years of protection from continuous grazing on these particular sites did not confer notable changes in soil nutrient status or total herbaceous cover. In terms of herbaceous biomass, however, off-kalo sites appeared to be more productive overall than kalo sites, but this was due to a greater representation of fortes. Forbs probably have lower grazing value for cattle compared to grasses (see Section 3.3.5.1: Livestock food habits) and may be regarded as invaders. Similarity in grass production on and off kalo suggests that the perennial grasses are somewhat resilient in response to continuous grazing.
Considered across four size classes of two species of woody plants on three sites at the Sarite ranch, herbaceous production over an average 50-m2 area increased by 58% when woody plants were removed prior to the long rains of 1987 (Table 3.3). Influence of both woody species on the understorey gradually declined up to a distance of 4 m from the central trunk (Figure 3.8). The negative effect of Acacia seyal and A. horrida on herbaceous production in this locale is understandably large given that they comprised over 60% of a woody community that averaged 337 plants/ha (Solomon Kebede, 1989: p 70). Removal of woody plants also shifted the understorey composition to greater domination by perennial and annual grasses (Solomon Kebede, 1989: pp 182, 188). It was speculated that competition for moisture in the top soil was the critical factor in observed patterns principally because the influence of woody plants extended beyond their canopies, indicating negative effects on the understorey could not be interpreted just in terms of shading effects. Evidence of competition for water was provided by studies of roots. Excavations showed that a 3-m tall A. seyal had lateral roots at a soil depth of only 10 to 15 cm that extended outward over 13 m, but a tap root only 1.2 m in length. An A. horrida specimen of similar height had lateral roots up to 7.5 m in length. Even a 20-cm tall seedling of A. horrida had a tap root nearly 1 m long (Solomon Kebede, 1989: p 167). Acacia horrida may also compete with the understorey for rain water interception; the funnel-shaped crown captures rain water and channels it to the central point of stem emergence (Solomon Kebede, 1989: pp 165, 169).
Table 3.2. Estimated ANPP (g/m2, ±SD) during the long rainy season of 1988 for herbaceous vegetation on and off protected calf pastures (kalo) in the sot/them rangelands.1
|
Vegetation component |
On kalo |
Off kalo |
Statistics2 |
|
Grass |
98.1 ±36 |
110.4±40.2 |
NS |
|
Legume |
18.2 ± 5.7 |
30.5 ± 6.2 |
* |
|
Forbs |
41.9 ± 11.3 |
158.8 ± 91.3 |
* |
|
Total |
158.2 ± 37.9 |
299.7 ± 91.7 |
* |
1 Where protected sites had been kept from continuous grazing pressure for at least seven years. ANPP refers to above-ground net primary production on an oven-dried basis, determined by comparing biomass from exclosure sites between sampling dates before and after the rains of 1989 (i.e. over a period of about 60 days).2 Asterisks denote significant differences between means in a given row at P£ 0.05. NS denotes non-significance.
Source: Menwyelet Atsedu (1990).
Figure 3.8. Total herbaceous production during the 1987 long rains as a function of tree removal and distance from central boles (trunks) at Sarite ranch. - Source: Solomon Kebede (1989).
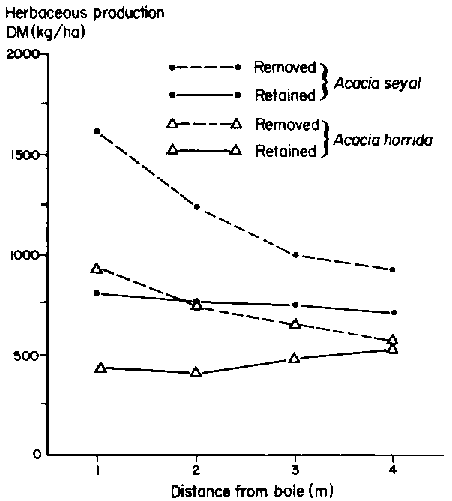
Table 3.3. Mean dry weight of herbaceous biomass (kg/ha) produced during the long rainy season of 1987 on 50-m2 plots where A. seyal or A. horrida had been removed or retained.1
|
Site |
Tree species |
|||
|
A. seyal |
A. horrida |
|||
|
Retained |
Removed |
Retained |
Removed |
|
|
1 |
1073 |
1557 |
425 |
550 |
|
2 |
586 |
1055 |
594 |
1033 |
|
3 |
540 |
870 |
340 |
504 |
|
Mean |
759 |
1194 |
460 |
731 |
1 Where data are based on 16 clipped quadrants (0.25 m2) per tree for 144 trees/spades. Means are calculated across four size classes/spades at each site.Source: Solomon Kebede (1989).
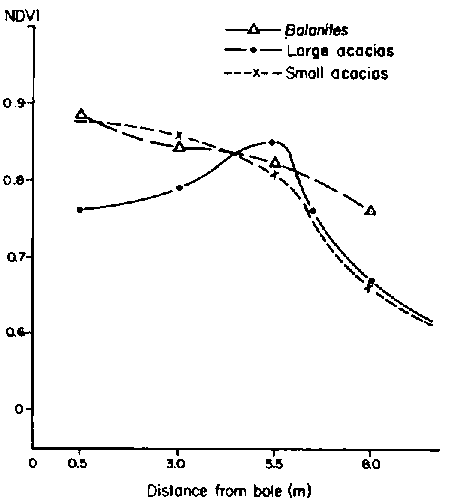
Billé and Corra (nd) reported different results of effects of trees on understorey cover at the Dembel Wachu ranch. Except for two large specimens of A. tortilis and A. bussed, NDVI tended to gradually increase in a linear fashion as distance from tree trunks decreased (Figure 3.9). Billé and Corra (nd) noted, however, that herbaceous species composition sometimes changed from grasses to less desirable fortes directly under tree canopies, so the increased NDVI could not be interpreted strictly with regards to grazing potential for cattle.
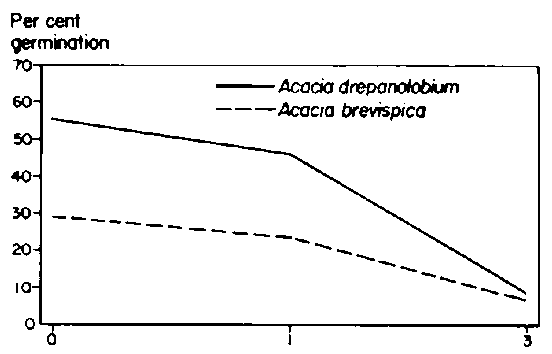
Although the laboratory experiment did not reveal an effect of temperature regime on germination rate (P>0.05), there were significant effects (P<0.05) due to species and an interaction among species and seed treatment (Table 3.4). Overall, seeds of Acacia drepanolobium germinated to a greater extent (83%) than those of A. brevispica (62%). Compared to other treatments, seeds of A. brevispica germinated to a higher extent after soaking in hot water. Seeds of A. drepanolobium germinated at similar rates regardless of treatment.
Figure 3.9. Normalised difference vegetation index (ND VI) reading as a function of tree species, tree size and distance from central boles (trunks) at Dembel Wachu ranch in 1986. NDVI values were highly correlated with standing herbaceous biomass. - Source: Billé and Corra (nd).
In the nursery trial, germination rates were lower overall than in the laboratory experiment with main effects coming from species, watering regime and planting depth (Table 3.5). The only significant species interaction was due to planting depth (Figure 3.10). Other interactions are described in Tamene Yigezu (1990: p 133).
Phenological studies indicated that both species produced fruits starting in October and November (i.e. during the later stages of the short rains) and seed fall occurred between January and April. Specimens at a minimum height of 1 m produced seeds but the largest standing crop of seeds was observed for those over 4 m in height (Tamene Yigezu, 1990: p 153). Standing crop of fruits was influenced (P<0.01) by the main effects of height class and site, with evident height class × site interaction (Tamene Yigezu, 1990: p 204). Standing crops of fruits and seeds per tree ranged from around 500 fruits (with 3100 seeds) for trees 1 to 2-m tall in December to over 30000 fruits (and 180000 seeds) for trees over 6 m tall in January. Although this seed yield is impressive, about 40% of a random sample of seeds had been damaged by insect larvae (Tamene Yigezu, 1990: pp 202, 206). After seed fall, nearly all seeds were located near the soil surface. Analysis of seed pools indicated that no seeds were below 5 cm in the profile (Tamene Yigezu, 1990: p 170).
Table 3.4. Germination percentage of A. drepanolobium and A. brevispica seeds over 21 days in the laboratory under different aced-scarification treatments.1
|
Species |
Seed-scarification treatments |
||
|
Control |
Hot water |
Sand paper |
|
|
A. brevispica |
62y |
73x |
52y |
|
A. drepanolobium |
85x |
83x |
82x |
1 See text for description of seed-scarification treatments. Entries in the same row accompanied by the same letter (x, y) were not significantly different (P>0.05).Source: Tamene Yigezu (1990).
Table 3.5. Main effects of four experimental factors on germination percentage of A. drepanolobium and A. brevispica seeds in a four-week trial conducted in a forestry nursery at Yabelo.
|
Factor |
|
Per cent germination |
|
|
Species |
A. drepanolobium |
|
A. brevispica |
|
37x |
|
20y |
|
|
Soil type |
Black Vertisol |
|
Red upland |
|
27x |
|
29x |
|
|
Watering frequency |
First week only |
|
Weekly |
|
22y |
|
36x |
|
|
Planting depth |
Surface |
1cm |
3cm |
|
42x |
37x |
8y |
1 See text for experimental details. Soils are described in Section 2.4.1.3: Soils Means in the same row accompanied by the same letter (x, y) were not significantly different (P>0.05).Source: Tamene Yigezu (1990: pp 126-133).
Figure 3.10. Per cent germination of seeds as a function of tree species and planting depth, as determined in a nursery trial in Yabelo during 1988. - Source: Tamene Yigezu (1990).
Recruitment rates of young plants was low as more mortality occurred before and during the seedling stage. Seasonal dynamics of seedlings in established stands indicated that densities ranged from a maximum of 2 to 4 plants/m2 within two months after the long rains, but this dropped to <1 plant/m2 in the following long dry season (Tamene Yigezu, 1990: p 180).
Once established, seedlings grew rapidly. A mature A. drepanolobium that was 4 m in height had a tap root 5 to 6 m in length. An A. brevispica of similar size also had a 6-m tap root, but in addition had an extensive system of lateral roots (Tamene Yigezu, 1990: pp 17-19). These differences in root morphology may partially explain why the grass understory appears much more reduced in the vicinity of A. brevispica compared to that of A. drepanolobium; lateral roots may confer greater competition for grasses (D. L. Coppock, ILCA, personal observation).
Acacia drepanolobium presents one of the most visually striking examples of encroachment by woody plants in the southern rangelands (D. L. Coppock, ILCA, personal observation). Maps of populations between Yabelo, Mega and Negele derived from aerial survey in 1988 are provided in Figure B2 a,b, Annex B.
In sum, these studies indicated that seeds were produced in the long dry season, but seed quantity was variable depending on several factors. The seed pool was on or near the soil surface and the majority of these seeds were capable of rapid germination depending on rainfall. A significant percentage of A. brevispica seeds, however, may be dormant and depend on other stimuli such as fire for germination. Larger individuals of both dormant and rapid germinating species may produce large quantities of seeds, but annual population recruitment is low due to a variety of factors, the most important of which may be parasitism and predation by insects at the seed-formation stage.
3.3.5.1 Livestock food habits
3.3.5.2 Household use of plants and pastoral perceptions of range trend
In the analysis of livestock feeding habits in the Beke pond region, browsing comprised an average of 2, 36,84 and 100% of the feeding time of cattle, sheep, goats and camels, respectively, when averaged over four seasons (Woodward, 1988: p 40). Camels and goats browsed to a similar degree regardless of season, but sheep appeared to browse more during dry periods. Averaged over four seasons, consumption of A. brevispica comprised 39,29 and 16% of the feeding time of camels, goats and sheep, respectively, and thus was the most important browse (Tables B3, B4 and B5, Annex B). Other commonly used species included Rhus natalensis, A. tortilis, Grewia tembensis, Cadaba farinosa, Dichrostchyus cinera and Ormocarpum mimosoides. Some of these species (i.e. A. brevispica, D. cinerea, E. shimperi and R. natalensis) also elicited high rates of dry-matter intake, usually because their forage was accessible and less protected by physical or chemical defenses (Woodward, 1988). Of 16 dominant species in the study area, 11 were ranked as increasing in the environment and two were ranked as stable. Eight produced preferred forage based on relative occurrence in livestock diets and the environment (Table B6, Annex B).
Chemical composition of 23 important browse forages is shown in Woodward (1988); these data illustrate wide variation in chemical content across species and across seasons within species. Forages were usually higher in nitrogen content and digestibility during wet seasons. During seasonal feeding observations (see Woodward and Coppock, 1989) livestock encountered forages widely ranging in concentrations of polyphenolics (9.6 to 57% of DM), proanthocyanidins (A550 absorbance readings from 0.01 to 2.78), total nitrogen (1.4 to 5.9% of DM) and available nitrogen (0.8 to 4.0% of DM). In general, browse with lower nutritive values seem more abundant (Woodward, 1988). Rank correlations of animal dietary preference and chemical attributes of browse indicated that livestock mostly responded to phenolic compounds and nitrogen (Table 3.6). During the long rains, when forage was abundant and animals could afford to be selective, they appeared to avoid those materials having higher concentrations of polyphenols and proanthocyanidins. Also at this time, sheep selected for forages higher in total and available nitrogen. In contrast, during the long dry season when forage was scarce, camels were apparently not selective for or against any particular compound, but small ruminants selected forages that had higher available nitrogen and lower levels of proanthocyanidins (Table 3.6). Livestock were not observed to select forages on the basis of fibre content or digestibility (Woodward and Coppock, 1989: p 7).
Table 3.6. Ranked correlation among animal preference indices and chemical content of forages during two seasons in the Beke Pond Region of the southern rangelands in 1986.1
|
Season2 and chemical characteristic3 |
Species |
|||
|
Goats |
Sheep |
Camels |
||
|
Long rains |
|
|
|
|
|
Polyphenols |
|
|
|
|
|
|
Total soluble |
-0.429 |
-0.421 |
-0.421 |
|
|
(0.026)* |
(0.029)* |
(0.026)* |
|
|
Proanthocyanidins |
-0.425 |
-0.456 |
-0.418 |
|
|
|
(0.029) |
(0.19) |
(0.032)* |
|
|
Nitrogen |
|
|
|
|
|
|
Total |
0.165 |
0.41 |
0.195 |
|
|
|
(0.398) |
(0.036) |
(0.319) |
|
|
Available |
0.107 |
0.332 |
0.117 |
|
|
(0.584) |
(0.09)* |
(0.550) |
|
|
Neutral-detergent fibre |
0.009 |
0.038 |
- |
|
|
|
(0.960) |
(0.843) |
(1) |
|
|
In vitro digestibility |
0.191 |
0.163 |
0.202 |
|
|
|
(0.322) |
(0.399) |
(0.297) |
|
|
Warm dry season |
|
|
|
|
|
Polyphenols |
|
|
|
|
|
|
Total soluble |
0.05 |
- |
-0.016 |
|
|
(0.787) |
(1) |
(0.945) |
|
|
Proanthocyanidins |
-0.414 |
-0.386 |
-0.246 |
|
|
|
(0.027)* |
(0.041)* |
(0.27) |
|
|
Nitrogen |
|
|
|
|
|
|
Total |
0.281 |
0.286 |
0.187 |
|
|
|
(0.135) |
(0.133) |
(0.406) |
|
|
Available |
0.393 |
0.4 |
0.202 |
|
|
(0.037)* |
(0.036)* |
(0.369) |
|
|
Neutral-detergent fibre |
-0.059 |
-0.129 |
0.047 |
|
|
|
(0.752) |
(0.496) |
(0.836) |
|
|
In vitro digestibility |
0.084 |
0.171 |
0.154 |
|
|
|
(0.652) |
(0.364) |
(0.491) |
|
1 Tabulated entries are Kendall TAU B nonparametric correlation coefficients (Kendall, 1970) with the probability that the coefficient equals zero underneath in brackets. Negative signs proceeding correlation coefficients suggest avoidance. Other entries suggest positive selectivity. Probability values less than 0.1 were considered significant. This is denoted by an asterisk (*).2 Where the long rains are a time of high forage abundance and diversity and the warm dry season is a time of low forage abundance and diversity.
3 See text for references concerning chemical constituents.
Source: Woodward and Coppock (1989).
It was concluded that 29 woody species could be divided into four categories of development potential. Two species provided the mainstay of the browsing system already; 10 species could have greater impact if they were more abundant and the rest were either not feed resources or there was insufficient information on them (Table 3.7). Of the four species that were not feed resources, three (Acacia drepanolobium, Albizia amara, and C. africana) have been considered as invaders in range trend evaluations Billé and Assefa Eshete, 1983; Michel Corra, ILCA, personal communication; Tamene Yigezu, 1990). Despite A. brevispica being labelled as an encroacher, it is serving an important role as a forage. This was previously noted by Belete Dessalegn (1985).
Table 3.7. Categorisation of woody species in the Beke Pond region of the southern rangelands according to development potential based on their relative abundance in diets of camels and small ruminants and in the plant community during 1985-86.
|
I. Current forage resources (i.e. greater than 10% in diets and vegetation) |
|
|
All seasons: |
Acacia brevispica |
|
Dry seasons: |
Euclea shimperi |
|
II. Forage resources with development potential (i.e. selected for by livestock; greater than 10% in diets but less than 10% in vegetation) |
|
|
All seasons: |
Dichrostachys cinerea |
|
Rhus natalensis |
|
|
Rainy seasons: |
Acacia etbaica |
|
Grewia tembensis |
|
|
Ormocarpum mimosoides |
|
|
Dry seasons: |
Acacia tortilis |
|
Balanites spp |
|
|
Cadaba farinosa |
|
|
Capparis tomentosa |
|
|
Grewia bicolor |
|
|
III. Not potential forage resources (i.e. selected against by livestock; greater then 10% in vegetation but less than 10% in diets) |
|
|
|
Acacia drepanolobium |
|
Albizia amara |
|
|
Commiphora africana |
|
|
Lannea flocossa |
|
|
IV. Others (i.e. insufficient information; less than 10% in diets or vegetation) |
|
|
|
Acacia bussei |
|
Acacia goetzi |
|
|
Acacia seyal |
|
|
Boscia angustifolia |
|
|
Dahlbergia microphylla |
|
|
Phyllanthus somalensis |
|
|
Caucanthus auriculatus |
|
|
Combretum moue |
|
|
Commiphora habessinica |
|
|
Cordia gharaf |
|
|
Plectranthus ctilongipes |
|
|
Vemonia cinerascens |
|
Source: Woodward (1988).
A list of 114 plant species used in pastoral households is presented in Table B7, Annex B. These plants have many traditional uses including fencing and firewood (26 species); home construction (16 species); wood and fibres for making household utensils (38 species); medicines for people and livestock (44 species); food for people during years of average or below-average rainfall (49 species); extracts for leather tanning and dyes (10 species); charcoal for incense, fumigation of insects and microbial fumigation of milk-processing containers (15 species); and for spiritual or ceremonial purposes (12 species). On average, each species listed has about two uses but some have over seven to nine uses. Degree of traditional use should influence range management strategies. For example, of the 13 woody species regarded as invaders in the rangelands by Hacker (1990; see Table B8, Annex B), 11 have at least minor uses as food, construction material, medicine and fumigants (Table B7, Annex B). (Readers interested in the vernacular names of native plants throughout Ethiopia should consult Wolde Michael Kelecha, 1987).
Grasses and shrubs mentioned by pastoralists as valuable for calf feeding (grazing or cut and carry) during dry seasons of different degrees of rainfall years are shown in Table B9, Annex B. Pennisetum spp were consistently ranked as the most important grasses especially in drier years. Located on deep black soils, Pennisetum spp may be the only herbaceous plants with green tissue during dry periods, which explains their utility (Menwyelet Atsedu, 1990). Shrubs were more important in drought years (Table B9, Annex B). The most important fruit-producing trees for livestock were reported to be A. tortilis in dry seasons of all years and A. tortilis and A. nilotica in drought years (Menwyelet Atsedu, 1990).
There was a nearly unanimous opinion in eight of nine madda that substantial increases in woody cover had occurred in recent times (N = 60 group interviews of olla residents (Coppock and Mulugeta Mamo, 1985); N = 5 group interviews of madda leaders (Solomon Dessalegn, ILCA/TLDP postgraduate researcher, unpublished data). Increased woody cover reportedly varied from local to regional scales of resolution and trends were attributed to overgrazing and government policy which restricted range burning by pastoralists (Coppock and Mulugeta Mamo, 1985; Solomon Dessalegn, ILCA/TLDP postgraduate researcher, unpublished data). The Boran appreciated, however, that different types and/or stages of woody encroachment can have a variety of effects on the environment (Coppock and Mulugeta Mamo, 1985; see Section 3.3.3.2: Interactions among woody and herbaceous plants). At the early stages of encroachment, shading and associated effects of some woody plants are perceived to encourage valuable forage grasses in certain locations. Encroachment also provides easy access to fuelwood and construction materials. Once encroachment becomes pronounced, however, the situation deteriorates in terms of reduced herbaceous cover and hide-out for livestock predators such as lions.
The Boran also report that households are less mobile than in the past and this has contributed to resource-use problems (D. L. Coppock, ILCA, unpublished data; Menwyelet Atsedu, 1990). Reduced mobility by households, as a result of population growth and full occupation of preferred land, has led to changing opinions regarding participation by the Boran in bush-control programmes. This is reported in Section 7.3.1.4: Site reclamation.
Solomon Dessalegn (ILCA/TLDP postgraduate researcher, unpublished data) reported a general concern among leaders of five madda regarding a declining range condition for grazing over the past 10 years. Coppock (ILCA research scientist, unpublished data) reported similar pastoral perceptions of range trend based on N = 30 interviews of leaders in six madda. Concerns with overpopulation, overgrazing and bush encroachment as consequences of high stocking rates were commonly stated by respondents. Strategies to deal with balancing resource demand and use are forwarded in Chapter 7: Development-intervention concepts.
![]()
![]()
![]()