![]()
![]()
![]()
Abstract
Introduction
Materials and methods
Results and discussion
References
C. Kirda and K. Reichardt
International Atomic Energy Agency
Laboratory, A-2444 Seibersdorf, Austria
Field spatial variability in association with soil water status in the root zone and different error components influencing soil water content measurements with the neutron-scattering method were evaluated under three cropping conditions. The work was carried out along three 96-m-long transects with 63, equally spaced, water content measuring sites in each. The first transect was bare soil, the second planted to ryegrass and the third planted to alfalfa. Auto-correlation and cross-correlation analysis of geostatistics were used to evaluate spatial dependence of soil water content measurements made with the neutron-scattering method. It was found that field variability in soil water content measurements was space dependent over a distance of about 56m and this implied that the measurement domain of neutron-scattering method for this particular field was an area of about 12 m diameter. Different cropping conditions did not influence the space dependence of the measurements. The results are discussed in the context of the influence of spatial dependence on field experiment designs.
Time invariance of spatial distribution of water content measurements were also discussed. It was found that some measuring sites common to all the three transects had consistently known deviations from the mean value of the measurements. This finding demonstrated that one could characterise soil water status of a given field at a specified precision based on measurements made at a small number of locations specific for a given field but not influenced by different cropping conditions.
Total error of water content measurements with the neutron-scattering method was lowest (0.028 cm H2O cm3) in the bare soil and highest (0.049 cm H2O/cm3) in the alfalfa transect for the measurements made late in the season. Relative magnitudes of error components making up the total error were nearly the same and constant in the bare soil and ryegrass transects for a period of over 100 days of measurement records, whereas in the alfalfa transect they were time dependent. The total error in the alfalfa transect late in the season was almost double that at planting time. This showed that an additional error was introduced in water content measurements as alfalfa roots developed fully.
Since the earlier work of Gardner and Kirkham (1952) and van Bavel (1963), the neutron-scattering method of measuring soil water content in the field has gained wide acceptance. In many circumstances the neutron-scattering method has advantages over traditional methods, e.g. gravimetric sampling, because it is rather simple, non-destructive, and results of measurements can be obtained almost instantly. However, it is an indirect method, since the probes have to be calibrated. It has been shown that the effects of soil composition and bulk density on the calibration curve of neutron probes were the most common and important problems associated with the neutron-scattering method (Marais and Smit, 1962; Rawitz, 1969; Vachaud et al, 1977). Hewlett et al (1964), Sinclair and Williams (1979) and recently Haverkamp et al (1984) have evaluated various error components involved in soil-water studies in the field using the neutron-scattering method.
Vachaud et al (1984) suggested that it was feasible to identify certain measuring sites in a given field where deviations of soil water content measurements from the field mean value were nearly constant at all times. They demonstrated that this was true under a given cropping condition. The relevance of the suggested idea was that a small number of measuring sites could be identified which would characterise the soil water status of a field, thus reducing the effort and cost of measuring needed to achieve a given degree of precision. In the present work we evaluated the suggested approach under different cropping conditions.
To our knowledge no work has been done dealing with measurement domains of the neutron-scattering method. Thus it was the objective of this work to examine this question in addition to analysing the errors inherent in the neutron-scattering method under different cropping conditions.
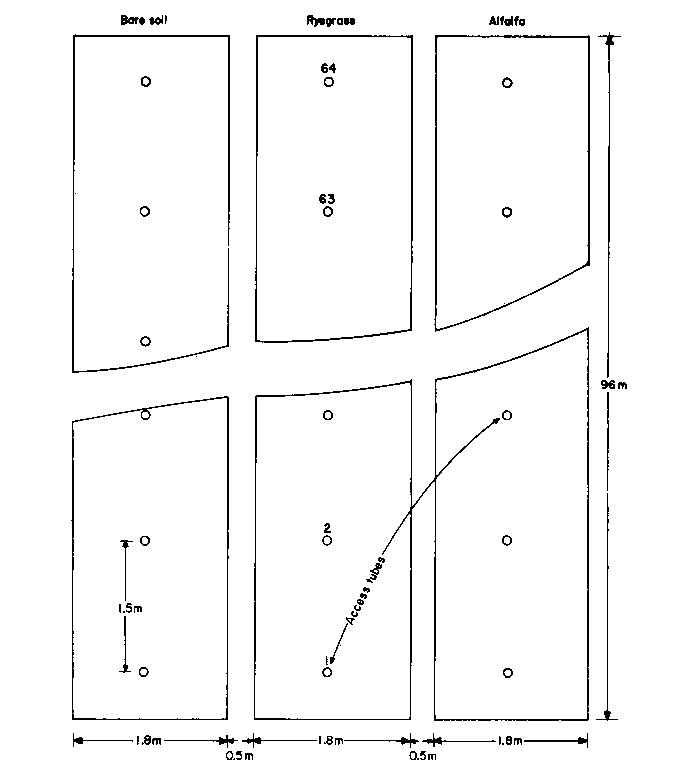
A field experiment consisting of three transects, each 96 m long and 1.8 m wide, was set up at the FAO/IAEA Agricultural Biotechnology Laboratory research fields, Seibersdorf Laboratory, Austria, in 1984 (Figure 1). The first transect was bare soil, the second planted to rye grass (Lolium multiflorum L.) and the third to alfalfa (Medicago sativa L.). The soil was classified as a Typic Eutrocrepts with coarse clay loam texture (Fried et al, 1984). The primary objective of the experiment was to examine the influence of spatial variability in the soil water status of the root zone on nitrogen fixation of alfalfa. However the discussion here is confined to problems of measuring the soil water status in the root zone.
Neutron-probe access tubes were installed in all three transects at intervals of 1.5 m. The soil water content of the root zone was measured at 25 cm depth at all measuring sites at 2-week intervals during the summer 1984, using a Troxler 3220 Series depth neutron probe.
Figure 1. Experimental layout in the field
Spatial variability
Auto-correlation and cross-correlation analysis of regionalised variable theory of geostatistics (Davis, 1973; Journel and Huijbregts, 1978) were used to assess the spatial variance structure of the measurements of the soil water status of the root zone and to evaluate possible interaction of soil water status with fertilizer uptake by the plants.
The equation for calculating auto-correlation is usually given in the form of:
(1)
r(h)= C(h). C(0)-1
where C(h) is the estimated autocovariance of measured values separated by vectoral distance h which is called "lag", and C(O) is the estimated total sample variance. For the one-dimensional case, the autocovariance is given by:
(2)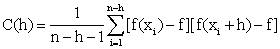
where f is the sample mean, n is the total number of measuring sites, and f(xi) and f(xi+h) are measured values along the experimental transect at sampling sites xi and xi+h. The random function describing measured data [i.e. f(x)] must show a form of stationarity for autocorrelation analysis to be valid (Davis, 1973). In the case of nonstationary data, a detrending procedure described by Bresler et al (1974) was used to meet the assumption of stationarity.
The concept of zone of influence (ZI) described by Gajem et al (1981) and Russo and Bresler et al (1981) was used to estimate the spatial measurement domain of the neutron-scattering method for measurements of the soil water status of the root zone. ZI is defined as being the distance over which the measurements in question are spatially correlated and are thus not independent.
The ZI of measurements were calculated using the statistic (Davis, 1973):
(3)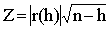
where Z is tabulated two-tailed deviations. For 95% confidence Z= 1.645. From equation (3) one derives:
(4)
r0.05 =1.645 / (n-h)
where r0.05 is the minimum correlation coefficient which is to be compared with experimentally measured values to calculate ZI. Thus the distance corresponding to maximum lag satisfying
(5)
r(h) >r0.05
is defined as ZI with 95% confidence.
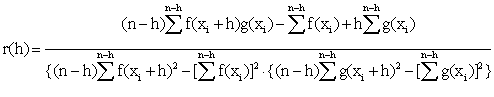
Cross-correlation analysis can be best used to investigate relationships among different soil properties, as well as the influence of soil properties on plant growth characteristics, such as yield, fertilizer uptake, atmospheric nitrogen fixation etc. If one designates two different sets of data as f(xi) and g(xi), both measured along the same transect sequentially, then cross-correlation of these two sets of data is given by (Davis, 1973):
(6)
Time invariance
The procedure described by Vachaud et al (1984) was followed in order-to evaluate time invariability of spatial distribution of water content measurements. Deviations of any given individual measurement of soil water content, q i,j at site i (i = 1 to 64) and time j (j = 1 to 8) is calculated using the equation:
(7)
where
(8)
In order to obtain dimensionless numbers, deviations are normalized with the equation:
(9)
d i,j = D ij / q ij
Thus, for any location i the time average of  and standard deviation could be easily calculated. The results are discussed to evaluate the influence of different cropping conditions on time invariability of spatial distribution of root zone soil water content measurements.
Error analysis
If one wants to estimate mean water content with the neutron-scattering method in a given field where n measuring sites are chosen at random, it is of interest to evaluate the relative contribution of various errors to total covariance of estimated water content. Neutron count rates are recorded (C, counts per second at each measuring site for a period of T seconds to measure soil water content with the neutron method. The mean count rate Cs in a standard medium is also measured for a period of Ts seconds at about same time as field measurements are made. Using a previously determined calibration curve of neutron-scattering method of the form:
(10)
one can easily estimate field mean water content  (cm3/cm3). In the above relation, a and k are constants associated with the linear calibration curve, R is the field mean count rate ratio defined as:
(11)
where  is the field mean count rate. Assuming a and
  to be independent and replacing population values by their associated estimates, Sinclair and Williams (1979) and Vauclin et al (1984) have shown that total variance of estimated field mean water content is:
(12)
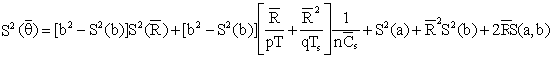
where notation S2 is used for the unbiased estimate of variance and S is used for the unbiased estimate of covariance as used by Sinclair and Williams (1979). In the relation, p and q are the number of replicate count rates at the measuring site in the field and in the standard medium, respectively. First and second terms on the right-hand side of the relation are locational and instrumentation errors, respectively, and the remaining terms represent calibrational errors. In the present work, measurements of soil water content made with neutron-scattering method under different cropping conditions are discussed within the context of the error analysis outlined above.
Spatial variability
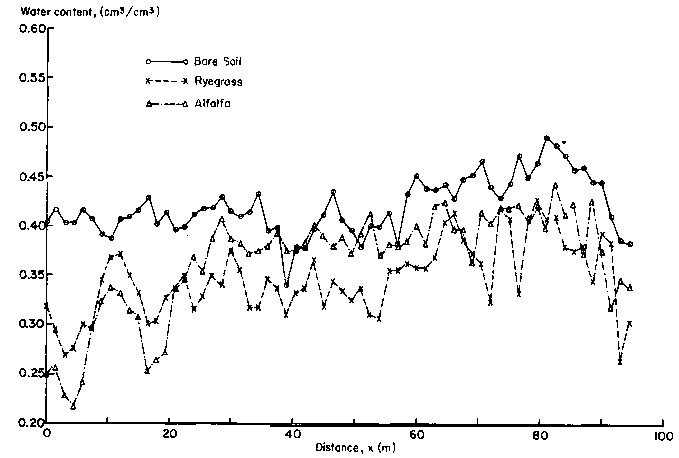
An example of the soil water status of the root zone measured along the experimental transects just before an irrigation is given in Figure 2. Mean soil water contents for each transect are different, with the highest value observed in the bare soil transect and the lowest in the alfalfa transect. The differences in mean values are in accord with different evaporation conditions and plant water usage in the transects. This demonstrates the value of the neutron-scattering method in studies of plant water consumption as an alternative to using lysimeters. Barrada (1965) pointed out that the main problems in plant water consumption studies lie in estimation of percolation of water below the rooting depth. However, this problem can be overcome with combined use of tensiometers and neutron gauges (De Boodt et al, 1967)
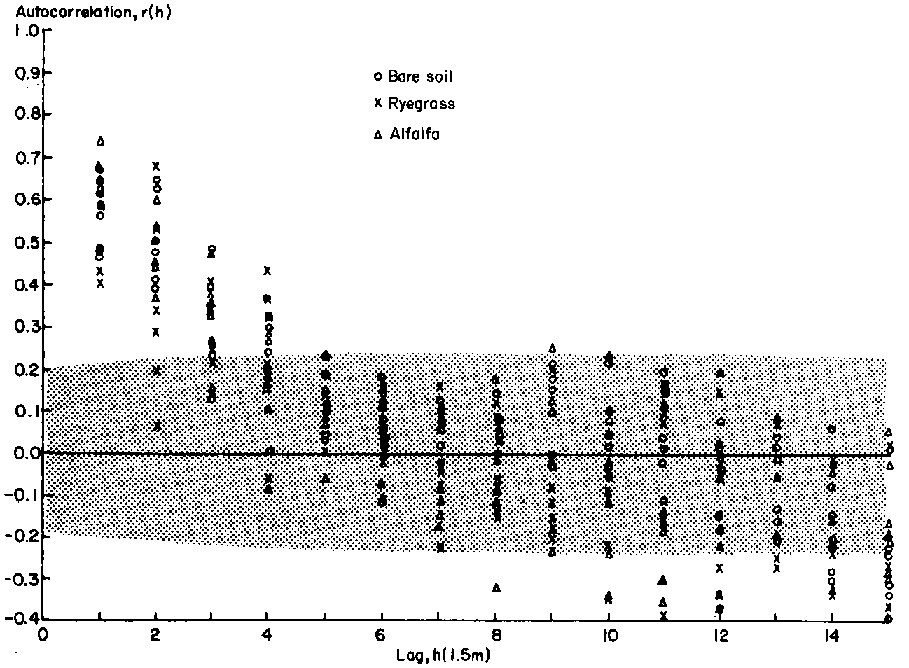
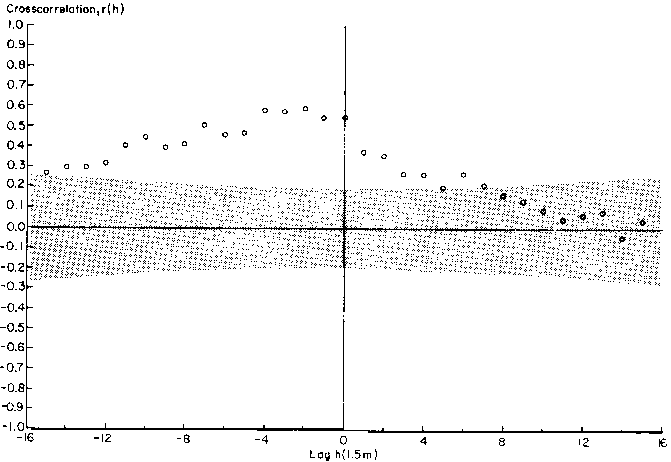
Table 1 gives a summary of basic statistics in relation to soil water content of the root zone for all the measurements. The coefficient of variation (CV) of the measurements ranged from 6.8 to 14.9%, indicating rather high variability in soil water content of the root zone of the three transects. Some portion of the observed variability in water content measurements stems from non-uniform distribution of irrigation water, in spite of the care taken to ensure uniform distribution. Because water content measurements were made every 2 weeks, irrespective of irrigation schedules, a major contribution to variability in water content measurements comes from heterogeneity of the soil itself. However, autocorrelograms of water contents constructed to cover a period of about 100 days show similar variance structure and do not seem to depend on different cropping conditions (Figure 3). Soil water content measurements with the neutron-scattering method were correlated over a distance of about 6 m (i.e. ZI = 4 lags) at the 95% confidence level indicated by the shaded area in Figure 3. This implies that the spatial measurement domain
Of the neutron-scattering method in the field is about 12 m. If one is to draw a field map describing soil water status, the maximum mapping unit is determined by the measurement domains of the method in question. Depending on the particular method of measurement, measurement domains may differ.
One of the important implications of spatial dependence is on field experiment designs (McBratney, 1985). As water content measurements are spatially dependent and correlated over a distance of about 6 m, treatment plots and replicates of an experiment dealing with soil water status must be separated by distances at least equal to ZI. Only under this condition can measurements made in each experimental plot be assumed to be independent, a crucial prerequisite in field experiment designs (Schmitt, 1969).
Table 1. Basic statistics of soil water content measurement (% cm/cm) in the experiment transects.
|
Date |
1 June |
20 June |
10 July |
26 July |
10 Aug |
24 Aug |
10 Sept |
|
Bare soil |
|||||||
|
Mean |
41.1 |
38.0 |
39.3 |
38.4 |
28.4 |
41.6 |
42.1 |
|
s 2 |
11.2 |
9.1 |
8.5 |
7.9 |
9.2 |
9.5 |
8.7 |
|
Min. |
34.6 |
30.7 |
32.2 |
31.4 |
20.9 |
35.1 |
34.0 |
|
Max. |
48.3 |
43.8 |
47.3 |
44.0 |
34.4 |
48.7 |
49.3 |
|
CV (%) |
8.1 |
7.9 |
7.4 |
7.3 |
10.6 |
7.4 |
7.0 |
|
Ryegrass |
|||||||
|
Mean |
40.3 |
37.3 |
36.3 |
38.4 |
28.5 |
34.9 |
34.8 |
|
s 2 |
10.0 |
14.0 |
15.2 |
8.1 |
11.1 |
16.5 |
14.2 |
|
Min. |
34.8 |
31.0 |
30.3 |
31.1 |
22.2 |
23.2 |
26.6 |
|
Max. |
47.3 |
44.0 |
45.0 |
43.9 |
35.7 |
42.8 |
42.9 |
|
CV (%) |
7.9 |
10.0 |
10.7 |
7.4 |
11.7 |
11.7 |
10.9 |
|
Alfalfa |
|||||||
|
Mean |
41.9 |
40.2 |
35.3 |
38.4 |
40.7 |
37.8 |
36.5 |
|
s 2 |
10.9 |
10.7 |
12.7 |
7.9 |
7.6 |
15.7 |
29.4 |
|
Min. |
34.9 |
33.8 |
25.4 |
31.6 |
35.7 |
30.4 |
21.8 |
|
Max. |
49.3 |
46.3 |
41.9 |
43.7 |
47.5 |
45.8 |
44.6 |
|
CV (%) |
7.9 |
8.1 |
10.1 |
7.2 |
6.8 |
10.5 |
14.9 |
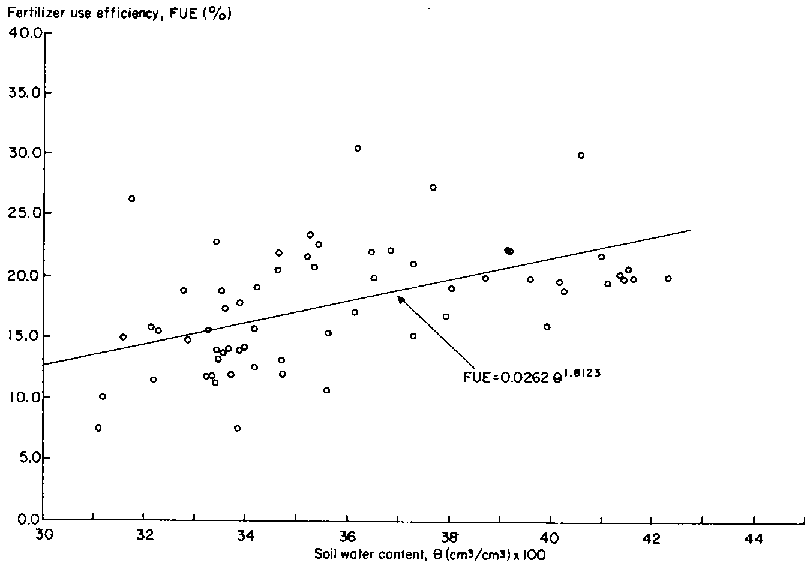
In field experiments one usually tries to avoid variability in soil conditions and sets up the experiments in those areas which appear to be relatively uniform. In as much as one can argue on the criteria used to select a uniform site for an experiment, it is possible to make use of the variability rather than avoiding it. The variability in soil water content under the cropped transects implies that the differences in soil water content of the root zone among the measurement sites were a reflection of the variability of the soil. Thus it is possible to evaluate the influence of the soil water content in the root zone on various plant growth indicators, e.g. fertilizer uptake, nitrogen fixation, etc. simply by using inherent variability in the field without setting up special treatment plots. As an example, Figure 4 shows a strong cross-correlation between soil water content and uptake of nitrogen fertilizer by ryegrass. The nature of the possible mathematical relation describing the intercorrelation shown in Figure 4 is shown in Figure 5. Evaluation of the relation shown in Figure 5 is very difficult, if not impossible, with traditional field experiment designs where the number of treatment plots is 5 or 6 at the most. One can examine numerous other possible interrelations between soil properties and plant growth indicators with the approach described here.
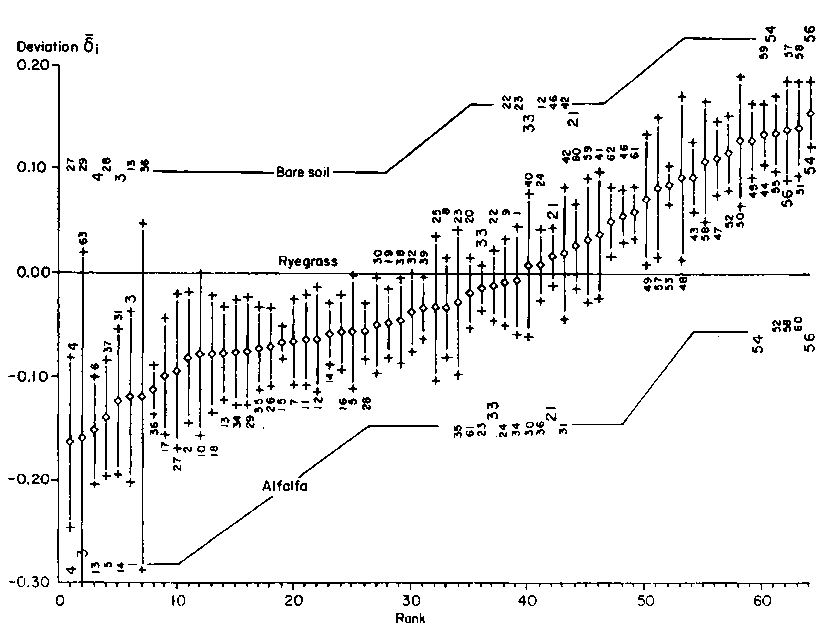
Time invariability
Time average  and temporal standard deviation of d i, for the three transects are calculated using equation (9) and ranked in ascending order. The results for ryegrass are shown in Figure 6. Ranks for deviations of bare soil and alfalfa for some locations are also shown on the same figure to compare with those of the ryegrass transect. It is interesting to note that some sites give values close to the average soil water content of the transect, irrespective of transect treatment. Water content measurements made at sites 21 and 53 are closest to the transect mean in the bare soil, ryegrass and alfalfa treatments. It is also possible to identify some sites that consistently either over estimate (i.e.
  > 0), sites 54 and 56), or underestimate (i.e.
  < 0. sites 3 and 4) the transect mean water content, regardless of time of measurement and different cropping conditions.
Vachaud et al (1984) explained the described behaviour in their work by a deterministic relation between soil water content and soil texture. This implies that under a given water management practice, the location with the highest clay content remains the wettest at all times. This feature may have important practical implications in irrigation management, where irrigation specialists are only interested in estimating the mean water content of the field as a whole. In this case it is possible to estimate the mean field water content based on a limited number of measurements made in a particular, previously identified, site. It would seem that a lot of effort has to be made to identify the sites which have the least deviation (i.e.,  ) from the field mean. The authors, however, feel that the experimental fields must be characterised in any case for better field experiment designs. The approach described here can be used from the point of view of soil water studies.
Error analysis
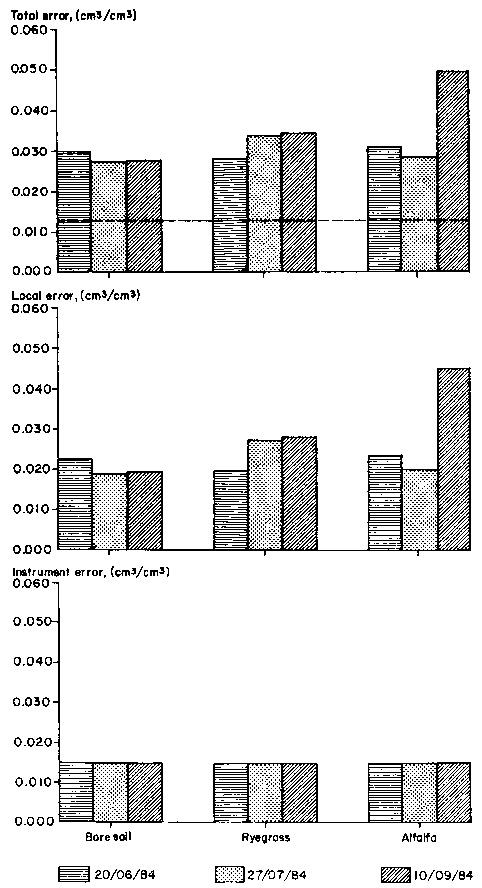
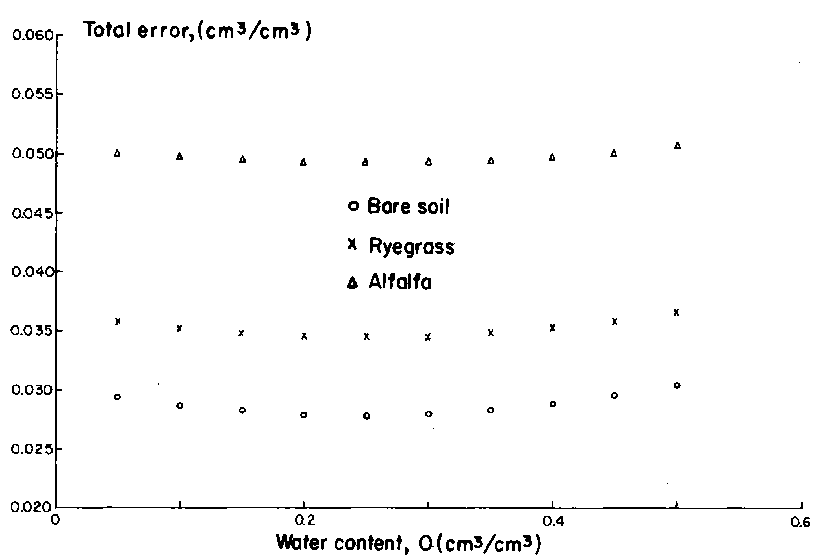
Parameters of the calibration curve for the neutron probe used in the experiment are given in Table 2. Total variance of soil water content measurements is calculated using these parameters in equation 12. Total errors of the measurements which are simply the square root of variances (i.e. standard deviation) exhibit a minimum when they are plotted as a function of water content (Figure 7). The mentioned behaviour varies according to cropping conditions. The lowest value of the minimum error occurred in the bare soil transect, was higher in the cropped transects and was highest in the alfalfa transect (Figure 7). As can be seen in Figure 8, relative differences with respect to magnitude of errors of the different transects were found to be time dependent. Total errors in the bare soil and ryegrass transects were nearly constant, whereas in the alfalfa transect it almost doubled as compared to errors of measurements made near to planting time. This shows that an additional error is introduced into soil water content measurements as alfalfa roots develop fully. The effect was less in the ryegrass transect because the effective roots of ryegrass are confined to shallower soil depths. The discussed error reflects itself in the local error component and thus the contribution of calibration error gradually decreases at the late season (Figure 8). In conclusion it can be stated that changes of plant root density and root activity during the growing season can also influence calibration curves of neutron probes, in addition to soil composition and soil bulk density. The relative importance of various error components in soil water content measurements have to be evaluated under different cropping conditions as well as different irrigation management practices, and compared with other methods, e.g. gravimetric sampling, tensiometers, resistance blocks etc. to select the appropriate methodology to meet the needs of each user.
Table 2. Parameters of calibration curve for the neutron probe.
|
Soil depth (cm) |
a |
b |
S2 (a) |
S2 (b) |
s(a,b) |
r |
|
25 |
-1.096 |
1.946 |
4.296x1-3 |
8.705x10⁻³ |
-5.990x10⁻³ |
0.949 |
Figure 8. Time dependence of error components of soil water content measurements made with the neutron-scattering method under different cropping conditions, 1984.
Barrada Y. 1965. The neutron moisture meter and its value in water-use efficiency studies. At. Energy Rev. 3: 195212.
Bresler E, Dagan G. Wagenet R J and Laufer A. 1984. Statistical analysis of salinity and texture effects on spatial variability of soil hydraulic conductivity. Soil Sci. Soc. Am. J. 48: 16-25.
Davis J C. 1973. Statistics and data analysis in geology. John Wiley and Sons, New York. 550p.
De Boodt M, Hartmann R and De Meester P. 1967. Determination of soil moisture characteristics for irrigation purposes by neutron-moisture meter and air-purged tensiometers. In: Proceedings of the Symposium on Isotope and Radiation Techniques in Soil Physics and Irrigation Studies. IAEA, Istanbul, Turkey. pp. 147-160.
Fried M, Danso S K A and Zapata F. 1984. The methodology of measurement of N2 fixation by nonlegumes as inferred from field experiments with legumes. Can. J. Microbiol. 29:1053-1062.
Gajem Y M, Warrick A W and Myers D E. 1981. Spatial dependence of physical properties of a typic Torrifluent Soil. Soil Sci. Soc. Am. J. 45:709-715.
Gardner W and Kirkham D. 1952. Determination of soil moisture by neutron scattering method. Soil Sci. 73:391-401.
Haverkamp R. Vauclin M and Vachaud G. 1984. Error analysis in estimating soil water content from neutron probe measurements. 1. Local standpoint. Soil Sci. 137:7890.
Hewlett J D, Douglas J E and Clutter J L. 1964. Instrumental and soil moisture variance using the neutron scattering method. Soil Sci. 97:19-24.
Journel A O, Huijbregts C J. 1978. Mining geostatistics. Academic Press, New York. 600 pp.
Marais P G and Smit W B De V. 1962. Effect of bulk density and of hydrogen in forms other than free water on the calibration curve of neutron moisture meter. S. Afr. J. Agr. Sci. 5:225-238.
McBratney A B. 1985. The role of geostatistics in the design and analysis of field experiments with reference to the effect of soil properties on crop yield. In: Soil spatial variability. Proceedings of a workshop of ISSS and SSSA, Las Vegas, USA, 30 November - 1 December 1984. pp. 3-8.
Rawitz E. 1969. Installation and field calibration of neutron-scatter equipment for hydrologic research in heterogeneous and stony soils. Water Resour. Res. 5: 519-523.
Russo D and Bresler E. 1981. Soil hydraulic properties as stochastic processess: I. An analysis of field spatial variability. Soil Sci. Soc. Am. J. 45:682-687.
Schmitt S A. 1969. Measuring uncertainty, an elementary introduction to Bayesian statistics. Addison-Wesby Pub. Col, London. 400 pp.
Sinclair D F and Williams J. 1979. Components of variance involved in estimating soil water content and water content change using a neutron moisture meter. Aust. J. Soil Res. 17:237-247.
Vachaud G. Passert de Silans A, Balabanis P and Vauclin M. 1984. Temporal stability of spatially measured soil water probability density function. Soil Sci. Soc, Amer. J.
Vachaud G. Royer J M and Cooper J D. 1977. Comparison of methods of calibration of a neutron probe by gravimetry of neutron-capture model. J. Hydrol. 34:343-356.
Van Bavel C H M. 1963. Neutron scattering measurement of soil moisture: Development and current status. In: Proceedings of an International Symposium on Humidity and Moisture. Washington DC, USA. pp. 171-184.
Vauclin M, Haverkamp R and Vachaud G. 1984. Error analysis in estimating soil water content from neutron probe measurements: 2. Spatial standpoint. Soil Sci. 137: 141-148.
![]()
![]()
![]()