Gilead I Mlay
Department of Rural Economy, Sokoine University of Agriculture, Tanzania
Abstract
Introduction
The model
Results and discussion
Reference
Crop by-products are bulky and of low value, and high transportation costs can be incurred if they are not located in user sites. For many smallholder farmers raising livestock under a zero grazing system, high transport costs are unavoidable as long as the by-products are transported in loose form and economics of scale cannot be realized due to small volume requirement.
On cooperative basis, by-products can be baled to reduce losses and to increase the quantity of material transported. Such a measure will reduce the cost of transportation per unit weight of by-products. A further distribution efficiency can be gained if choice of routes minimizes distance or time taken to deliver the by-products.
This paper demonstrates the application of linear programming in organizing transportation of maize stover and bean straw from production zone to user sites in the Hai District. Three production zones and ten user sites have been identified. Estimates of by-products supply are based on hectarage and yield data for the District. Demand for the by-products is estimated using daily dry matter requirements per animal as a basis. Two scenarios are used, that is low level of feeding and high level of feeding. Costs of transporting the by-products are determined by considering components that are time dependent and those that are distance dependent.
Results obtained indicate that where several routes are available to reach the same destination, choice of routes to take will be that leading to minimization of costs. When the level of demand is increased by 22% transportation costs increase by 20% which is less than the increment in quantity shipped. The change in level of demand has in the process lead to additional activities coming into solution.
The increasing costs of manufactured feeds, and the declining land area available for grazing and/or pasture production due to human population pressure have led to a growing interest in the utilization of crop by-products to feed livestock. Although crop by-products are available in large quantities, they do not in all cases occur at user sites. Their bulkiness and low value cause the costs associated with transportation to be high. In addition, their removal from the fields and transportation may have to be done within a short time period to avoid spoilage by rain or to give way to field cultivation.
Smallholder dairy production in the Hai District is concentrated in the highland zone. The bulk of the crop by-products, mainly maize stover and bean straw, are obtained from the lowland zone. The average distance from the homestead in the highland zone to the farm plots on the lowland zone is 15 km (Urio and Mlay, unpublished data). By-products are transported in loose form using either human power or hired trucks. The loose form of transporting the by-products apart from leading to wastage, contributes to high cost per unit weight since volume limits the quantity that can be transported per trip. Baling would be one way to maximize the weight of by-products that can be transported per trip. Transport charges are fixed by contract and can be very variable. A survey conducted in the study area in March, 1986 showed that the average cost to transport a load of by-products over a distance of 7.5 km is Sh. 750. It is felt that costs associated with utilization of by-products can be reduced if the Cooperative movement undertakes on a commercial basis the function of baling and transportation of the by-products to user sites.
The objective of this paper is to demonstrate the application of mathematical programming techniques in planning the transportation of the by-products to user sites such that costs are minimized.
In the Hai District, three zones have been identified as having the potential for large scale baling of maize stover and bean straw. These are Sadala-Weruweru, Sanya-West Kilimanjaro and Boma Ngo'mbe-Lawate. Ten user sites are considered in the problem and these are Mowo Njamu, Kirisha, Mae, Wanri, Siha, Kyuu, Nguni, Lukani, Machame and Lyamungo. The by-products are to be moved to central locations in the user sites, and these are selected to coincide with the location of the primary societies. Several of these central locations can be reached by more than one route. Since the cost of delivery is affected by distance travelled per unit of product delivered, any procedure which will result in driving a shorter distance or spending less time enroute while providing the same services can contribute to lower costs and improved marketing efficiency. Algebraically the transportation model can be presented as follows:
Minimize
(1)
Subject to
(2)
(3)

(4)
Where
i = production site index
j = consumption site index
Xij = Metric tons of maize stover transported from production zone i to user zone j
Tij = Cost of transporting one metric ton of maize stover from production zone i to user zone j
Vij = Metric tons of bean straw transported from production zone i to user zone
= Cost of transporting one metric ton of bean straw from production zone i to user zone j
Mj = Demand for maize stover from user zone j
Uj = Demand for bean straw from user zone j
The production component has been deliberately eliminated from the model, and estimates of maize stover and bean straw that can be produced by each zone are obtained from hectarage and grain yield data presented in table 1.
Table 1. Maize and Bean Production in Hai
|
Year |
Maize |
Beans |
||
|
Ha |
Production Tons |
Ha |
Production Tons |
|
|
1984/85 |
28530 |
57060 |
8010 |
3296 |
|
1985/86 |
29150 |
14575 |
8240 |
3190 |
Source: DADO's Office Hai District
The transportation cost per ton of by-products is estimated using the method proposed by Fedeler et al (1975). The costs are separated into costs allocated to distance and costs allocated to time as in equation 5.
TC = Ch + CmM (5)
where
TC = total truck costs per trip
Ch = the cost per hour of truck use
H = hours required for the trip
Cm = the cost per km of truck use
M = the distance of the trip in km.
Costs allocated to time include purchase value of the truck overhead and the driver's wages. The costs allocated to distance include fuel, oil and maintenance costs.
User sites demands are based on estimates of dairy animals in the district (Table 2) under two alternative assumptions. In the first case, it is assumed, that the animals obtain 16% of their dry matter requirements from maize stover and bean straw. In the second case it is assumed that this source supplies 22% of the dry matter requirements. In both cases, bean straw is set at 33% to reflect the limited supply. These assumptions generate two sets of demands as presented in table 3, hence permitting the observation of how costs change. A standard linear programming package is used to generate an optimum solution.
Table 2. Cattle Population in the Hai District
|
Division |
Cattle Type |
Number |
|
Lyamungo |
Local Zebu |
8646 |
|
Dairy |
2902 |
|
|
Beef |
45 |
|
|
Machame |
Local Zebu |
2311 |
|
Dairy |
7555 |
|
|
Beef |
24 |
|
|
Masama |
Local Zebu |
26518 |
|
Dairy |
6292 |
|
|
Beef |
3 |
|
|
Siha |
Local Zebu |
21298 |
|
Dairy |
6283 |
|
|
Beef |
5930 |
Source: Ministry of Agriculture and Livestock Development 1985 Livestock Census.
Table 3. Estimated Demand of Bean Straw and Maize Stover by User Sites in Metric Tons
|
User Site |
Bean Straw |
Maize Stover |
||
|
Scenario 1 |
Scenario 2 |
Scenario 1 |
Scenario 2 |
|
|
Kirisha |
32.7 |
98.2 |
58.2 |
174.6 |
|
Mae |
98.2 |
294.6 |
174.6 |
523.8 |
|
Mowo Njamu |
131 |
392.8 |
232.8 |
698.4 |
|
Wanri |
163.7 |
491 |
291 |
873 |
|
Siha |
65.5 |
196.4 |
116.4 |
349.2 |
|
Kyuu |
161.8 |
484.5 |
287.1 |
861.2 |
|
Ng'uni |
242.2 |
726.7 |
430.5 |
1291.8 |
|
Lukani |
80.7 |
242.2 |
143.5 |
430.6 |
|
Machame |
775.6 |
2326.7 |
1378.8 |
4136.4 |
|
Lyamungo |
297.9 |
893.7 |
529.6 |
1588.8 |
Source: Own estimates.
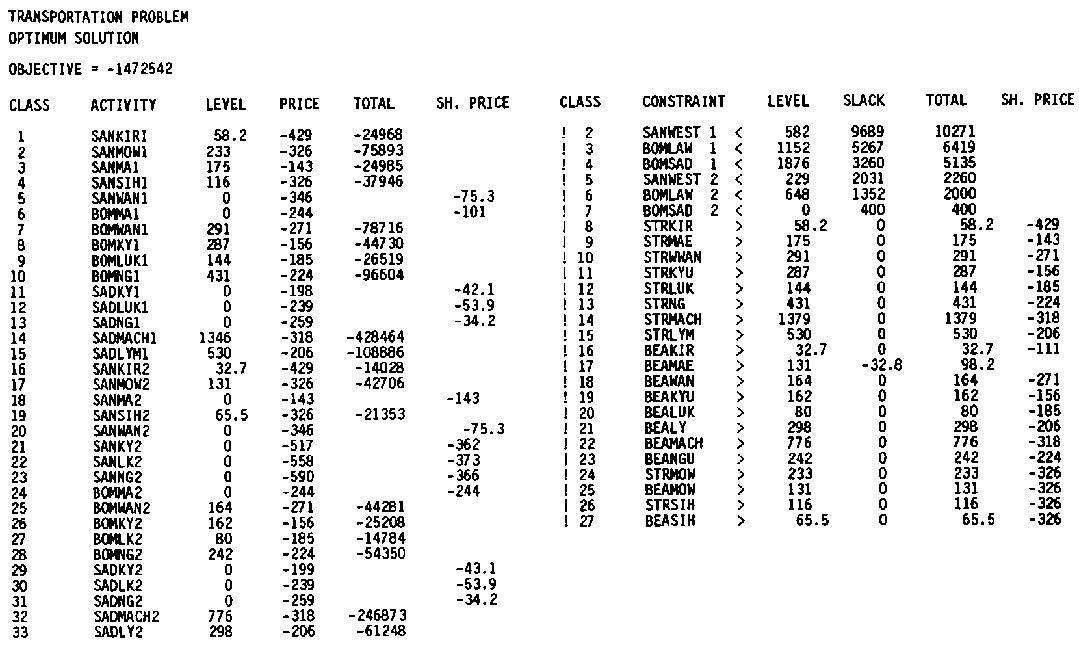
Table 4: Optimum Solution when the By-Products Provide 16 Percent of Dry Matter
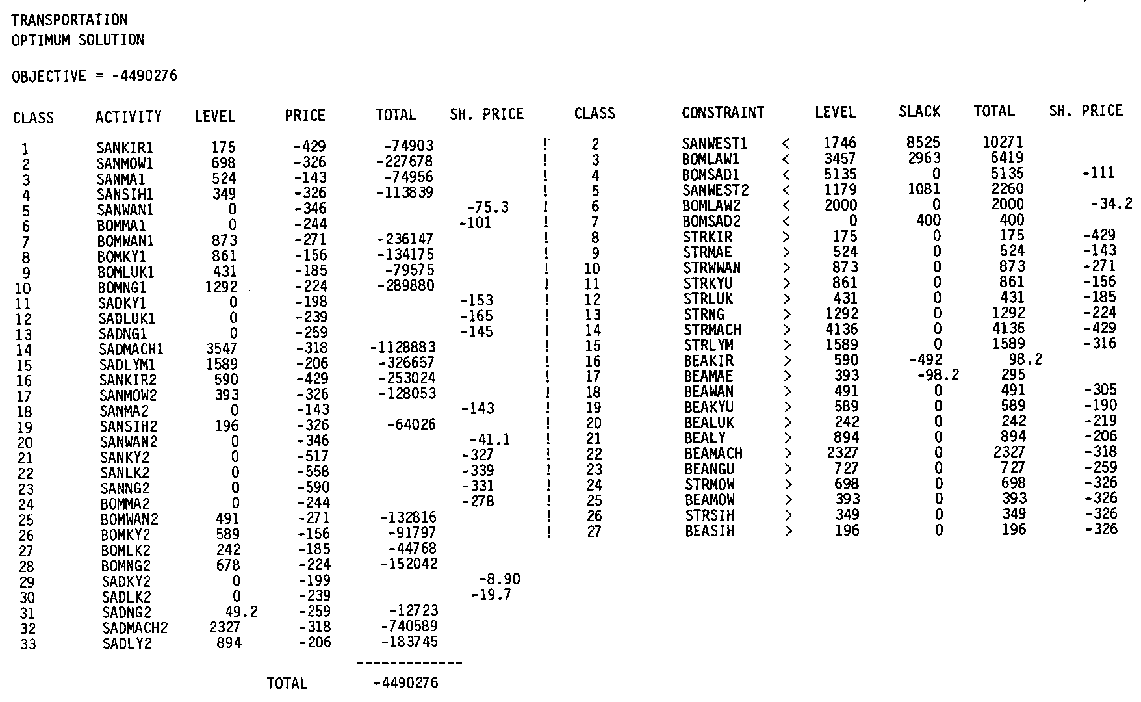
Table 5: Optimum Solution when the By-Products Provide 22 Percent of Dry Matter from By-Products.
The objective of the optimisation model is to select source and routes to deliver by-products to user sites to satisfy specific demands. In the case when maize stover and bean straw provide 16% of the required dry matter, the total cost of delivering the required quantities is Tz Sh 1,472,541. When the percentage contribution of dry matter from these two sources is raised to 22%, the total cost becomes TZ Sh 4,490,276 which is a 20.5% increase. The increase in dry matter contribution from crop residues has caused activities which were excluded in the initial solution to enter the optimum solution. Details of the results are presented in tables 4 and 5.
In addition to providing the optimum solution and costs for transporting the required quantities to user sites, shadow prices for activities in solution and exhausted resources are provided (Tables 4, 5). The shadow prices show how the optimum solution would change if a unit of the activity not in solution was forced into solution or if a unit of an exhausted resource was made available. These prices allow a user to evaluate the solution to see whether a change is required.
Although not implemented in the present analysis, sensitivity analysis on unit transport costs could be performed. This would permit the evaluation of the stability of the optimum transportation plan when unit costs on some of the routes change. The tool is therefore quite useful in evaluating alternatives before resources are committed, and can assist in planning an efficient crop by-products marketing system.
Fedler J.A., Heady E.O., Koo W.W. (1975). A "National Grain Transportation Model" Spatial Sector Programming Models in Agriculture. Ed. Heady E.O., Sirvastvaa U.K. Iowa State University Press, pp. 452-479.