![]()
![]()
![]()
The most important cattle performance traits at Mkwaja Ranch are cow reproduction, cow and calf viability, calf growth and cow weight. Aspects of these characters can be combined to build up an index such as total weight of weaner calf produced per cow per year, or per unit weight of cow per year, or per unit metabolic weight of cow per year. The merit of such indices lies in relating all the more important production characters back to the weight of breeding cow that has to be supported, which is closely associated with cow maintenance costs. Management decisions such as culling policy influence annual cow replacement rate and thus herd and lifetime productivity.
Table 12 summarises the overall performance levels achieved by Mkwaja Boran cattle from 1973 to 1982, and indicates the numbers of records available for analysis of each trait. The traits analysed were age at first calving and calving interval, representing reproductive performance; pre-weaning mortality, age at pre-weaning death, annual cow mortality and cow age at death, representing viability; birthweight, weaning weight and daily liveweight gain from birth to weaning, representing pre-weaning growth; weight of weaner calf per cow per year, representing productivity; heifer 36-month weight and daily liveweight gain from weaning to 36 months, and steer 45-month weight and daily liveweight gain from weaning to 45 months, representing post-weaning growth; cow weight at 4 to 15 years on a small available sample, representing mature cow weight; and annual cow culling rate and cow age at culling, representing breeding herd replacement.
Reproductive performance
Mortality
Causes of death
Bodyweights
Cow productivity
Cow culling
The mean age of first calving for 4460 heifers born from 1971 to 1978 was 47.0 ± 0.1 months, with a coefficient of variation of 14%. The mean calving interval for 11999 records from 1973 to 1981 was 15.9 ± 0.01 months, with a coefficient of variation of 36%. This mean calving interval was equivalent to an annual calving percentage of 75.3%.
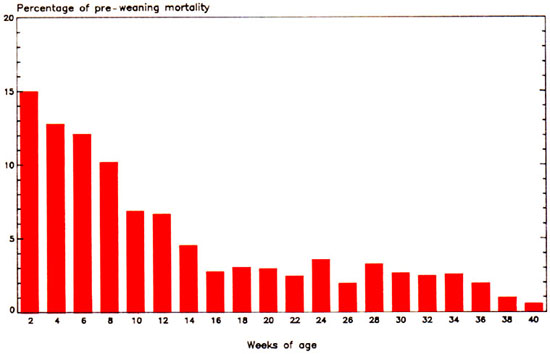
The mean pre-weaning mortality based on 18266 calves born from 1973 to 1981 was 8.0 ± 0.2%, with a coefficient of variation of 333%. The mean age at pre-weaning death, based on 975 calf deaths recorded from 1973 to 1981 was 82 ± 2.6 days with a coefficient of variation of 87.8%. The distribution of calf deaths at 2-weekly intervals from birth to 40 weeks of age is indicated in Figure 17. Fifty percent of calf deaths had occurred by 8 weeks, the majority being during the first 2 weeks of life.
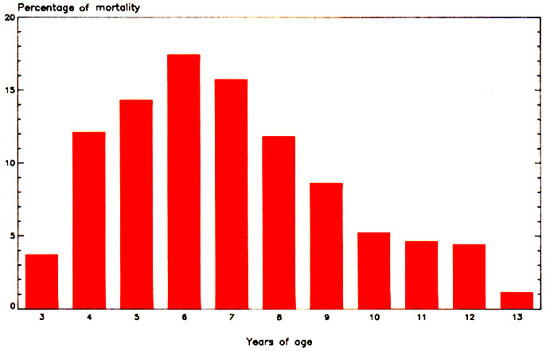
The mean annual cow mortality based on 45852 records from 1973 to 1981 was 5.8 ± 0.9%, with a coefficient of variation of 47%. The average mortality rate from disease was 4.2% per year, and from predators, accidents and loss 1.6% per year. The mean age at which cows died, obtained from 472 recorded dates, was 7.4 ± 0.1 years, with a coefficient of variation of 32.6%. Figure 18 indicates the age distribution at cow death, the peak being reached at 6 years.
Post-mortem examination forms were available for 452 calves and 341 breeding cows (Table 13). The postmortem findings were recorded in remarkable detail and allowed a specific diagnosis to be made in about 90% of cases. In both calves and adults, infectious diseases and predators were the major causes of mortality. However, there were some striking differences between calves and adults in the causes of death. Thus, anaplasmosis was confirmed in 79 cows (23.2% of all adults), whereas not a single case was diagnosed in calves. The diagnosis of anaplasmosis was made on the basis of the post-mortem findings of splenemagaly, generalised Iymphadenopathy, anaemia and/or jaundice, and confirmed by the demonstration of Anaplasma sp. piroplasms in blood smears stained with giemsa. Presumably, Anaplasma sp. were being transmitted by biting flies, as no cases of other tick-borne infections, such as East Coast Fever, Theileria mutans, babesiosis or heartwater, were diagnosed.
Table 12. Overall performance achieved by Mkwaja Boran cattle, 1973-82.
|
Trait |
No. of records |
Mean |
SE |
Coefficient of variation (%) | |
|
Reproductive performance | |||||
|
|
Age at first calving (months) |
4460 |
47.0 |
0.12 |
14.1 |
|
|
Calving interval (months) |
11999 |
15.93 |
0.06 |
36.2 |
|
|
Calving percentagea (%) |
11999 |
75.3 |
NAd |
NA |
|
Viability | |||||
|
|
Pre-weaning mortality (%) |
18266 |
8.0 |
0.20 |
332.3 |
|
|
Age at pre-weaning death (days) |
975 |
82.1 |
2.6 |
87.8 |
|
|
Annual cow mortality (%) |
45852 |
5.8 |
0.91 |
47.0 |
|
|
Cow age at death (years) |
472 |
7.4 |
0.1 |
32.6 |
|
Pre-weaning growth | |||||
|
|
Birthweight (kg) |
16275 |
24.9 |
0.04 |
16.3 |
|
|
Pre-weaning growth (g/day) |
16275 |
453.8 |
0.92 |
21.5 |
|
|
Weaning weight at 8 months (kg) |
16275 |
133.5 |
0.23 |
18.0 |
|
Productivity | |||||
|
|
Cow productivity indexb (kg) |
11999 |
101.9 |
0.47 |
44.9 |
|
|
Herd productivityc (kg) |
11999 |
96.0 |
NA |
NA |
|
Post-weaning growth | |||||
|
|
Heifer 36-month weight (kg) |
2252 |
261.0 |
0.67 |
11.4 |
|
|
Heifer post-weaning growth (g/day) |
2252 |
161.0 |
0.82 |
22.4 |
|
|
Steer 45-month weight (kg) |
2435 |
337.6 |
0.82 |
10.7 |
|
|
Steer post-weaning growth (g/day) |
2435 |
182.1 |
0.71 |
17.6 |
|
Mature cow weight | |||||
|
|
Cow weight (kg) |
564 |
286 |
1.3 |
10.0 |
|
Breeding herd replacement rate | |||||
|
|
Annual cow culling rate (%) |
45852 |
12.8 |
1.0 |
23.0 |
|
|
Cow age at culling (years) |
884 |
9.2 |
0.1 |
34.0 |
|
|
Annual cow replacement rate (%) |
45852 |
18.7 - |
1.4 |
22.3 |
a Calving percentage = (365 ÷ calving interval) x 100.
b Total calf weaning weight per cow per year.
c (Cow productivity index x annual cow viability) ÷ 100.
d NA = not applicable.
Salmonellosis accounted for the deaths of 98 calves (22% of all calf deaths), but only for 8 adult deaths (2.3% of total). Findings considered significant included an enlarged pale liver exhibiting focal areas of necrosis and haemorrhage, haemorrhagic gastroenteritis and generalised haemorrhages. In the majority of cases, the diagnosis was confirmed by the isolation of Salmonella sp., usually S. dublin, from the liver or spleen.
Trypanosomiasis did not appear to be a significant cause of death. It was diagnosed in three adults (trypanosomes identified) and suspected in a further seven animals. In calves, it was confirmed in two cases and suspected in another two. In the cases in which trypanosomes were not identified, trypanosomiasis was tentatively diagnosed by finding anaemic watery blood, enlarged lymph nodes and spleen, a flabby decompensated heart, indicating heart failure, and in some cases in which haemorrhagic T. vivax was suspected, a gut full of frank blood and generalised haemorrhages. In a further 20 necropsies (19 in adults), anaemia was obvious but its cause could not be identified.
Figure 17. Age distribution of calf deaths, Mkwaja Ranch, 1973-82.
Figure 18. Age distribution of cow deaths, Mkwaja Ranch, 1973-82.
Snake bites accounted for over 5% of all necropsies. Diagnosis was made on the basis of the herdmans's report and the finding of an oedematous haemorrhagic bruised bite site. In addition, there were generalised haemorrhages. The snake responsible is believed to be the mamba. A diagnosis of plant poisoning was made in 28 adults and 2 calves. The findings believed to be characteristic included myocardial haemorrhages, increased fluid in the body cavities, degeneration of the parenchymatous organs, namely the liver, kidneys and heart, and gastroenteritis, which occasionally was haemorrhagic. The plant Dichapetalum might have been responsible but this could not be confirmed. Starvation was confirmed as the cause of death in 38 calves; their dams had died or had become agalactic. Most calf deaths occurred over the first 8 weeks of life (Figure 17).
Predators were responsible for the deaths of a large number of animals, accounting for 44% of calf deaths and 20% of adult deaths. Lions were the main culprits.
Table 13. Cause of death among calves and cows, Mkwaja Ranch, 1973-82.
|
Diagnosis of cause of death |
Calves |
Cows |
|||
|
n |
(%) |
n |
(%) |
||
|
Anaplasmosis |
0 |
|
79 |
23.2 |
|
|
Salmonellosis |
98 |
21.7 |
8 |
2.3 |
|
|
Pneumonia |
9 |
2.0 |
10 |
2.9 |
|
|
Anaemia of unknown origin |
1 |
0.2 |
19 |
5.6 |
|
|
Trypanosomiasis (incl. suspected) |
4 |
0.9 |
10 |
2.9 |
|
|
Foot-and-mouth disease |
9 |
2.0 |
1 |
0.3 |
|
|
Omphalophlebitis/navel ill |
8 |
1.8 |
0 |
|
|
|
Diarrhoea of unknown origin |
3 |
0.7 |
4 |
1.2 |
|
|
Pyelonephritis/cystitis |
3 |
0.7 |
2 |
0.6 |
|
|
Hepatitis |
0 |
|
3 |
0.9 |
|
|
Septicaemia |
2 |
0.4 |
0 |
|
|
|
Meningoencephalitis/malacia |
2 |
0.4 |
0 |
|
|
|
Parasitic otitis |
1 |
0.2 |
1 |
0.3 |
|
|
Dermatitis |
1 |
0.2 |
0 |
|
|
|
Jaundice of unknown origin |
1 |
0.2 |
0 |
|
|
|
Generalised pyaemia |
0 |
|
1 |
0.3 |
|
|
Blackquarter |
0 |
|
1 |
0.3 |
|
|
Acetonaemia |
0 |
|
1 |
0.3 |
|
|
Bloat |
0 |
|
2 |
0.6 |
|
|
Intestinal volvulus |
0 |
|
1 |
0.3 |
|
|
Killed by predators |
197 |
43.6 |
67 |
19.6 |
|
|
Plant poisoning |
2 |
0.4 |
30 |
8.8 |
|
|
Snake bite |
17 |
3.8 |
29 |
8.5 |
|
|
Starvation |
38 |
8.4 |
0 |
|
|
|
Trampled, killed by bulls, drowned |
40 |
8.8 |
12 |
3.5 |
|
|
Dystokia |
0 |
|
12 |
3.5 |
|
|
Prolapse of uterus |
0 |
|
7 |
2.1 |
|
|
Ruptured uterus |
0 |
|
4 |
1.2 |
|
|
Ruptured liver, spleen, kidney, abomasum |
3 |
0.7 |
8 |
0.3 |
|
|
Toxaphene poisoning |
1 |
0.2 |
0 |
|
|
|
Inconclusive |
12 |
2.7 |
29 |
8.5 |
|
|
Total |
452 |
|
341 |
|
|
|
Summary |
|||||
|
|
Infectious disease |
142 |
31.4 |
139 |
40.8 |
|
|
Predators |
197 |
43.6 |
67 |
19.6 |
|
|
Accident |
44a |
9.7 |
47b |
13.8 |
|
|
Starvation |
38 |
8.4 |
0 |
|
|
|
Snake bite |
17 |
3.8 |
29 |
8.5 |
|
|
Plant poisoning |
2 |
0.4 |
30 |
8.8 |
|
|
Inconclusive |
12 |
2.7 |
29 |
8.5 |
a Includes organ rupture and Toxaphene poisoning.
b Includes organ rupture and dystokia.
Weights at birth and 8 months were available for 16275 calves, at 36 months for 2252 heifers, at 45 months for 2435 steers and at 9 years for 564 breeding cows.
The mean birthweight, 8-month weaning weight, and pre-weaning growth rate for calves born from 1973 to 1981 were 24.9 ± 0.04 kg, 133.5 ± 0.23 kg and 453.8 ± 0.92 g per day respectively, with coefficients of variation of 16.3%, 18.0% and 21.5% respectively.
The mean 36-month weight and post-weaning growth rate for heifers born from 1974 to 1978 were 216.0 ± 0.67 kg and 161.1 ± 0.082 g per day respectively, with coefficients of variation of 11.4% and 22.4% respectively. The mean 45-month weight and post-weaning growth rate for steers born from 1973 to 1978 were 337.6 ± 0.82 kg and 181.1 ± 0.71 g per day respectively, with coefficients of variation of 10.7% and 17.6% respectively.
The mean weight of cows, weighed approximately 10 months after their previous calf had been weaned, being an average of 9 years of age, was 286 ± 1.3 kg, with a coefficient of variation of 10%.
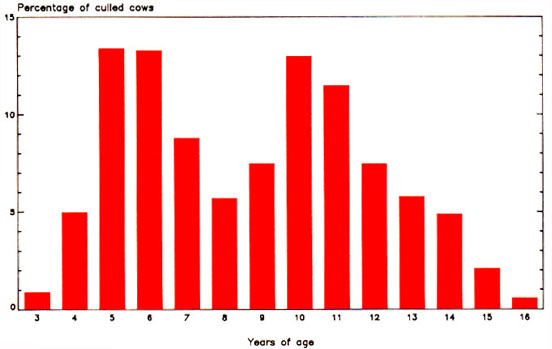
Figure 19. Distribution of cow culling ages, Mkwaja Ranch, 1973-82.
The mean cow productivity (weight of weaner calf per cow per year) based on 11999 records from 1973 to 1981 was 101.9 ± 0.47 kg, with a coefficient of variation of 44.9%. An estimate for mature cow weight of 293 kg, combined with the productivity of 101.9 kg of weaner calf per cow per year, resulted in a productivity of 161.2 kg of weaner calf per 100 kg metabolic weight of cow per year.
Adjustment of the two productivity indices to account for cow viability (94.2%) gave the most accurate estimates for overall herd productivity achieved. These were 96.0 kg of 8-month old calf per cow per year, and 151.9 kg of 8-month old calf per 100 kg0.73 of cow per year.
The mean breeding cow culling rate based on 45852 annual cow records from 1973 to 1982 was 12.8 ± 1.0% with a coefficient of variation of 23%. The average age at culling, based on 884 available records was 9.2 ± 0.1 years with a coefficient of variation of 34.0%. Major peaks occurred at 5-6 years and at 1011 years (Figure 19). The annual cow replacement rate was therefore 18.7% covering both culls and deaths.
Reproductive performance and viability are traits of outstanding importance in beef cattle enterprises Possible genetic improvement in virtually all traits of economic importance is closely tied to them.
The annual cow replacement rate of 18.7% at Mkwaja indicated an average of 5.3 years in the breeding herd. Thus with a calving interval of 15.9 months, five calves would be produced by each cow in its lifetime.
An appropriate definition of mortality rate in the context of genetic progress is the percentage of females that die before calving. By adding a post-weaning mortality rate of 4% (unpublished data) to the pre-weaning mortality, this percentage was approximately 12%. The rearing proportion is the proportion of births that produced a heifer that survived and was fertile. The rearing proportion at Mkwaja was 0.44. This means that once in 2.27 carvings a cow produced a heifer calf that could in turn calve in the herd. The average length of reproductive life was five carvings; therefore, approximately 45% of the females born were required as replacements to maintain herd size.
Genetic improvement per unit of time is more important than per animal generation. The average age at first calving was 47.0 months, and the average calving interval 15.9 months. To replace herself, a cow had to calve 2.27 times; thus, the average generation interval was 83.1 months or 6.9 years, which is within the normal reported range for tropical indigenous breeds.
Overall, the proportion of females required as replacements and the length of the generation interval would indicate considerable scope for implementation of selection programmes on growth traits. More stringent culling on reproductive performance could also well have relevance. The clinical and post-mortem findings indicated that the major problems that were not always effectively controlled were anaplasmosis, presumably transmitted by biting flies, salmonellosis in calves, plant poisoning and predators. Better control of these additional problems could make significant contributions to increased production.
![]()
![]()
![]()