![]()
![]()
![]()
Background
Data preparation
Data analyses
Ford and Blaser (1971) reported that chemoprophylaxis against bovine trypanosomiasis had then been in widespread use in tropical Africa for about 15 years and large quantities of drugs had been dispensed every year. Few attempts, however, had been made to assess the results of intensive treatments in large populations of cattle. They considered that the cattle records maintained at Mkwaja Ranch were probably unique in East Africa and while not attempting any analysis of these records, drew attention to their existence.
Skovlin and Williamson (1978) studied the sequence of plant succession following two decades of grazing and bush clearing at Mkwaja and concluded that the continuous grazing had reduced the fuel that formerly supported frequent fires, this leading to bush encroachment, this in turn encouraging a maintenance or increase in tsetse numbers.
In 1975, the ranch was selected as a test site for a tsetse fly control project by the United States Agency for International Development (USAID) and the Tanzanian Government (Williamson, 1975). The objective of this programme was to determine if a technique involving the application of insecticide and the release of sterilized male tsetse flies could be an effective method of control. As part of this operation, regular estimates of the apparent density of tsetse flies were carried out at Mkwaja from approximately mid-1976 to mid-1979, covering both treated and control areas of the ranch (Gates et al, 1983; Williamson et al, 1983; 1983a).
Two trials at Mkwaja on calf growth and viability reported at a preliminary stage by Blaser et al (1979) and in detail in Chapter 3, show conclusively that ranching is only possibly with the use of trypanocidal drugs.
Thus, over many years, considerable amounts of information on individual aspects of tsetse evaluation and control, trypanosomiasis infection, ecological succession and animal performance (Figure 16) have been recorded. There have been virtually no attempts however at linking either individual components of a particular subject (e.g. tying together the important performance traits of reproduction, growth, viability, etc. to determine overall productivity), or at linking vital aspects such as tsetse numbers, cattle trypanosomiasis infection rates, prophylaxis treatments, and subsequent animal productivity levels.
The broad aims of the large-scale study reported here include accurate evaluation of the overall productivity achieved under prophylaxis, followed by comparison both with cattle of similar genetic composition under no trypanosomiasis risk, and with dissimilar cattle genetically resistant to trypanosomiasis, kept under risk conditions without prophylaxis.
Specific aspects of the study are concerned with the influence of environmental effects such as an animal's geographical situation on the ranch, season and year involved, age of the animal or its dam, sex, prophylactic treatment, involvement of any additional therapeutic treatments, and the various interactions between these effects, on reproductive, viability, growth and productivity traits.
In the measurement of prophylactic and therapeutic treatment effects, the influence of geographical area, year, season, cow age etc. and their interactions on the number of treatments required, is investigated. The impact of number of treatments and their timing in relation to parturition is evaluated for the major performance traits.
The availability of data on apparent densities of tsetse over a 3-year period allows attempts to link tsetse density, level of trypanosomiasis infection diagnosed, number of prophylactic treatments required and ultimate animal productivity to be made. Any impact on cattle productivity traits of reduction of tsetse by insecticide application and the release of sterilized male tsetse flies, is investigated.
Finally, utilisation, through artificial insemination of semen from Boran bulls in Kenya, enables an evaluation of the influences on growth traits of progressive grading-up to pure Boran, and an examination of genotype-environment interaction effects to be made.
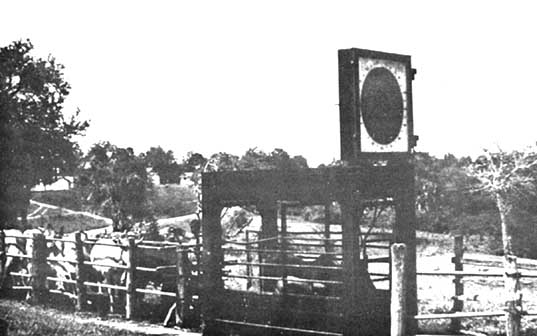
Figure 16. Weighing Boran cattle at Mkwaja Ranch.
It was considered desirable to attempt to cover a 10-year period, and in view of the tsetse recording work that had been carried out from mid-1976 to mid-1979, 31/2 years before and after these dates were added. The period chosen was thus 1 January 1973 to 31 December 1982.
Basic records were built up covering all production and health aspects of carvings taking place over the 9 years from 1 January 1973 to 31 December 1981. One record cabinet was found to have been invaded by termites, and all data cards in it reduced to dust. Complete records of 70% of the cows calving over this period were available.
Data extracted for each calving covered cow number, date of calving, dam number, sire number, date of birth, herd number, herd location on ranch at calving, calf number, calf sire number, calf sex, calf registration date and weight, calf weaning date and weight, date of calf pre-weaning death, calf bulling weight and date, or steer selling weight and date, date of cow's last Samorin treatment before calving, date of cow's last Berenil treatment before calving, cow's next calving date, dates of all cow's Samorin treatments between calving date and next calving date, dates of all cow's Berenil treatments between calving date and next calving date, and date of culling or death of cow.
Abortions had not been consistently recorded, therefore could not be included. Many weaning weights for calves weaned in 1980 were missing due to the loss of the relevant field record book.
Performance traits and chemoprophylactic treatments. From these data, the age at first calving, cow age at each calving, calving interval, calf weaning weight adjusted to 240 days, calf death, cow productivity (weight of 240-day calf per cow per year), numbers of Samorin and Berenil treatments over set periods, and intervals between various Samorin and Berenil treatments, were calculated as indicated below.
Seasons. From the monthly rainfall data in Table 5, calving dates were assigned to one of four seasons:
Dry 1: January to February
Long rains: March to May
Dry 2: June to September
Short rains: October to December
Cow age. Cows were assigned to one of four age groups at calving; 3-4 years, 5-6 years, 7-8 years, and 9 years or over.
Area and location of ranch. Animals were assigned to either northern or southern areas and locations N1 or N2 within the northern area and S3, S4 or S6 within the southern area, on the basis of herd geographical situation (Figure 11).
Number of Samorin treatments. Cows were assigned to one of four classes: one, two, three and four or more treatments between parturition and 8 months post-parturition.
Timing of Samorin treatments. Cows were assigned to one of four classes depending on the time of their first Samorin treatment relative to parturition date:
|
Shortly before parturition: |
Between 30 and 11 days prior to parturition |
|
At parturition |
10 days before to 10 days after parturition |
|
Shortly after parturition: |
Between 11 and 30 days after parturition |
|
Longer after parturition: |
Between 31 and 240 days after parturition. |
Berenil treatments. Cows were assigned to two classes depending on whether or not they received any Berenil treatment between parturition and 8 months post-parturition.
All information on cow reproductive performance, on calf viability, birthweight, weaning weight and pre-weaning growth, on heifer and steer post-weaning growth characters, on numbers of Samorin and Berenil treatments required by breeding cows over specific periods, and on an index of cow productivity, were analysed by least squares procedures (Harvey, 1977), using fixed models. Unequal and disproportionate subclass numbers gave unbalanced factorial designs for which conventional analyses of variance techniques were not applicable. Typical models used included the fixed effects of geographical situation on the ranch, season and year involved, age of cow or calf's dam, sex of the calf, number and timings of Samorin treatments over the relevant period, involvement of any additional Berenil treatment, and the various interactions between these effects. The specific factors included in the model used will be evident when the results are presented for each character analysed. The residual mean square was used as the error term to test the significance of all differences evaluated. Linear contrasts of least squares means were computed to determine the significance of differences between groups. More comparisons were made using the least squares means than there are independent degrees of freedom. Therefore, all of the comparisons are not independent, and the error rate over the entire set of comparisons may be different from that indicated by the level of probability. Tests of significance associated with the linear contrasts, although not independent, can be taken as guides as to whether the observed values could have occurred by chance.
It should be noted that in different sections of the report, productivity indices can refer to those actually achieved by the cattle population maintained on the ranch, or to least squares mean values, or to those calculated from component trait values.
![]()
![]()
![]()