![]()
![]()
![]()
Introduction
Comparison of northern and southern areas
Between 1976 and 1979 Mkwaja Ranch was the site of a major tsetse fly control project to determine if a technique involving the application of insecticide and the release of sterilised male tsetse flies could constitute an effective method of control (Tarimo et al, 1983; Williamson et al, 1983; 1983a). As part of this study, extensive tsetse surveys were carried out to obtain estimates of pretreatment fly densities and distribution and later to monitor the effectiveness of the insecticide application and the sterile male release programme.
The aims of this chapter are to use these data to examine any possible links between tsetse population estimates, diagnosis of trypanosomiasis, number of Samorin and Berenil treatments required, and resulting cattle performance, over the period from October 1976 to May 1979.
To obtain tsetse population data, 200 km of 'fly rounds' were established throughout the ranch. Collection teams consisting of three men, two carrying a 1.0 x 1.3 m black screen, traversed the fly rounds weekly, stopping every 200 m to capture all flies. A spot of oil paint was applied to the thorax of each fly prior to release. Capture-recapture data were analysed following the methods of Jolly (1965) and Seber (1965).
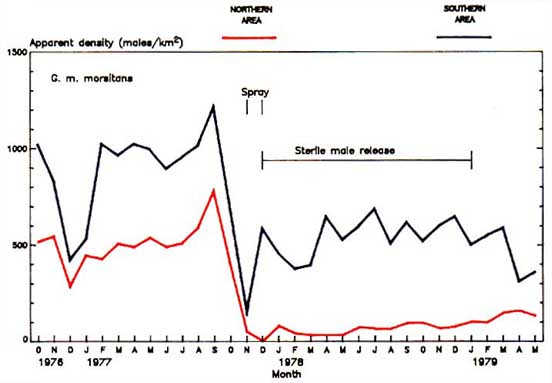
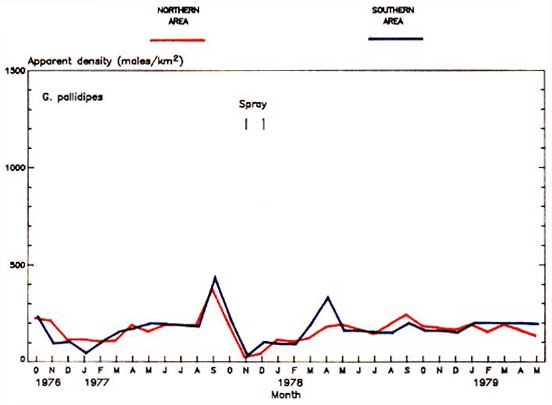
The objectives of the tsetse fly control project were first to reduce the tsetse population in the experimental part of the ranch by application of insecticide, and then to release sterile male G. m. morsitans in this area. The northern half of the ranch, encircled by the 1 km-wide fly barrier, served as the experimental area, and the southern half served as the untreated control. Of additional value was the presence of two Glossina species. The G. m. morsitans population in the north of the ranch was reduced initially by the use of insecticide and then the sterile males were released. The G. pallidipes population in the experimental area was reduced by the insecticide but no sterile males were released against them. Thus the impact of the insecticide plus sterile male release and insecticide only, could be evaluated. Two aerial applications (20 g/ha) of endosulphan, a non-residual insecticide, were made to the experimental area using a Cessna aircraft fitted with a rotary atomizer. The first application was made during the night of 3/4 November 1977. Due to the prevailing wind direction and an extension of the spray cut-off point beyond the experimental area, high tsetse mortality rates were recorded in both the northern (experimental) and southern (control) sections of the ranch. After the first endosulphan application, sterile male G. m. morsitans were released in the experimental area against the teneral females emerging from pupae which had been underground, and therefore protected from the endosulphan. The second spray was applied during the night of 1/2 December 1977, and was confined to the experimental area. Sterile male G. m. morsitans were then released from December 1977, twice weekly, at 120 release stations throughout the northern area. An average of 135 males/km: were released monthly until December 1978.
Table 27 presents the estimated tsetse densities, blood smear diagnosis, trypanocidal treatments required, and livestock performance during the pre-spray (October 1976 to October 1977) and post-spray (November 1977 to May 1979) periods for the northern and southern areas.
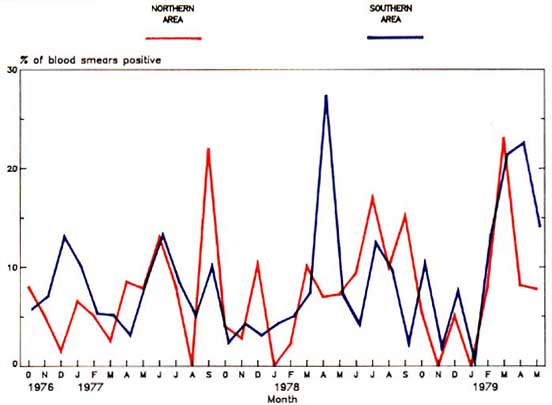
Figure 20 shows, on a monthly basis, the estimated densities of G. m. morsitans and G. pallidipes (Williamson et al, 1983; 1983a) and the results of blood smear diagnosis for the northern and southern areas from October 1976 to May 1979. Following the two endosulphan applications in November and December 1977, sterile male G. m. morstisans were released in the northern area of the ranch. Figure 20 shows the initial sharp reduction in the estimated density for this species in the northern area due to the insecticide, followed by a sustained reduction in the population to between 5 and 20% of the normal level (based on a pre-spray estimate) throughout 1978, the period of sterile male release. There is no clear indication in Figure 20 of any link between the reduction in G. m. morsitans in the northern area from December 1977 to May 1979 and any corresponding reduction in the percentage of blood smears found to be positive.
Table 27. Comparison of estimated tsetse densities, blood smear diagnosis, trypanocidal treatments required and resultant livestock performance in northern and southern areas of Mkwaja Ranch, October 1976 to May 1979.
|
|
Northern area |
Southern area |
|||
|
Pre-spray |
Post-spray |
Pre-spray |
Post-spray |
||
|
Tsetse density |
|||||
|
|
G. m. morsitans |
||||
|
|
Mean estimated density (males/km2) |
513 ± 32 |
69 ± 8 |
918 ± 65 |
524 ± 31 |
|
|
Relative density (northern v southern) |
1.0 |
1.0 |
1.8 |
7.6 |
|
|
G. pallidipes |
||||
|
|
Mean estimated density (males/km2) |
184 ± 21 |
158 ± 12 |
174 ± 28 |
163 ± 13 |
|
|
Relative density (northern v southern) |
1.0 |
1.0 |
0.9 |
1.0 |
|
Blood smear diagnosis |
|||||
|
|
Number of slides examined |
2193 |
2219 |
2280 |
2586 |
|
|
Number of trypanosome positive |
148 |
160 |
173 |
240 |
|
|
Percentage positive |
6.8 |
7.2 |
7.6 |
9.3 |
|
Trypanocidal treatments required |
|||||
|
|
Number of Samorin treatments required per 240 days |
2.5 |
3.1 |
3.3 |
3.6 |
|
|
Calculated Samorin treatment interval (days) |
96 |
77 |
73 |
67 |
|
|
Number of Samorin + Berenil treatments required per 240 days |
2.7 |
3.4 |
3.6 |
4.0 |
|
Calculated treatment interval (days) |
89 |
70 |
67 |
60 |
|
|
Resultant livestock performance |
|||||
|
|
Calving percentage |
73.4 |
72.2 |
69.1 |
64.4 |
|
|
Calf viability (%) |
89.2 |
86.5 |
93.8 |
87.9 |
|
|
Weaning weight (kg) |
129.6 |
115.9 |
129.5 |
107.6 |
|
|
Calculated productivity index (kg) |
84.8 |
72.4 |
83.9 |
60.9 |
Table 27 shows that in the southern control area the increase in positive blood smears in the post-spray compared to the pre-spray period was greater than in the northern treated area (7.6 to 9.3% compared with 6.8 to 7.2%). However, while the actual number of Samorin and Berenil treatments required was higher in the southern area, the increase in the post-spray compared to the pre-spray period was lower in the southern area than in the northern area (3.6 to 4.0 treatments per 240 days, compared with 2.7 to 3.4).
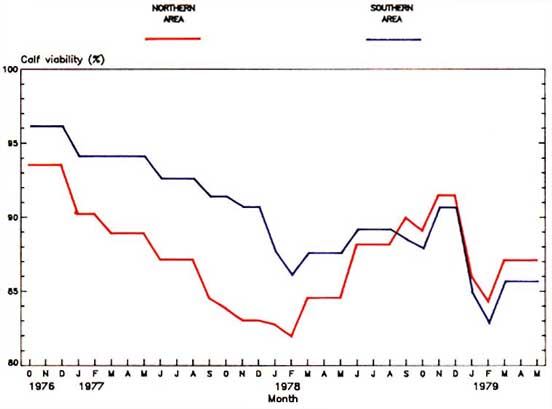
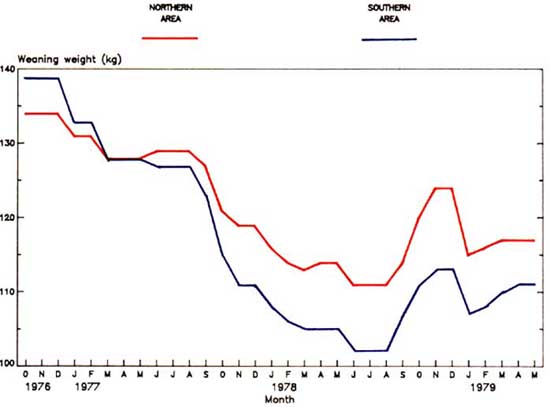
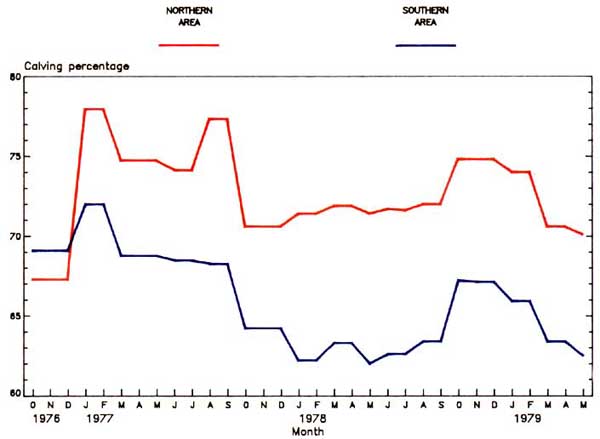
Figure 21 attempts to give the best estimates of the traits of calving percentage, calf viability and calf weaning weight, related to each month from October 1976 to May 1979, and a small positive relationship appeared to exist.
In the northern treated area (Table 27), the decrease in livestock performance in the postspray period compared to the pre-spray period was much less than in the southern control area (1.2% reduction in calving percentage compared to 4.7%; 2.7% reduction in calf viability compared to 5.9%; 13.7 kg reduction in weaning weight compared to 21.9 kg; and 12.4 kg reduction in calculated productivity index compared to 23 kg).
Figure 21. Monthly estimated performance trait values, Mkwaja Ranch, October 1976 to May 1979.
![]()
![]()
![]()