![]()
![]()
![]()
Introduction
Genotype effects on pre-weaning growth characters
Genotype x year of birth interaction effects on pre-weaning growth characters
Location effects on pre-weaning growth characters
Genotype x location interaction effects on pre-weaning growth characters
Genotype x year x location effects on pre-weaning growth characters
Conclusion
In Chapter 10, it is shown that the performance of Boran cattle at Mkwaja was inferior to Kenya Boran cattle under trypanosomiasis-free ranching conditions. It might be expected that this difference in performance is due largely to the different ecological and disease environments pertaining to Mkwaja and the areas of Kenya involved. However, it is of considerable value to try to determine if genetic differences between the two Boran populations are likely to have contributed significantly to the different productivity levels achieved.
Grading up of the original small East African Zebu to Boran has taken place at Mkwaja since 1958. The use of Boran semen from the Kenya National Artificial Insemination Centre over the 8 years from 1974 to 1981 allows comparison of birth, pre-weaning growth, and weaning weight data from 967 progeny of five Kenya A.I. stud bulls, with those from 7264 progeny of over 100 Mkwaja Boran bulls.
Table 28. Number of birth, pre-weaning growth and weaning weight records available from calves sired by Kenya and Mkwaja Boran bulls, Mkwaja Ranch, 1974-81.
|
Year of birth |
Kenya Boran |
Mkwaja Boran |
% Kenya Boran |
|
1974 |
88 |
981 |
8.2 |
|
1975 |
47 |
1017 |
4.4 |
|
1976 |
52 |
1106 |
4.5 |
|
1977 |
82 |
769 |
9.6 |
|
1978 |
253 |
561 |
31.1 |
|
1979 |
105 |
422 |
19.9 |
|
1980 |
178 |
1162 |
13.3 |
|
1981 |
162 |
1246 |
11.5 |
|
Total |
967 |
7246 |
11.7 |
Artificial insemination was carried out at two locations, and Table 28 shows the number of records of birth, pre-weaning growth and weaning weight available from Kenya Boran-sired calves from 1974 to 1981, together with their contemporaries sired by Mkwaja Boran bulls.
In the least squares analysis, the effects fitted to the pre-weaning growth data were genotype (sired by Kenya or Mkwaja bulls), individual Kenya Boran sire, location, year of birth, season of birth, age of dam, sex, number and timing of dam's prophylactic treatment and various interactions between these. The significance of the effects on birthweight, pre-weaning growth and weaning weight is shown in Table 29.
The estimated least squares means for genotype are given in Table 30.
Table 29. Mean squares for pre-weaning growth characters, Mkwaja Ranch, 1974-81.
|
Source |
df |
Birth weight |
Pre-weaning growth |
Weaning weight |
|
(kg x 10) |
(g/day x 10-2) |
(kg) |
||
|
Genotype (A) |
1 |
1255** |
464* |
3931** |
|
Location (B) |
1 |
2158** |
9140** |
59787** |
|
Year of birth (C) |
7 |
848** |
3122** |
19208** |
|
Season of birth (D) |
2 |
1470** |
524** |
4344** |
|
Age of dam (E) |
3 |
645** |
776** |
5407** |
|
Sex |
1 |
36913** |
18104** |
147231** |
|
No. of dam Samorin treatments (F) |
3 |
660** |
351* |
1715* |
|
Timing of first dam Samorin treatment (G) |
3 |
732** |
54 |
77 |
|
Dam Berenil treatment (H) |
1 |
36 |
426* |
2609* |
|
Sire within genotype 1a |
4 |
297 |
71 |
529 |
|
A x B |
1 |
69 |
1056** |
6535** |
|
A x C |
7 |
1721** |
271** |
1790** |
|
B x C |
7 |
3372** |
2168** |
13889** |
|
B x D |
2 |
468* |
1056** |
5159** |
|
B x F |
3 |
477* |
179 |
1021 |
|
B x G |
3 |
1104** |
47 |
405 |
|
B x H |
1 |
2814** |
529* |
5151** |
|
C x D |
10 |
958** |
1186** |
7256** |
|
E x F |
9 |
428** |
224* |
1333* |
|
E x H |
3 |
415* |
664** |
4239** |
|
F x H |
3 |
1797** |
1025** |
6952** |
|
G x H |
3 |
589** |
159 |
831 |
|
Residual |
8152 |
154 |
95 |
568 |
a Genotype 1 = Sired by Kenya Boran semen
b 8 months
* = P < 0.05
* * = p < 0.01
The progeny of Kenya Boran sires were superior to those of Mkwaja Boran sires by 0.8 kg, 16 g and 4.6 kg for birthweight, pre-weaning growth per day and weaning weight respectively, in each case this superiority being by 3.3%.
Table 30. Genotype effects on pre-weaning growth characters, Mkwaja Ranch, 1974-81.
|
Trait |
Progeny of |
Superiority of Kenya Boran progeny |
||
|
Kenya Boran bulls |
Mkwaja Boran bulls |
Units |
Percent |
|
|
Birthweight (kg) |
25.5 |
24.7 |
0.8** |
3.3 |
|
Pre-weaning growth (g/day) |
490 |
474 |
16* |
3.3 |
|
Weaning weight (kg) |
142.6 |
138.0 |
4.6** |
3.3 |
* = P < 0.05
** = P < 0.01
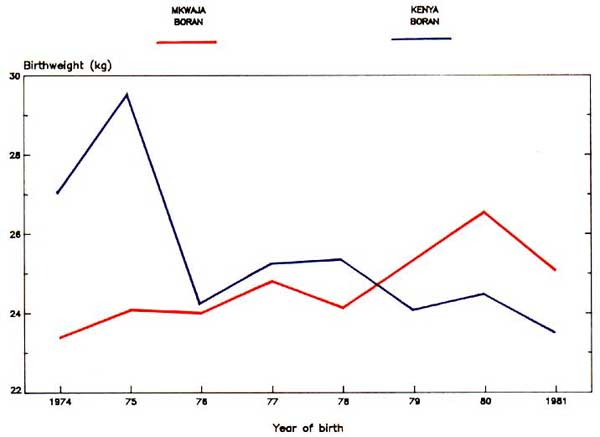
Genotype x year of birth interactions were significant for all three traits and the constants are presented in Table 31.
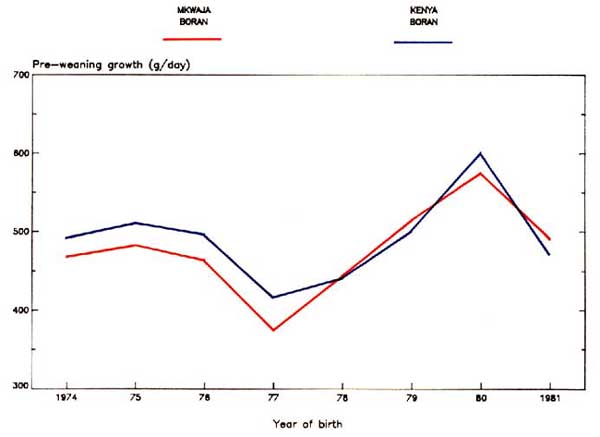
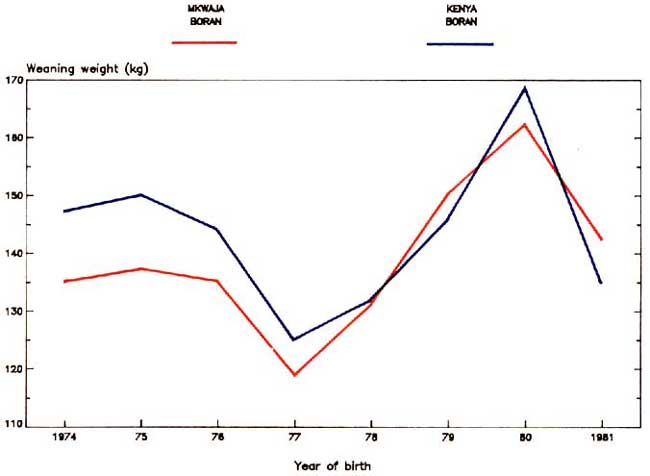
Figures 22, 23 and 24 illustrate that whereas the progeny of Kenya Boran sires were superior to those of Mkwaja Boran sires from 1974 to about 1978, from then onwards the two groups were very similar.
Table 31. Least squares constants for interaction between genotype and year for pre-weaning growth characters, Mkwaja Ranch, 1974-81.
|
Year |
Birthweight (kg) of progeny of |
Pre-weaning growth (g/day) of progeny of |
Weaning weight (kg) of progeny of |
|||
|
Kenya |
Mkwaja |
Kenya |
Mkwaja |
Kenya |
Mkwaja |
|
|
Boran |
Boran |
Boran |
Boran |
Boran |
Boran |
|
|
bulls |
bulls |
bulls |
bulls |
bulls |
bulls |
|
|
1974 |
1.5 |
-1.5 |
3 |
-3 |
2.1 |
-2.1 |
|
1975 |
2.1 |
-2.1 |
8 |
-8 |
3.9 |
-3.9 |
|
1976 |
-0.1 |
0.1 |
10 |
-10 |
2.2 |
-2.2 |
|
1977 |
-0.2 |
0.2 |
9 |
-9 |
2.1 |
-2.1 |
|
1978 |
0.2 |
-0.2 |
-6 |
6 |
-1.2 |
1.2 |
|
1979 |
-1.1 |
1.1 |
-13 |
13 |
-4.1 |
4.1 |
|
1980 |
-1.2 |
1.2 |
7 |
-7 |
0.5 |
-0.5 |
|
1981 |
-1.2 |
1.2 |
-18 |
18 |
-5.6 |
5.6 |
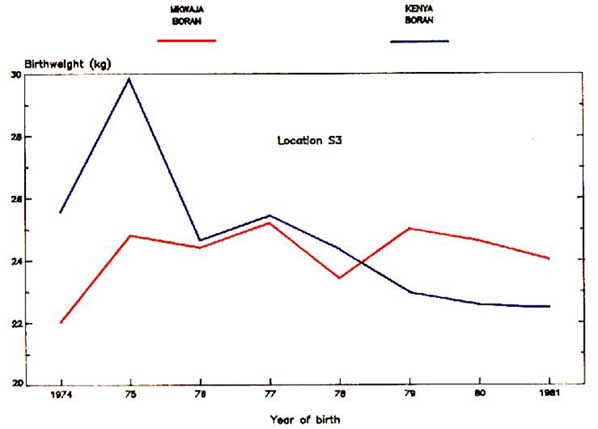
Figure 22. Birthweight of progeny of Mkwaja Boran and Kenya Boran bulls, 1974-81.
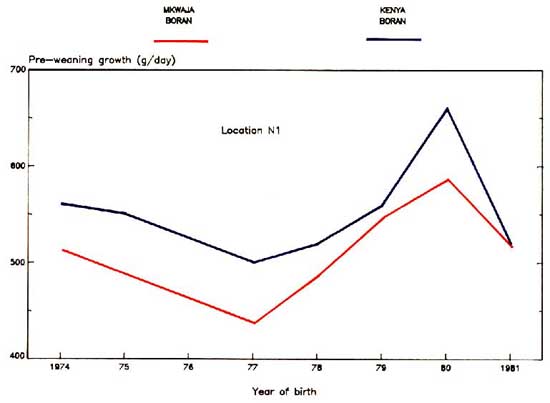
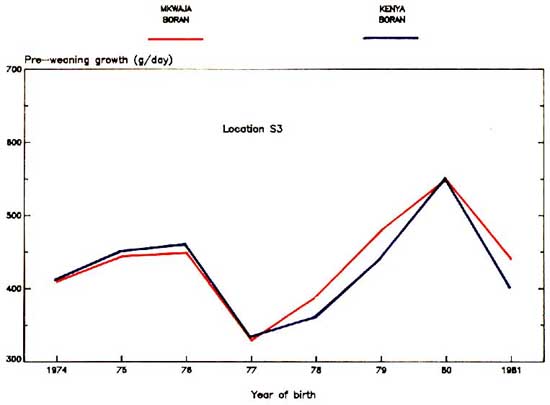
Figure 23. Pre-weaning growth of progeny of Mkwaja Boran and Kenya Boran bulls, 1974-81.
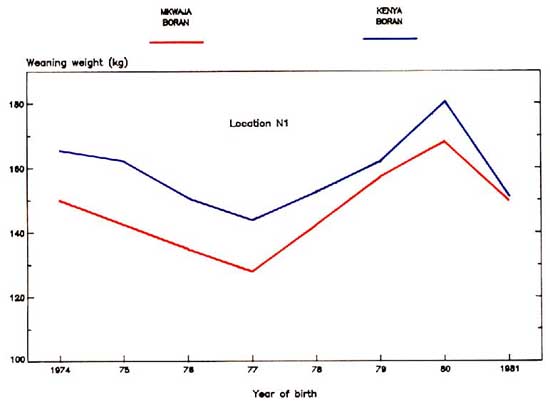
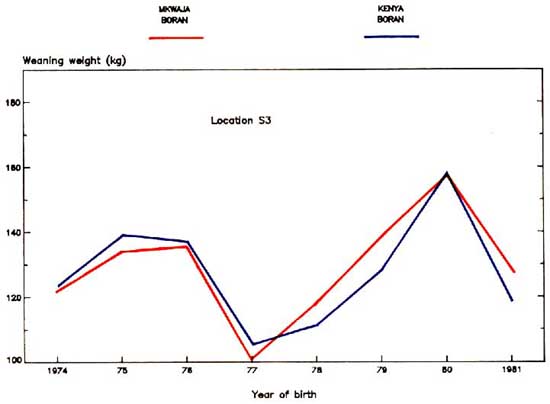
Figure 24. Weaning weight of progeny of Mkwaja Boran and Kenya Boran bulls, 1974-81
To determine any linear trends in birthweight, pre-weaning growth and weaning weight from 1974 to 1981, the regressions of the differences between genotypes on year of birth (represented as 1 to 8) were calculated (Table 32). The regressions were significant for all three traits and indicated that the initial superiority of the progeny sired by Kenya Boran bulls decreased by 0.9 kg per year for birthweight, by 5.5 g per day per year for pre-weaning growth and by 2.2 kg per year for weaning weight. This would suggest that as the percentage of pure Boran genes contributed to all calves from their dams increased from 1974 to 1981, and as the percentage of pure Boran genes from Mkwaja Boran bulls followed suit, so the relative effects of the pure Boran genes from the Kenya sires decreased.
Table 32. Regressions of differences between genotypes on year of birth, for pre-weaning growth characters, Mkwaja Ranch, 1974-81.
|
Trait |
b |
SEb |
|
Birthweight differences (kg) |
- 0.90 |
0.08 |
|
Pre-weaning growth differences (g/day) |
- 5.54 |
2.83 |
|
Weaning weight differences (kg) |
- 2.22 |
0.65 |
Comparisons of progeny sired by Kenya Boran and Mkwaja Boran were available at two locations: N1 and S3 (Figure 11). The estimated least squares means for locations are presented in Table 33.
Performances at location N1 were superior to those at location S3 by 1.4 kg for birthweight, 94 g per day for pre-weaning growth and 24.1 kg for weaning weight. These represented advantages of 5.9%, 21.7% and 18.8% respectively. The possible reasons for the much higher productivity achieved at all times at location N1 compared with all other locations have been discussed in Chapters 7 and 8.
Table 33. Location effects on pre-weaning growth characters, Mkwaja Ranch, 1974-81.
|
Trait |
Location |
Superiority of calves at location N1 |
||
|
N1 |
S3 |
Units |
Percent |
|
|
Birthweight (kg) |
25.8 |
24.4 |
1.4** |
5.9 |
|
Pre-weaning growth (g/day) |
529 |
435 |
94** |
21.7 |
|
Weaning weight (kg) |
152.4 |
128.3 |
24.1** |
18.8 |
** = P < 0.01
Genotype x location interactions were significant for pre-weaning growth and weaning weight, but not for birthweight. The constants are presented in Table 34.
Table 35 illustrates that whereas the progeny of Kenya Boran sires were superior to those of Mkwaja Boran sires for all three traits at location N1, there were no differences between the two genotypes at location S3. This would suggest that the overall superiority of the progeny of Kenya Boran sires (Table 30) could not be expressed in the harsher environment of location S3.
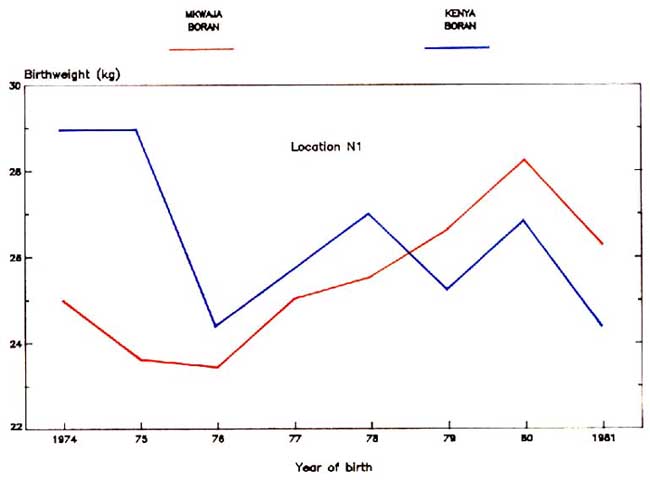
Figure 25 illustrates the birthweights of the two genotypes from 1974 to 1981 for each location. Birthweight differences between the two genotypes followed an almost identical pattern over the period in both the superior and harsher locations.
Figure 26 presents the differences between the two genotypes for pre-weaning growth from 1974 to 1981 for each location. The superior pre-weaning growth of progeny of Kenya Boran sires is clearly indicated at location N1, in all years until 1981. At the harsher location S3, however, a different situation exists and there are no significant differences between the two genotypes.
Figure 27 illustrates the differences between the two genotypes for weaning weight from 1974 to 1981 for each location. As would be expected, the weaning weight picture closely follows that of closely follows that of Pre-weaning growth, the last contributing 81% towards weaning weight.
Over the 8 years from 1974 to 1981 the calves with from 6 to 12% more Boran genes averaged 3.3% higher birthweights, Pre-weaning growth and weaning weights overall. From 1978 to 1981, when the difference in level of Boran genes between the two groups had fallen to about 8%, the performance levels were similar.
When performance was looked at separately in the improved and unimproved locations, while the birthweight picture remained the same, the higher grade Boran group had significantly higher growth rates and weaning weights throughout in the improved environment.
Table 34. Least squares constants for interaction between genotype and location for Pre-weaning growth characters Mkwaja Ranch, 1974-81.
|
Trait |
Genotypea |
Location |
||
|
N1 |
|
S3 |
||
|
Birthweight (kg)
|
K |
0.1 (793)b |
|
-0.1 (174) |
|
M |
-0.1 (3890) |
|
0.1 (3374) |
|
|
SE of interaction constant |
|
|
0.16 |
|
|
Interaction constant as % of m |
|
|
0.4 |
|
|
Pre-weaning growth (g/day)
|
K |
13 (793) |
|
-12 (174) |
|
M |
-13 (3890) |
|
13 (3374) |
|
|
SE of interaction constant |
|
|
3.9 |
|
|
Interaction constant as % of m |
|
|
2.7 |
|
|
Weaning weight (kg)
|
K |
3.2(793) |
|
-3.2(174) |
|
M |
-3.2 (3890) |
|
3.2 (3374) |
|
|
SE of interaction constant |
|
|
0.94 |
|
|
Interaction constant as % of m |
|
|
2.3 |
|
a Genotype K = Progeny of Kenya Boran bulls.
Genotype M = Progeny of Mkwaja Boran bulls.
b Numbers in parentheses are the numbers of animals in each sub-class.
Table 35. Genotype effects on Pre-weaning growth characters in locations N1 and S3, Mkwaja Ranch, 1974-81.
|
Trait |
Progeny of |
Superiority of |
|||
|
Kenya |
Mkwaja |
Kenya Boran |
|||
|
Boran |
Boran |
progeny |
|||
|
bulls |
bulls |
Units |
Percent |
||
|
Location N1 |
|||||
|
|
Birthweight (kg) |
26.4 |
25.3 |
1.0** |
4.1 |
|
|
Pre-weaning growth (g/day) |
549 |
508 |
42** |
8.2 |
|
|
Weaning weight (kg) |
157.9 |
146.9 |
11.0** |
7.5 |
|
Location S3 |
|||||
|
|
Birthweight (kg) |
24.7 |
24.1 |
0.6 |
2.5 |
|
|
Pre-weaning growth (g/day) |
430 |
439 |
-10 |
-2.3 |
|
|
Weaning weight (kg) |
127.4 |
129.2 |
-1.8 |
-1.4 |
** = P < 0.01
Thus the calves with higher levels of Boran genes (up to 82% Boran) were superior in the improved environment, but in the unimproved environment were not superior to calves that were 60% Boran. Grading up to high level Boran could therefore be advantageous in the areas where bush clearance and tsetse control are implemented, but would not be of value in the remainder of the ranch.
![]()
![]()
![]()