![]()
![]()
![]()
Comparison of Mkwaja Boran with Boran in Kenya
Comparison of Mkwaja Boran with N'Dama in west and central Africa
Conclusion
The performance levels achieved at Mkwaja have been evaluated in detail in Chapter 5. It is of considerable value to be able to compare these with other major ranching situations in Africa. There are very few data sets of comparable size and complexity available for this purpose, but two sets do exist. ILCA has collected information covering various performance traits from 11 Boran ranches in Kenya (Trail et al, in preparation) comprising around 16000 data per trait. Since the cattle at Mkwaja have been graded up to Kenya Boran over many years, a comparison between the two situations allows the impact of environmental differences to be quantified for animals of similar genotypes. The Kenya Boran ranches are located in tsetse-free areas, and a major environmental difference between them and Mkwaja is undoubtedly the high trypanosomiasis risk at Mkwaja.
A second data set, also compiled by ILCA (1979), has been built up from nine ranches carrying trypanotolerant N'Dama cattle in medium to high trypanosomiasis-risk situations in West and central Africa. This information covers important performance traits and contains approximately 4000 data per trait. Thus, in similar trypanosomiasis-risk situations, the performances of two dissimilar genotypes can be compared, one genotype possessing genetic resistance to trypanosomiasis, the other being maintained under a chemoprophylactic regime.
Productivity indices, built up from the important performance traits, on both an individual and a herd basis, are of value in comparing different livestock situations. When expressed on the basis of output per unit weight or per unit metabolic weight of cow per year, they permit comparisons between animals of different mature bodyweights. Clearly any comparison based simply on output per cow would tend to favour heavier individuals or breeds. Indices expressed in terms of metabolic bodyweight have the advantage of more accurately reflecting the differences in maintenance costs of cows of different bodyweights.
The objective of this chapter is to present the productivity levels achieved at Mkwaja in the widest possible context. By comparison with animals of similar genotype in trypanosomiasis-free situations in Kenya, the effects of the adverse cattle production environment at Mkwaja can be examined. Comparison with trypanotolerant N'Dama allows two contrasting approaches to cattle production in tsetse-infested areas to be evaluated.
Table 36 summarises the overall performance achieved by Boran cattle at Mkwaja and at the ranches in trypanosomiasis-free areas of Kenya.
Boran at Mkwaja were inferior in all performance traits to those in Kenya (Figure 28). Mkwaja Boran were approximately 3% inferior in viability traits, 16% inferior in reproductive performance, and 26% inferior in bodyweights. Calculated cow and herd productivity indices reflected these differences, with differences in productivity per cow between the two situations being relatively greater than differences per unit weight of cow or per unit metabolic weight of cow, due to the lower mature cow weights attained at Mkwaja. The herd productivity, which probably gives the most meaningful comparison, expressed as weight of 8-month-old weaner calf produced per 100 kg metabolic weight of cow per year, was 20% less for the Mkwaja Boran. However, in the most developed area of Mkwaja Ranch (NI), where considerable bush clearance and tsetse control had been carried out, the productivity levels were equal to the average of the Kenya ranches.
Table 36. Overall performance of Mkwaja Boran compared with Boran in Kenya under trypanosomiasis-free ranch management.
|
Trait |
Mkwaja Borana |
Kenya Boranb |
|
|
|
High trypanosomiasis risk. |
No trypanosomiasis risk. |
|||
|
Prophylaxis |
No prophylaxis |
|||
|
A |
B |
|||
|
Reproductive performance |
||||
|
|
Age at first calving (months) |
47.0 |
39.7 |
+ 18.4 |
|
|
Calving percentage |
75.3 |
87.0 |
- 13.4 |
|
Viability |
||||
|
|
Pre-weaning viability (%) |
92.0 |
94.6 |
- 2.7 |
|
|
Annual cow viability (%) |
94.2 |
(98.0) |
3.9 |
|
Bodyweights |
||||
|
|
Weaning weight at 8 months (kg) |
133.5 |
174.0 |
- 23.3 |
|
|
Estimated mature cow weight (kg) |
293 |
414 |
- 29.2 |
|
Calculated cow productivity |
||||
|
|
Productivityc per cow per year |
92.5 |
143.2 |
- 35.4 |
|
|
Productivity per 100 kg of cow per year |
31.6 |
34.6 |
- 8.7 |
|
|
Productivity per 100 kg0.73 of cow per year |
146.3 |
176.0 |
- 16.9 |
|
Calculated herd productivity |
||||
|
|
Productivity per cow per year |
87.1 |
140.3 |
- 37.9 |
|
|
Productivity per 100 kg of cow per year |
29.8 |
33.9 |
- 12.1 |
|
|
Productivity per 100 kg0.73 of cow per year |
137.8 |
172.5 |
-20.1 |
a From Mkwaja Ranch, approximately 12000 data per trait.
b From 11 ranches, approximately 16000 data per trait, constructed from Trail et al (in preparation).
c Productivity = Weight of 8-month-old weaner calf.
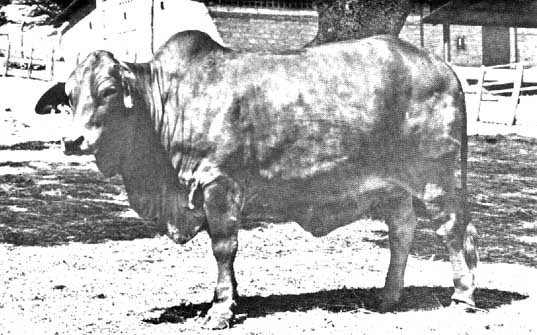
Figure 28. Boran cow in Kenya.
Reproduced with permission from the Journal of Infectious Diseases, the University of Chicago.
Table 37. Overall performance of Mkwaja Boran compared with trypanotolerant N'Dama in medium trypanosomiasis risk situations on West and central African ranches.
|
Trait |
Mkwaja Borana |
West Africa N'Damab |
|
|
|
High trypanosomiasis risk. |
Medium-high trypanosomiasis risk. |
|||
|
Prophylaxis |
No prophylaxis |
|||
|
A |
B |
|||
|
Reproductive performance |
||||
|
|
Age at first calving (months) |
47.0 |
NA |
NA |
|
|
Calving percentage |
75.3 |
72.2 |
+ 4.3 |
|
Viability |
||||
|
|
Pre-weaning viability (%) |
92.0 |
91.1 |
+ 1.0 |
|
|
Annual cow viability (%) |
94.2 |
98.0 |
- 3.9 |
|
Bodyweights |
||||
|
|
Weaning weight at 8 months (kg) |
133.5 |
90.4 |
+47.7 |
|
|
Estimated mature cow weight (kg) |
293 |
256 |
+14.5 |
|
Calculated cow productivity |
||||
|
|
Productivityc per cow per year |
92.5 |
59.5 |
+55.5 |
|
|
Productivity per 100 kg of cow per year |
31.6 |
23.2 |
+36.2 |
|
|
Productivity per 100 kg0.73 of cow per year |
146.3 |
103.9 |
+40.8 |
|
Calculated herd productivity |
||||
|
|
Productivity per cow per year |
87.1 |
58.3 |
+49.4 |
|
|
Productivity per 100 kg of cow per year |
29.8 |
22.7 |
+31.3 |
|
|
Productivity per 100 kg0.73 of cow per year |
137.8 |
101.8 |
+35.4 |
a From Mkwaja Ranch, approximately 12000 data per trait.
b From nine ranches, approximately 4000 data per trait, constructed from ILCA (1979).
c Productivity = Weight of 8-month-old weaner calf.
NA = Not available
Table 37 summarises the overall performance achieved by Boran cattle at Mkwaja and by trypanotolerant N'Dama cattle on ranches in West and central Africa (Figure 29).
Data were not available from N'Dama cattle for age at first calving, but for all other traits, except cow viability, performances of Mkwaja Boran were superior to those of trypanotolerant cattle in West Africa. Major differences in bodyweights were evident between the two situations. Comparisons of productivity indices reflected this, the superiority of the Mkwaja Boran being less on the basis of unit weight or unit metabolic weight of cow than on a per cow basis. Herd productivity, expressed as weight of 8-month-old weaner calf produced per 100 kg metabolic weight of cow per year, was 35% higher for the Mkwaja Boran than for the trypanotolerant N'Dama.
The data sets compared in this chapter are among the largest available in Africa on beef cattle production. Based on the weight of weaner calf produced per unit metabolic weight of cow per year, the productivity levels of the grade Boran cattle maintained under chemoprophylaxis at Mkwaja fall between those achieved by Boran in the trypanosomiasis-free ranches in Kenya (20% less) and those achieved by N'Dama in medium to high trypanosomiasis-risk areas of West and central Africa (35% more).
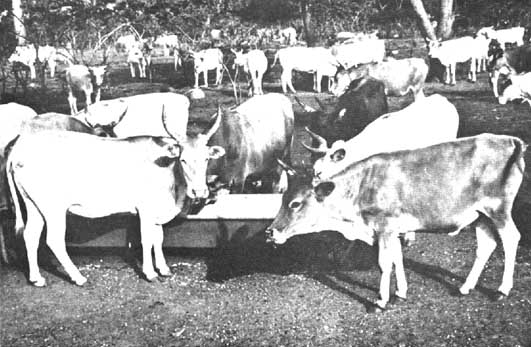
Figure 29. N'Dama cattle in Nigeria.
![]()
![]()
![]()
