![]()
![]()
![]()
3.5.1 Small pelagic fish
3.5.2 Demersal resources
Introduction
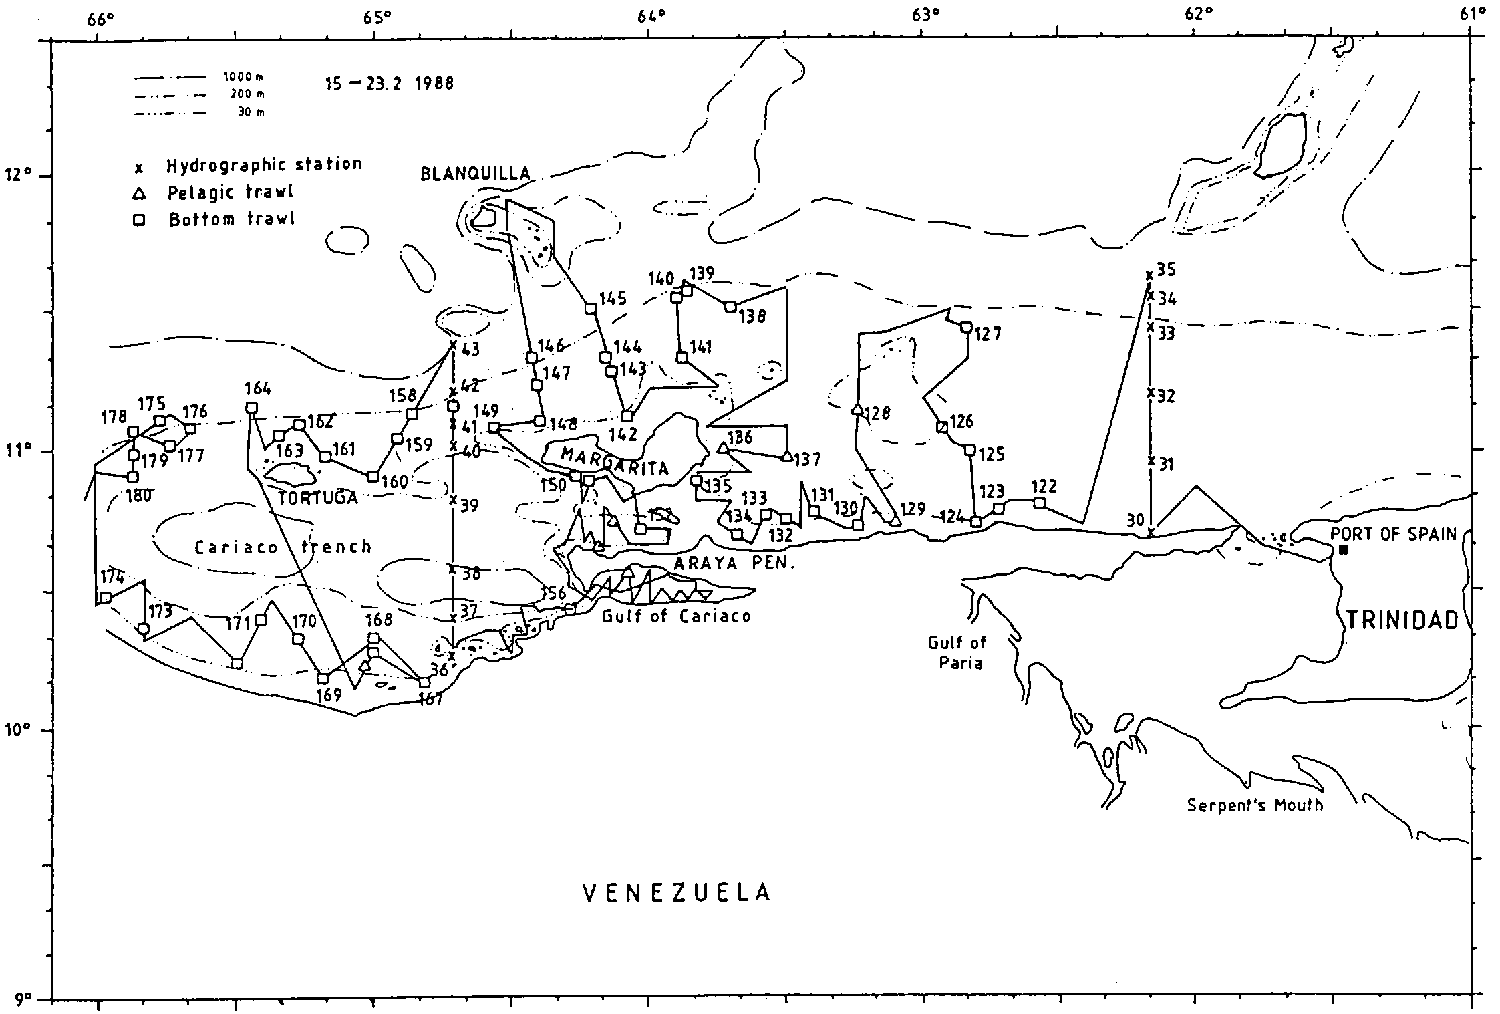
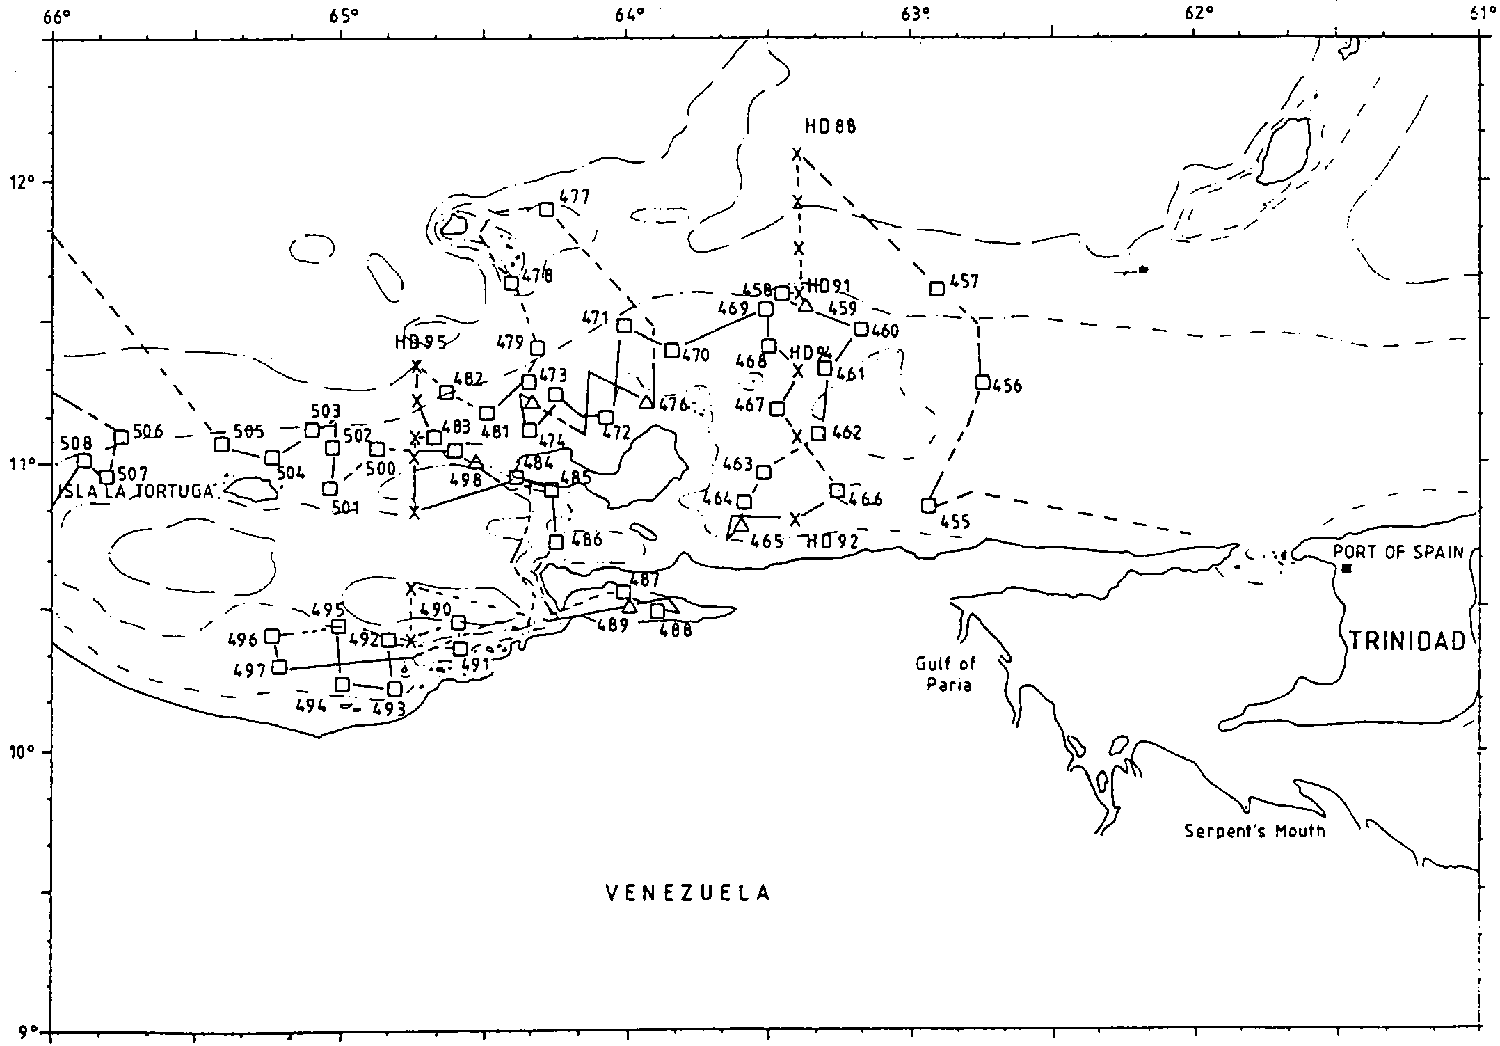
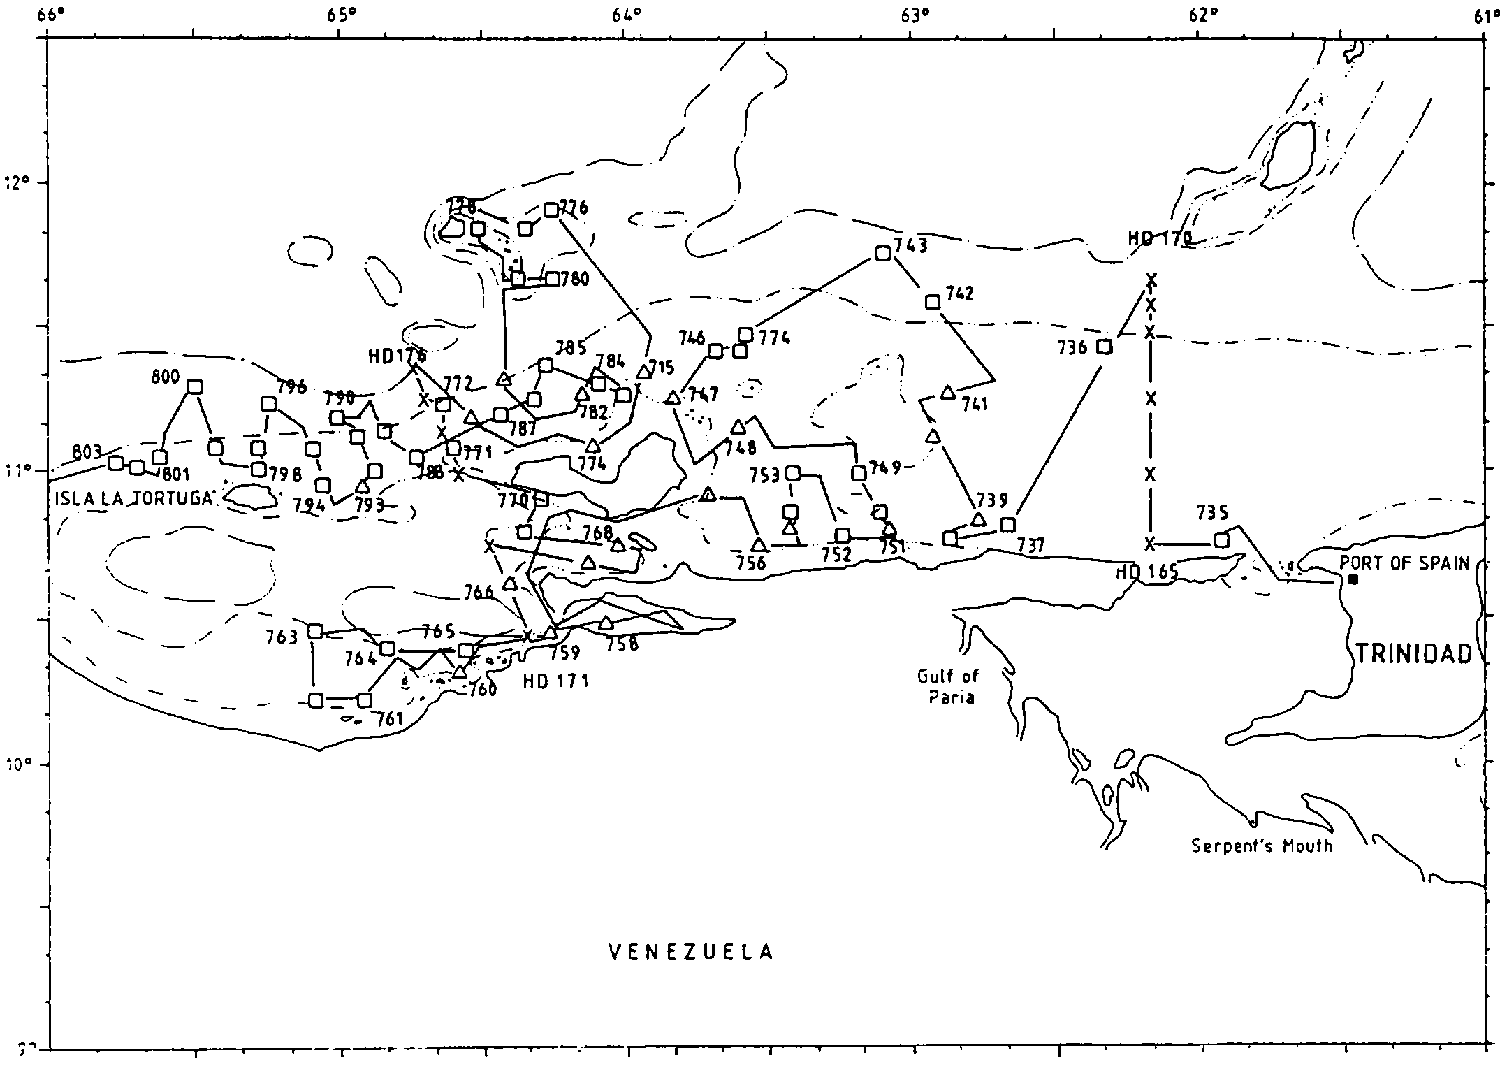
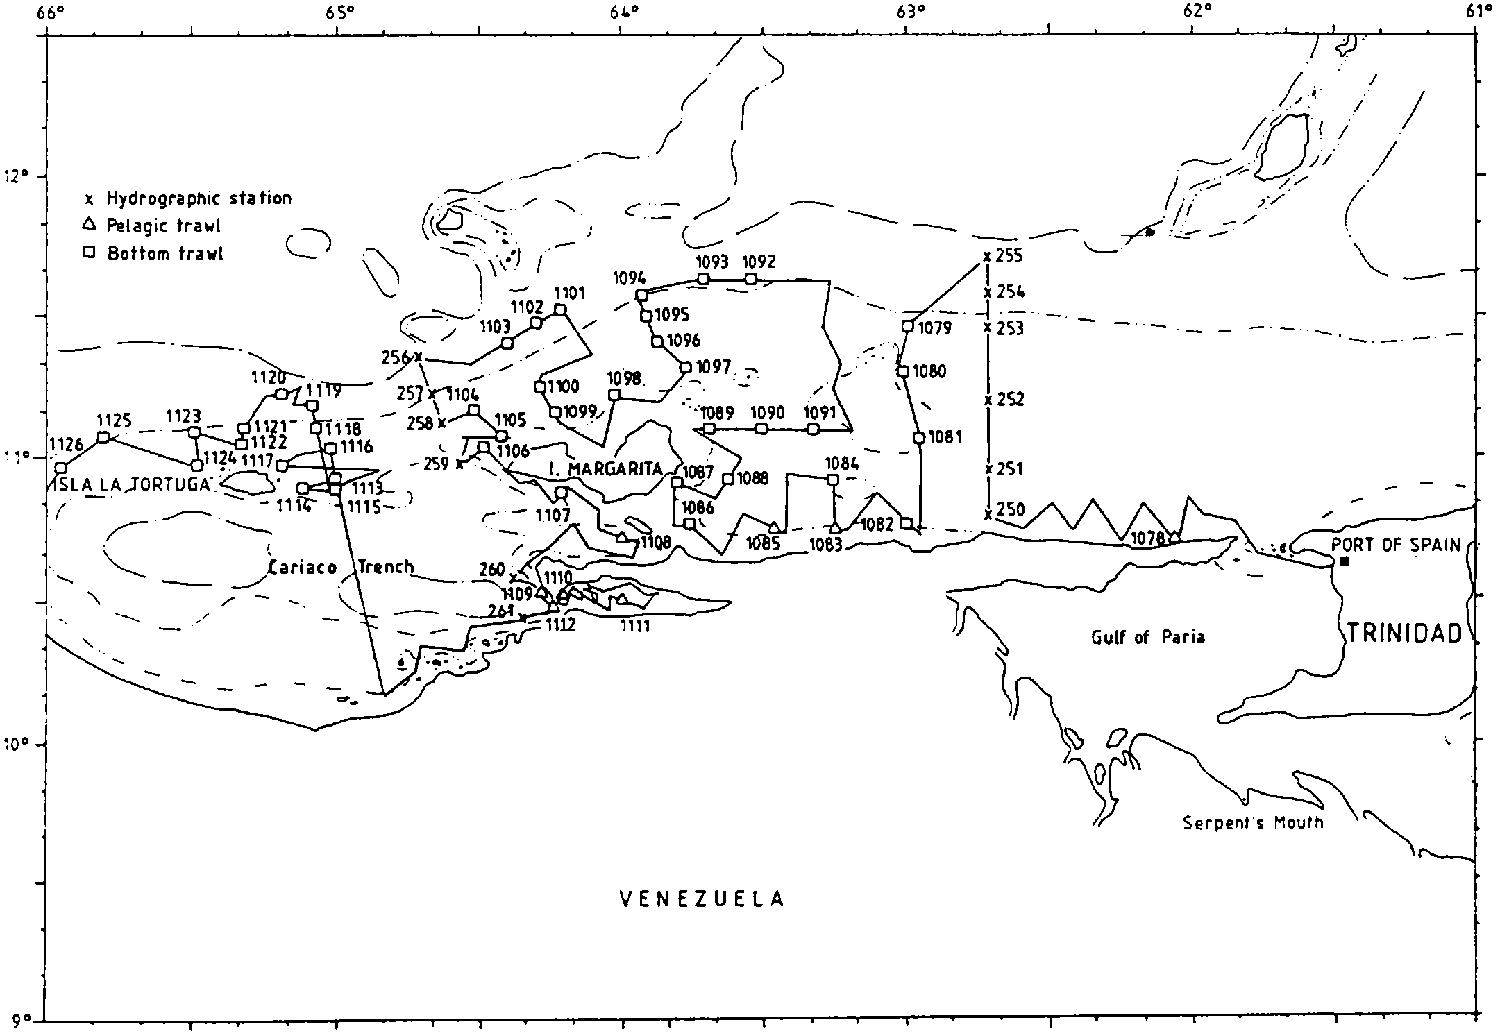
As shown in Figure 3.5.1 this area was covered extensively in all four surveys. In the discussions of survey objectives the offshore shelf to the east of the Testigos Islands and the nearshore shelf inside the Cariaco Trench were assigned a low priority and this is reflected in the distribution of the survey effort. The separate small shelf east of the Blanquilla Island was to be included in the survey, but the area was only inadequately covered since conditions for trawling were not favourable and little pelagic fish was recorded.
In the analysis of the fishing experiments a distinction has been made between the data from the inner part of the shelf, inside the Testigos Archipelago and the Margarita Island and the coastal side of the Cariaco Trench and those from the outer part, outside the islands and westwards past the Tortuga Island. The rough difference in the fish assemblages of these two parts is that the inner shelf is dominated by small pelagic fish, sardines and anchovies with catfish and croakers as the most common demersal fish, while the pelagic fish of the outer part is characterized by horse mackerel and mackerel and with snappers and grunts with some breams, groupers and glasseyes as demersal groups. Some hauls were made at various depths along the outer slope where bottom conditions permitted to test the availability of deep sea shrimps and cephalopods. The total effort in terms of successful hauls with bottom and pelagic trawl were:
|
Inner shelf |
88 |
|
Outer shelf |
109 |
|
Slope |
20 |
|
Blanquilla |
6 |
Distribution
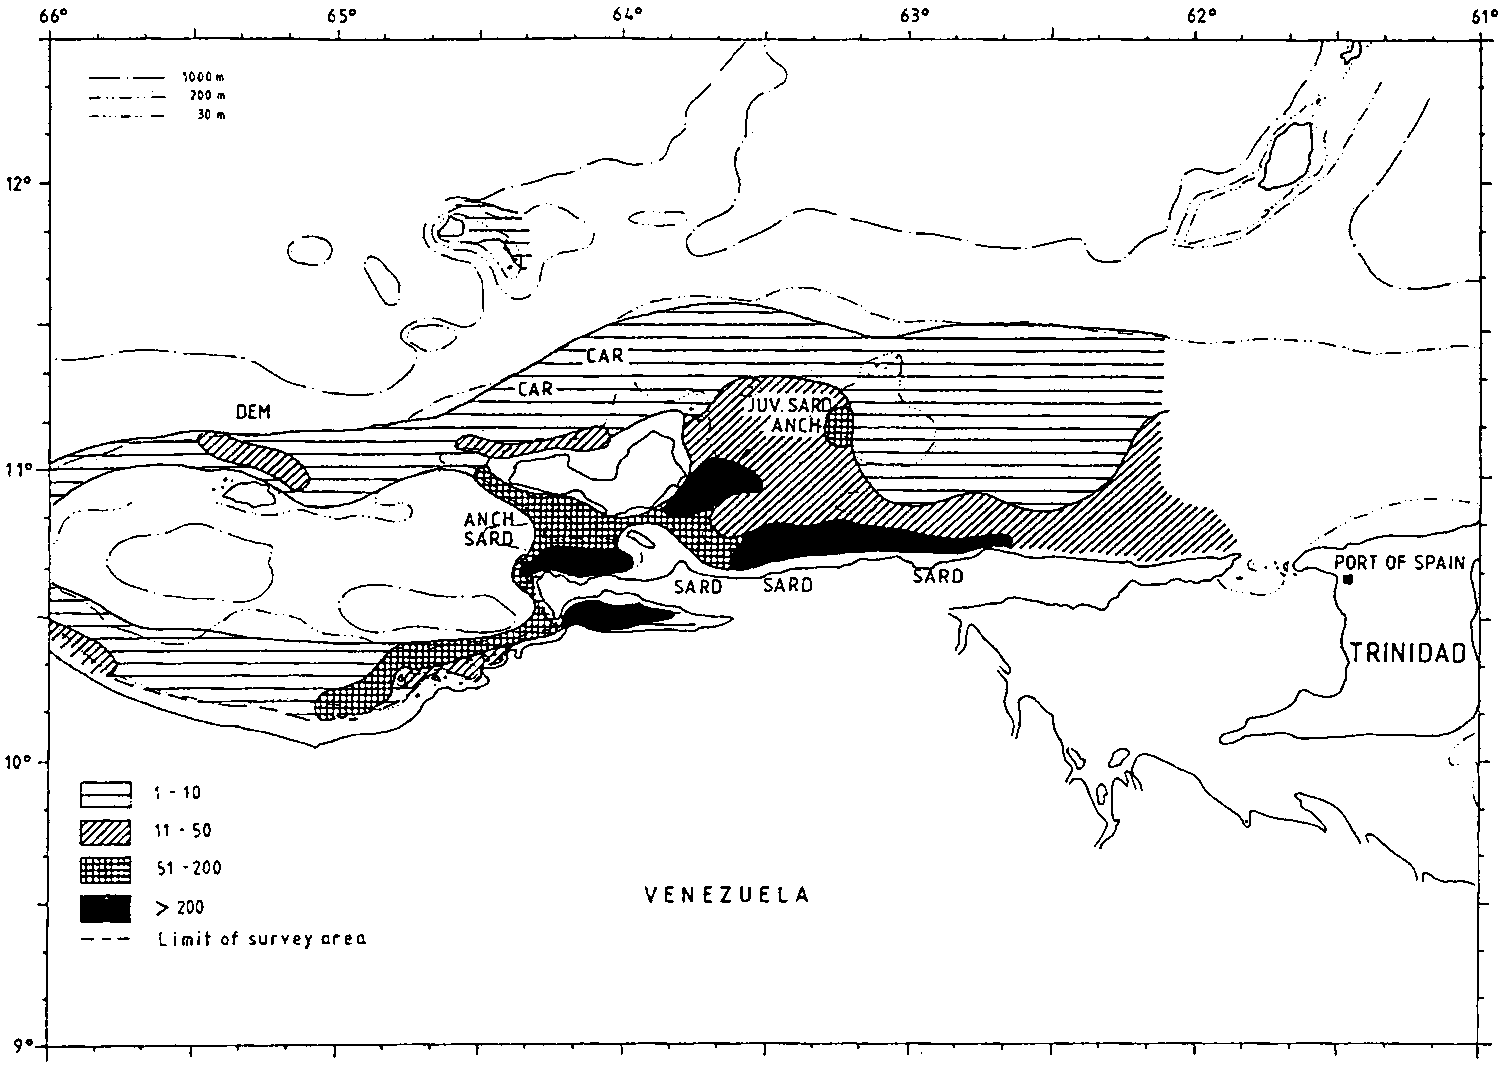
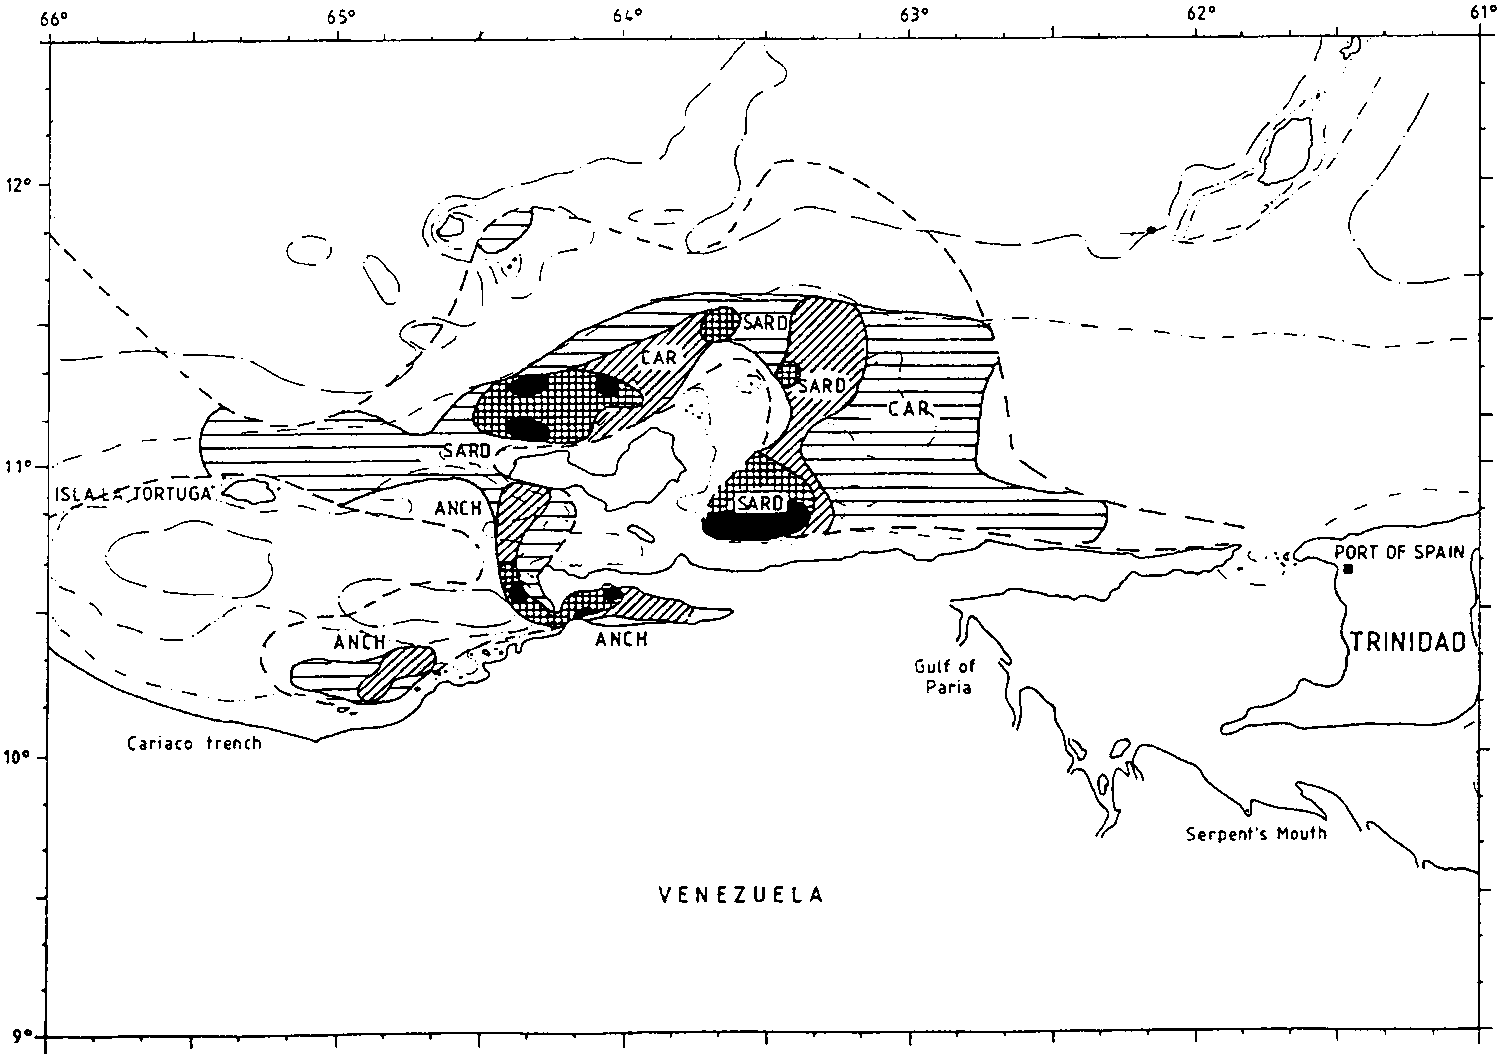
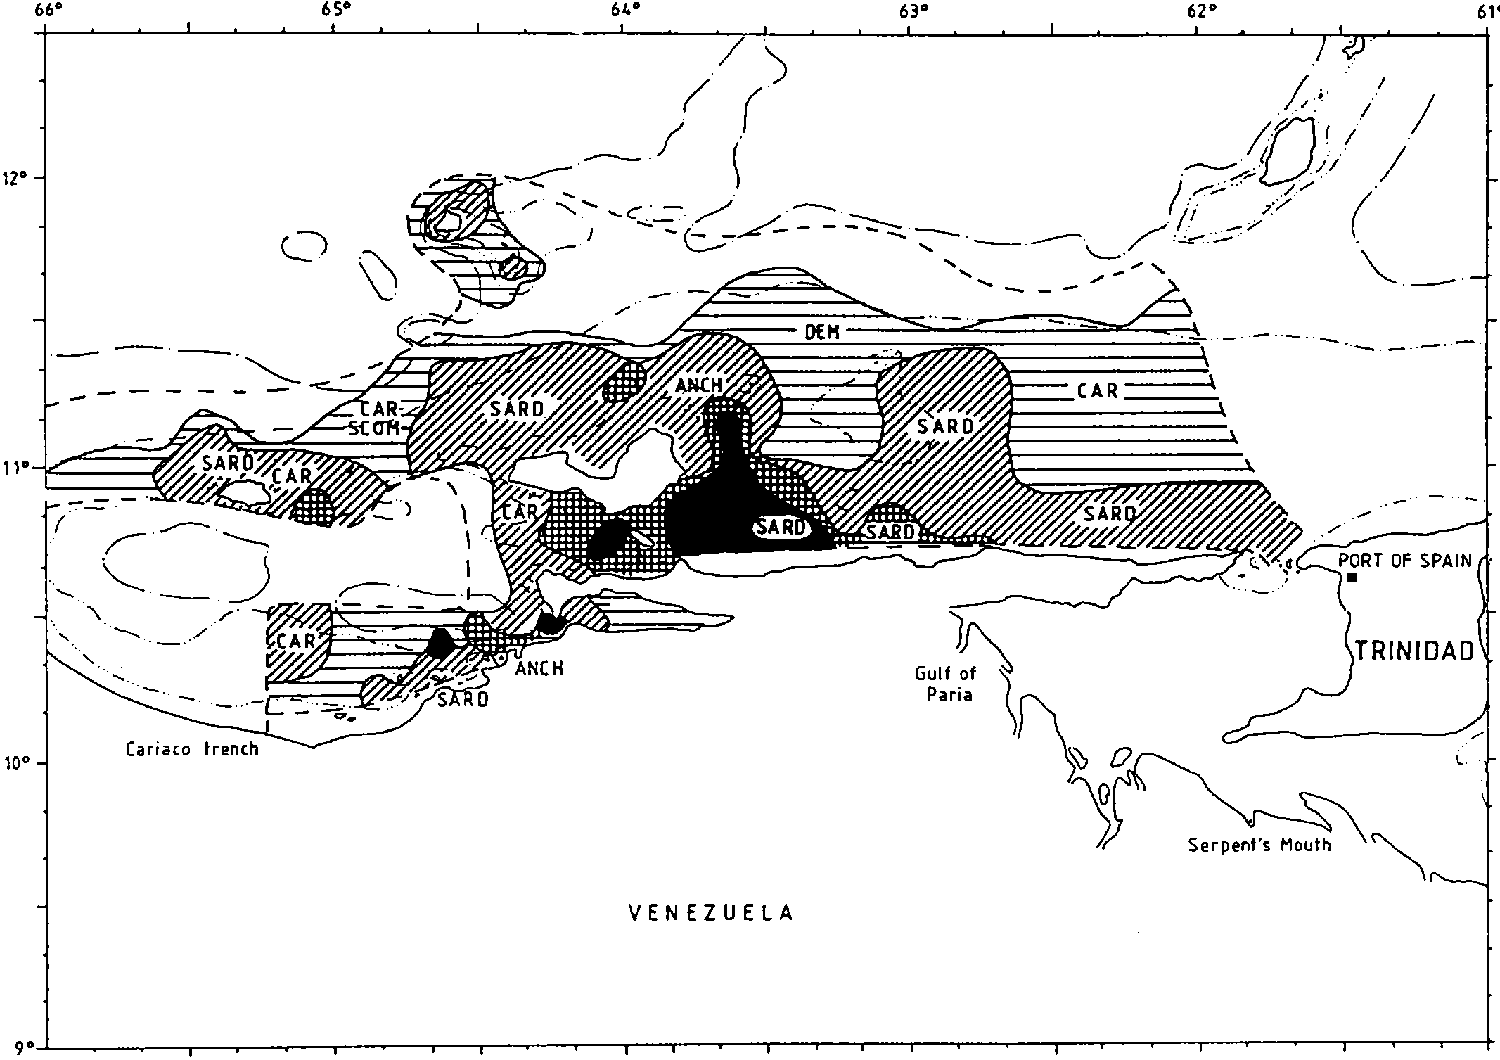
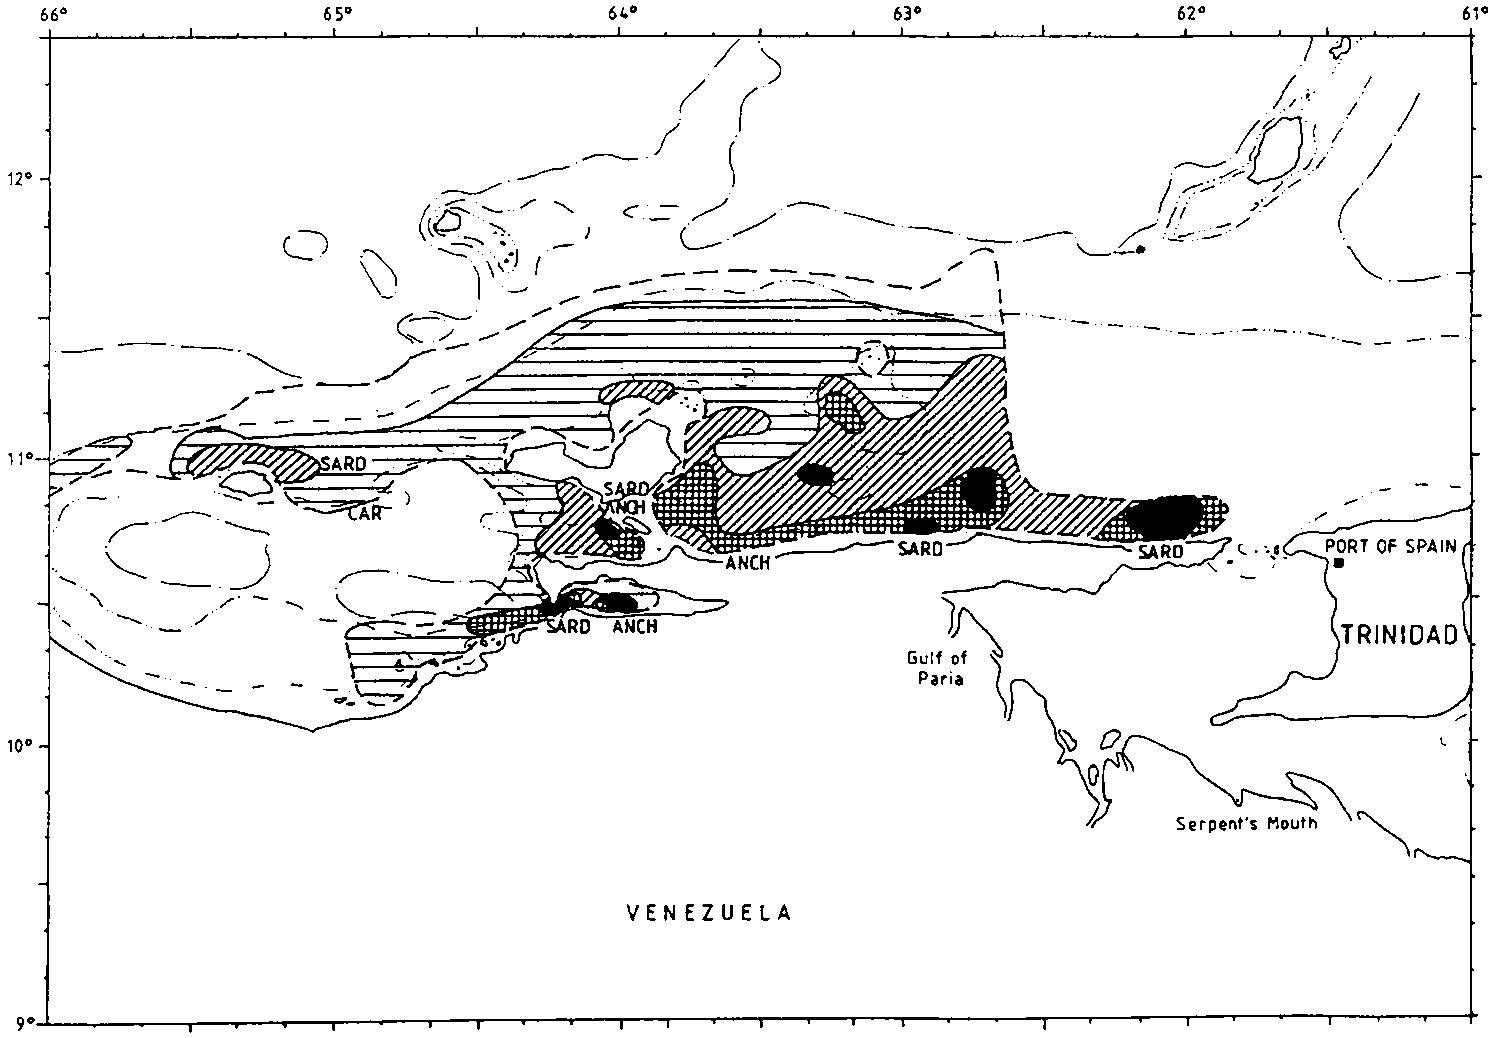
Figure 3.5.2 shows the distribution of pelagic fish as observed by the acoustic system. The choice of levels of density used is arbitrary, but tend to follow a geometrical scale. The highest densities represent areas with dense often large schools. Large size sardinella has a low catchability, but some successful sampling was made in the dense school areas which together with knowledge of the schooling behaviour of sardinella forms the basis for concluding that these aggregations largely consisted of this species.
Figure 3.5.1. Venezuela, Oriente. Course tracks and fishing stations, by surveys.
Figure 3.5.2. Venezuela, Oriente. Fish distribution as registered by the acoustic system, by surveys.
The geographical distribution of these school areas of sardinella, as shown in the figure, conforms with previous findings from sardine surveys of the Oriente and with the general information from the fishery. High densities were observed in a narrow inshore zone from the Dragon’s Mouths westwards past Cabo Tres Puntas towards the Margarita Island, in the bay outside Araya Peninsula and in the Gulf of Cariaco, especially its western part and the entrance. There is a general tendency for the areas of high fish density to be located inshore in the cool upwelled water masses. A seasonal migration along the coast is indicated with an easternmost location in November, some shift westwards in February, the westernmost distribution in May-June and the start of a shift towards the east in August-September. This could be related to a spawning and reproduction cycle which include a westwards drift of larvae and a larval and early juvenile stage adjusted to the season of high rates of upwelling and production. There was a tendency for younger stages of sardines to be found over the middle and outer part of the shelf especially in surveys 2 and 3 together with round herring Etrumeus teres and various carangids, especially rough scad Trachurus lathami. But in general the acoustic observations showed only low levels of fish densities in the offshore parts.
Catch compositions
Pelagic types offish often formed substantial parts of the catches in the hauls made with bottom trawl for swept area estimates and otherwise fishing for identification and sampling of pelagic types of fish was made both with demersal and mid water trawls. These data can add to our picture of the general occurrence and composition of the various groups and species, but they must be interpreted with caution. The catchability of these gears are often highly species and size selective, some clupeids such as large sized schooling sardinella and thread herrings has for instance a low catchability while anchovy, smaller carangids such as bumper and scads and more solitary species such as Spanish mackerel and barracudas are more easily caught both at the bottom and in mid water. This difference in catchability detracts from the value of the records of the catches in describing the resource composition and this reservation should be kept in mind.
Complete catch records and various types of processed outputs giving catches by groups, species and surveys are available in the DATA FILE ANNEX to this report. Here we will only show some brief extracts of the catch data.
Table 3.5.1 shows the mean catch rates in kg/hour, the three highest rates obtained and the incidence of occurrence by families and surveys and for the inner and outer shelf parts separately. Engraulids, clupeids, barracudas and hairtails show the highest rates on the inner shelf, carangids and scombrids are found over the whole shelf. There is a considerable variation in catch rates through the year, but not many clear trends. The catch rates for clupeids are highest on the outer shelf in surveys 2 and 3 which conforms with the more offshore distribution observed at those times. The large sized predators, barracudas and hairtails seem in general to be less abundant in the last two surveys. The high mean rates for the clupeids results mostly from a few high catches. The carangids show only a few high rates, caused by catches of rough scad.
Table 3.5.1 Oriente. Pelagic fish. Catch rates in kg/hour by main groups by surveys. Mean rate, three highest rates and rate of occurrence. All hauls.
|
Survey |
Mean rate |
Highest rates |
Rate of occurrence |
|||
|
INNER SHELF |
|
|
|
|
|
|
|
|
ENGRAULIDS |
|
|
|
|
|
|
1 February |
32 |
486, |
143, |
102 |
10/29 |
|
|
2 May-June |
255 |
5080, |
17, |
0 |
2/20 |
|
|
3 Aug.-Sept. |
5 |
|
|
|
1/26 |
|
|
4 November |
34 |
318, |
66, |
47 |
5/13 |
|
|
|
CLUPEIDS |
|
|
|
|
|
|
1 February |
345 |
5780, |
1368, |
887 |
19/29 |
|
|
2 May-June |
412 |
8000, |
155, |
30 |
9/20 |
|
|
3 Aug.-Sept. |
137 |
1827, |
432, |
263 |
16/26 |
|
|
4 November |
154 |
868, |
780, |
113 |
10/13 |
|
|
|
CARANGIDS |
|
|
|
|
|
|
1 February |
43 |
400, |
340, |
137 |
21/29 |
|
|
2 May-June |
40 |
185, |
143, |
90 |
15/20 |
|
|
3 Aug.-Sept. |
77 |
1540, |
169, |
64 |
15/26 |
|
|
4 November |
3 |
13, |
8, |
8 |
5/13 |
|
|
|
SCOMBRIDS |
|
|
|
|
|
|
1 February |
4 |
30, |
24, |
18 |
7/29 |
|
|
2 May-June |
17 |
309, |
29, |
2 |
3/20 |
|
|
3 Aug.-Sept. |
2 |
32, |
16, |
9 |
4/26 |
|
|
4 November |
|
|
|
|
|
|
|
|
BARRACUDAS |
|
|
|
|
|
|
1 February |
14 |
224, |
55, |
55 |
55/29 |
|
|
2 May-June |
25 |
364, |
47, |
42 |
9/20 |
|
|
3 Aug.-Sept. |
4 |
18, |
11, |
11 |
13/26 |
|
|
4 November |
5 |
24, |
13, |
11 |
6/13 |
|
|
|
HAIRTAILS |
|
|
|
|
|
|
1 February |
56 |
1400, |
75, |
64 |
12/29 |
|
|
2 May-June |
26 |
260, |
95 |
80 |
8/20 |
|
|
3 Aug.-Sept. |
266 |
6667, |
63 |
62 |
11/26 |
|
|
4 November |
2 |
15, |
5, |
2 |
4/13 |
|
|
OUTER SHELF |
|
|
|
|
|
|
|
|
CLUPEIDS |
|
|
|
|
|
|
1 February |
21 |
407, |
145, |
52 |
7/25 |
|
|
2 May-June |
109 |
1471, |
950, |
292 |
11/28 |
|
|
3 Aug.-Sept. |
132 |
980, |
781, |
593 |
19/29 |
|
|
4 November |
40 |
614, |
160, |
146 |
6/27 |
|
|
|
CARANGIDS |
|
|
|
|
|
|
1 February |
30 |
194, |
153, |
142 |
14/25 |
|
|
2 May-June |
141 |
845, |
718, |
347 |
25/28 |
|
|
3 Aug.-Sept. |
17 |
127, |
89, |
65 |
20/29 |
|
|
4 November |
93 |
2196, |
69, |
69 |
20/27 |
|
|
|
SCOMBRIDS |
|
|
|
|
|
|
1 February |
- |
- |
- |
- |
0/25 |
|
|
2 May-June |
19 |
321, |
76, |
38 |
11/28 |
|
|
3 Aug.-Sept. |
7 |
140, |
21, |
17 |
11/29 |
|
|
4 November |
17 |
243, |
208, |
3 |
4/27 |
|
|
|
BARRACUDAS |
|
|
|
|
|
|
1 February |
2 |
45, |
1, |
0 |
2/25 |
|
|
2 May-June |
3 |
45, |
14, |
9 |
5/28 |
|
|
3 Aug.-Sept. |
1 |
15, |
3, |
2 |
5/29 |
|
|
4 November |
1 |
7, |
2, |
2 |
4/27 |
|
It seems probable that there may be less difference in the catchability between the various species of carangids and their proportion by weight of the total carangid catches are shown in Table 3.5.2. The rough scad Trachurus lathami dominate this group in all surveys with minor representation by a number of other genera/species.
Table 3.5.2 Oriente. Species distribution of carangids. Catch by weight of species by surveys as per cent of total catch of family.
|
Survey: |
1 |
2 |
3 |
4 |
Mean |
|
Mean catch, kg/hour |
37 |
99 |
44 |
64 |
|
|
Trachurus lathami |
86 |
87 |
89 |
90 |
88 |
|
Chloroscombrus chrysurus |
5 |
|
1 |
|
2 |
|
Decapterus spp. |
2 |
1 |
2 |
3 |
2 |
|
Selene spp. |
2 |
6 |
|
2 |
3 |
|
Selar crumenophthalmus |
3 |
4 |
1 |
|
2 |
|
Trachinotus carolinus |
1 |
|
1 |
|
1 |
|
Seriola spp. |
1 |
|
4 |
4 |
2 |
The guachanche barracuda Sphyraena guachancho and the southern sennet Sphyraena picudilla had a nearly equal representation, both by weight and by number of catches.
The hairtails consisted of only one species the large headed hairtail Trichiurus lepturus and it was found nearly exclusively on the inner shelf.
Biomass estimates
The estimates of biomass based on the acoustic observations are shown in Table 3.5.3. As described under chapter 1 above a separation into two groups of fish is attempted during the processing of the data, Pelagic I consisting of engraulids and clupeids and Pelagic II which mainly includes carangids, scombrids, barracudas and hairtails. This separation is partly based on the catch compositions, partly on characteristics of behaviour in relation to forms of aggregations and the results will only be an approximation of the proportions between the groups.
There is a considerable variation in the estimates between surveys, both for each of the groups and for the totals. This could partly be a sampling variance caused by changes in the distribution and behaviour of the fish, but there could also be some effects of real changes of the available biomass through migrations in and out of the survey area or through cycles of production. Thus the low biomass level for the pelagic 2 group in survey 4 is reflected in generally low catch rates for that survey. As estimate of the mean standing biomass of the relatively short lived clupeids and engraulids it is proposed to use the simple mean of all four surveys. For the carangids, scombrids etc. with a substantial part distributed on the outer shelf it is assumed that the low levels observed in the second and last surveys are caused by migrations or other forms of inaccessibility and it is proposed that the best estimate of standing biomass is obtained by taking the mean of the first and third surveys.
In order to have a separate estimate of the biomass of the sardinella “stock one approach is to make use of the characteristic high density of the sardinella aggregations. The distribution of the P I biomass by density levels is shown in Table 3.5.4. Typical sardinella areas are associated with levels of 100 and above. The mean proportion for the four surveys represented by these high levels of density is 80%. These assumed sardine areas will include some anchovies and other clupeids. but the sardine is on the other hand also found outside the dense aggregations, especially juveniles. On the whole it is thought that the 80% may if anything represent an underestimate of the true proportion of sardinella. For the P II groups the mean proportion in the catches will be used for a breakdown.
The resulting estimates of standing stocks of pelagic fish are as follows:
|
Sardinella |
800 000 |
tonnes |
|
Other clupeids and anchovies |
200 000 |
tonnes |
|
Rough scad |
176 000 |
tonnes |
|
Other carangids |
24 000 |
tonnes |
|
Scombrids and barracudas |
40 000 |
tonnes |
|
Total small pelagics |
1 240 000 |
tonnes |
Table 3.5.3 Oriente. Estimates of standing biomass of pelagic fish by surveys and groups. 1 000 t.
|
Survey |
Pelagic 1 |
Pelagic 2 |
Total |
|
1 February |
1 220 |
230 |
1 450 |
|
2 May-June |
830 |
40 |
870 |
|
3 August |
1 100 |
140 |
1 240 |
|
4 Oct.-Nov. |
840 |
20 |
860 |
|
Density level |
0-10 |
11-30 |
31-100 |
101-300 |
300-1000 |
>1000mm |
Total |
|
|
Survey 1 |
|
|
|
|
|
|
|
|
|
|
Biom. ind. |
1429 |
20780 |
20096 |
54416 |
330156 |
|
426877 |
|
Biom. % |
|
5 |
5 |
13 |
77 |
|
|
|
|
Area nm |
661 |
1397 |
589 |
232 |
570 |
|
3449 |
|
|
Area % |
19.16 |
40.50 |
17.08 |
6.73 |
16.53 |
|
|
|
|
% of shelf |
5.51 |
11.64 |
4.91 |
1.93 |
4.75 |
|
|
|
|
Empty shelf % |
|
|
|
|
|
|
71 |
|
|
Survey 2 |
|
|
|
|
|
|
|
|
|
|
Biom. ind. |
2533 |
10435 |
30410 |
103167 |
8471 |
135524 |
290540 |
|
Biom. % |
1 |
4 |
10 |
36 |
3 |
47 |
|
|
|
Area nm |
319 |
602 |
598 |
350 |
20 |
106 |
1995 |
|
|
Area % |
15.99 |
30.18 |
29.97 |
17.54 |
1.00 |
5.31 |
|
|
|
% of shelf |
2.66 |
5.02 |
4.98 |
2.92 |
0.17 |
0.88 |
|
|
|
Empty shelf % |
|
|
|
|
|
|
83 |
|
|
Survey 3 |
|
|
|
|
|
|
|
|
|
|
Biom. ind. |
20855 |
73604 |
6995 |
39546 |
243579 |
|
384579 |
|
Biom. % |
5 |
19 |
2 |
10 |
63 |
|
|
|
|
Area nm |
2207 |
4874 |
93 |
181 |
368 |
|
7723 |
|
|
Area % |
28.58 |
63.11 |
1.20 |
2.34 |
4.76 |
|
|
|
|
% of shelf |
18.39 |
40.62 |
0.78 |
1.51 |
3.07 |
|
|
|
|
Empty shelf % |
|
|
|
|
|
|
36 |
|
|
Survey 4 |
|
|
|
|
|
|
|
|
|
|
Biom. ind. |
2798 |
22489 |
46227 |
18940 |
202382 |
|
292836 |
|
Biom. % |
1 |
8 |
16 |
6 |
69 |
|
|
|
|
Area nm |
726 |
1510 |
1086 |
157 |
342 |
|
3821 |
|
|
Area % |
19.00 |
39.52 |
28.42 |
4.11 |
8.95 |
|
|
|
|
% of shelf |
6.05 |
12.58 |
9.05 |
1.31 |
2.85 |
|
|
|
|
Empty shelf % |
|
|
|
|
|
|
68 |
|
The main source of data for the analysis of the demersal resources is from the random bottom trawl stations. For the Oriente shelf this material comprise 44, 47, 40 and 33 stations from the four coverages respectively. Below only the highlights from the analysis for the main commercial species or species groups are commented upon in the text. The inner and the outer shelf parts as described above are analysed separately. The complete results from the analysis are included in Annex 7 of the DATA FILES.
Demersal fish
The main demersal groups on the inner shelf are catfish, croakers and grunts, with lesser amounts of groupers. The outer shelf is clearly dominated by snappers and grunts but contains also minor resources of groupers, croakers and seabreams.
The main species are for the inner shelf: catfish, Cathorops spixii and Bagre marinus, barbel drum Ctenosciaena gracilcirrhus, bronze striped grunt Haemulon boschmae, cardinal snapper Pristipomoides macrophthalmus and whitemouth croaker Micropogonias furnieri. For the outer shelf the main species are cardinal snapper, bronzestriped grunt, vermillion snapper Rhomboplites aurorubens, dwarf goatfish Upeneus parvus and Atlantic bigeye Priacanthus arenatus.
Catch composition
As most of the trawl hauls are randomly located for purpose of swept area estimates, they will not be representative for aimed fishery at targeted species and locations. The highest catches, however, might be representative for a fishery and the mean catch might serve as indicators of minimum catch rates in a wide scale multi-species fishery.
Table 3.5.5 shows the mean catch rates by surveys in kg/hour and the total catch distribution by size classes for the main demersal species in the Oriente region. Catfish was most common at the inner shelf, with a mean catch of 90 kg/hour, barbel drum gave a mean of 38 kg/hour, and with 4 of 16 catches exceeding 100 kg/hour. At the outer part of the shelf, the two dominating snappers totalled 69 kg/hour.
A more detailed analysis on the species level, which is not within the scope of this report, might show vertical migration of species between surveys and depth dependent size distribution.
Table 3.5.5 Oriente. Mean catch rates and catch distribution by size class for all swept-area hauls carried out on the shelf.
|
Species |
Mean rate |
Number of hauls in catch groups. |
Rate of occurrence* |
||||||
|
kg/hour |
1-30 kg |
30-100 kg |
0.1-03 t |
0.3-1 t |
1-3 t |
>3 t |
|||
|
INNER SHELF |
|
|
|
|
|
|
|
|
|
|
|
Catfish |
90 |
10 |
2 |
2 |
4 |
2 |
|
20/58 |
|
Barbel drum |
38 |
9 |
3 |
2 |
1 |
1 |
|
16/58 |
|
|
Bronzestriped grunt |
12 |
13 |
1 |
0 |
|
|
|
15/58 |
|
|
Cardinal snapper |
12 |
21 |
3 |
2 |
1 |
|
|
26/58 |
|
|
Whitemouth croaker |
11 |
15 |
1 |
3 |
|
|
|
19/58 |
|
|
OUTER SHELF |
|
|
|
|
|
|
|
|
|
|
|
Cardinal snapper |
50 |
28 |
11 |
12 |
5 |
|
|
56/94 |
|
Bronzestriped grunt |
27 |
16 |
8 |
6 |
2 |
|
|
32/94 |
|
|
Vermillion snapper |
19 |
34 |
6 |
6 |
1 |
|
|
47/94 |
|
|
Dwarf goatfish |
17 |
49 |
7 |
6 |
|
|
|
62/94 |
|
|
Atlantic bigeye |
15 |
53 |
1 |
6 |
|
|
|
60/94 |
|
* Calculated on basis all hauls total shelf.In Table 3.5.6 the catch rates are summed by main species groups. On the inner shelf the croakers amounts to 76 kg/hour, grunts 30 kg/hour, and catfish 90 kg/hour. The mean for snappers, groupers, croakers and grunts summed is 150 kg/hour. On the outer shelf the snappers give a mean rate of 79 kg/hour, grunts 50 kg/hour and the main commercial groups summed give 165 kg/hour.
Table 3.5.6 Oriente. Mean catch rates (kg/hour) in all hauls by main commercial groups.
|
Family |
INNER SHELF |
OUTER SHELF |
|
0-50 m |
50-100 m |
|
|
Snappers |
18 |
79 |
|
Groupers |
6 |
12 |
|
Croakers |
76 |
12 |
|
Grunts |
30 |
50 |
|
Seabreams |
0 |
12 |
|
Catfish |
90 |
0 |
|
Other fish |
73 |
109 |
In Annex 7 of the DATA FILES estimates of fish density are given by depth strata. By multiplying these densities with the area of the shelf, given in Table 2.3.1 depth stratified estimates of standing biomass are obtained by surveys and species or species groups. These estimates are presented for the main groups in Table 3.5.7. The data are analysed by depth zones, and are not split into inner and outer shelf parts as above.
Table 3.5.7 Oriente. Estimates of biomass of demersal fish on the shelf by main groups.
|
Group |
Survey 1 |
Survey 2 |
Survey 3 |
Survey 4 |
All surveys |
|
|
SHALLOW AREAS 0-50M, BOTH INNER AND OUTER SHELF |
||||||
|
|
Snappers |
2 200 |
7 500 |
3 800 |
4 600 |
4 500 |
|
Groupers |
1 900 |
3 000 |
500 |
3 200 |
2 200 |
|
|
Croakers |
3 000 |
5 200 |
600 |
700 |
2 400 |
|
|
Grunts |
6 300 |
2 500 |
5 100 |
19 500 |
8 800 |
|
|
Seabreams |
2 600 |
1 500 |
1 900 |
2 500 |
2 200 |
|
|
Sum above |
16 000 |
19 700 |
11 900 |
30 500 |
20 100 |
|
|
Catfish |
4 200 |
15 400 |
5 040 |
0 |
10 500 |
|
|
Other demersal |
10 000 |
21 400 |
14 700 |
17 600 |
11 300 |
|
|
|
||||||
|
DEEPER AREAS 50-120M, BOTH INNER AND OUTER SHELF |
||||||
|
|
Snappers |
4 900 |
22 000 |
14 400 |
18 200 |
15 000 |
|
Groupers |
300 |
1 900 |
350 |
650 |
900 |
|
|
Croakers |
100 |
13 700 |
50 |
650 |
4 500 |
|
|
Grunts |
4 700 |
4 800 |
9 000 |
2 200 |
5 500 |
|
|
Seabreams |
200 |
450 |
150 |
2 600 |
700 |
|
|
Sum above |
10 200 |
42 850 |
24 000 |
24 300 |
26 600 |
|
|
Catfish |
0 |
0 |
0 |
5 500 |
900 |
|
|
Other demersal |
8 100 |
14 500 |
8 000 |
20 800 |
14 100 |
|
|
Total comm. dem. |
26 800 |
62 500 |
35 900 |
54 800 |
46 600 |
|
|
Total other |
22 300 |
51 300 |
27 740 |
43 900 |
36 800 |
|
The survey estimates for the main commercial groups summed vary between 27 000 and 55 000 tonnes for the whole shelf, with a mean of around 47 000 tonnes. In the shallow waters (0-50 m) the grunts give a mean estimate of close to 9 000 tonnes, followed by snappers almost 5 000 tonnes and groupers, croakers and seabreams with slightly above 2 000 tonnes each. In the deeper part of the shelf snappers are estimated at 15 000 tonnes, croakers and grunts around 5 000 tonnes each and seabreams at the order of 500 tonnes. Other demersal fish, mostly non-commercial and including catfish, contribute with a mean estimate of 37 000 tonnes for the whole shelf.
Sharks
Sharks appeared in small quantities in the catches mostly on the inner shelf. Table 3.5.8 shows the compiled catch data. The exceptional high single catch in survey 3 consisted of some large specimens of tresher sharks. Excluding this, the species composition by weight of total catch was:
|
Caribbean sharpnose shark, Rhizoprionodon
porosus |
26% |
|
Smalleye smooth-hound, Mustelus higmani |
13% |
|
Smooth dogfish, Mustelus canis |
37% |
|
Sand devil, Squatina dumeril |
3% |
Table 3.5.8 Oriente. Sharks. Catch rates in kg/hour by main groups by surveys. Mean rate, three highest rates and rate of occurrence. All hauls.
|
Survey |
Mean rate |
Highest rates |
Rate of occurrence |
||
|
1 February |
3 |
32, |
22, |
13 |
21/54 |
|
2 May-June |
6 |
81, |
42, |
37 |
12/48 |
|
3 Aug.-Sept. |
14 |
560, |
54, |
25 |
17/55 |
|
4 November |
4 |
18 |
16, |
16 |
17/40 |
Small sized Loligo squids were common over large parts of the shelf with highest abundance at intermediate depths in the Margarita Island area. Table 3.5.9 shows the summarized catch data where the mean catch rates in hauls of occurrence have been included since squids are predominantly caught in bottom trawl by day and the distribution tends to be patchy. There is a clear seasonal trend in the catches with highest rates in the February and May-June surveys. This reflects the production cycle for these short lived shelf squids. Swept area biomass estimates for each of the surveys were: 7 000 tonnes, 8 200 tonnes, 1 200 tonnes, and 2 800 tonnes respectively. It is proposed to use 8 000 tonnes as a stock estimate. The catches consisted nearly exclusively of the two species Loligo plei and L. pealei with an overall proportion 70/30%.
Table 3.5.9 Oriente. Squid. Catch rates in kg/hour by main groups by surveys. Mean rate, in all hauls and where present, three highest rates and rate of occurrence.
|
Survey |
Mean rate |
Highest rates |
Rate of occurrence |
|||
|
All |
Present |
|
|
|
||
|
1 February |
17 |
25 |
192, |
132, |
80 |
36/54 |
|
2 May-June |
15 |
24 |
89, |
84, |
81 |
31/48 |
|
3 Aug.-Sept. |
4 |
8 |
47, |
23, |
18 |
27/55 |
|
4 November |
9 |
17 |
89, |
81, |
51 |
21/40 |
20 test hauls were made for deep sea shrimp at 200-800 m depth in the fishable parts of the slope between the Testigos Islands and the Tortuga Island. Table 3.5.10 summarizes the results for the commercial types of shrimp showing mean catch rates in hauls with catch of the respective species.
The megalops shrimp Penaeopsis serrata is the most common form at 300-400 m and royal red shrimp Pleoticus robustus at 300-500 m. The giant red shrimp Aristaemorpha folicea and the striped red shrimp Aristeus varidens occurred at intermediate depths, 400-500 m while the scarlet shrimp Plesiopenaeus edwardsianus was taken in a few hauls at 700-800 m. The Caribbean lobster Metanephrops binghami was caught in a few localities at 300 m depth but with catch rates only up to about 10 kg/hour. The distribution of these deep sea crustaceans has a tendency to be patchy and commercial catch rates would likely be higher than the means of Table 3.5.10, but it seems perhaps doubtful whether these resources could sustain a trawl fishery at this depth. Minor amounts of cephalopods formed part of the by-catch, the most common species being the broadtail shortfin squid Illex coindetti with rates up to 20 kg/hour.
Table 3.5.10 Oriente. Tests for deep water shrimp, 20 hauls 220-800 m. Catch rates in kg/hour hauls in hauls with catch and main depth range.
|
|
Mean catch |
Highest |
Incidence |
Depth |
||
|
Penaeopsis serrata |
11 |
50, |
32, |
23 |
11/20 |
300-400 |
|
Pleoticus robustus a.o. |
4 |
14, |
12, |
8 |
13/20 |
300-500 |
|
Aristaemorpha foliacea |
8 |
32, |
5, |
3 |
6/20 |
400-530 |
|
Aristeus varidens |
4 |
10, |
2, |
1 |
3/20 |
400-500 |
|
Plesiopenaeus edwards. |
5 |
8, |
3, |
|
2/20 |
660-840 |
![]()
![]()
![]()