![]()
![]()
![]()
a FAO, Animal Production and Health Division, Rome, Italy
b Environmental Research Group Oxford (ERGO), Oxford, UK
Abstract
Whilst still in its infancy, the development of geographic information systems (GIS) and remote sensing (RS) tools is paving the way for global land use monitoring. This paper provides a first, tentative description of livestock related land use.
Preliminary results indicate that, in most of the developing world, the distributions of man and his livestock are closely related. This association is particularly prominent in India for large ruminants, and in South East Asia for pigs and poultry. For example, it is estimated that in China some 95 percent of the human population is concentrated in 50 percent of the land area, the humid plus subhumid ecozones. Here, the average density of 260 persons per square km coincides with a livestock biomass of approximately 25 metric tonnes, out of which 36 percent, or 9 metric tonnes, is made up of live weight pigs plus poultry. The densely populated, higher rainfall areas of China thus form the global epicentre of monogastric animals. It is in these areas also, that the highest animal protein production increase occurs. These local developments strongly affect the global statistics on animal agriculture; it is estimated that in the year 2010 poultry meat and pork will constitute about 70 percent of the developing world's total meat production.
With the progressive prominence of so-called land-detached, monogastric animal protein production in peri-urban environments in South East Asia, the question arises how to accommodate this development within the global agricultural landscape. While crop productivity gains may assist in overcoming the increased demand for cereals for livestock feed, the dynamic global animal production and associated change in land utilisation pattern interferes with a whole series of complex development issues, including poverty, environmental safety and emerging diseases' risk.
The progressive aggregation of people, crops and livestock in the developing countries requires clarification in order to come to grips with the complexity of interactions among economic, social and ecological processes. GIS and RS provide the tools for such undertaking.
Key words. Livestock geography, land use, animal agriculture, geographic information systems, monogastric animals, animal protein, Asia, China.
Introduction
Livestock species are grouped according to their digestion system into ‘ruminants’ and ‘non-ruminants’ or ‘monogastrics’. This division reflects the differences in the animals' feed requirements and, thereby, the livestock related land use. Whilst most ruminants are confined to grazing areas, monogastric animals may be kept anywhere. Because monogastric and dairy animals produce perishable consumables there is a tendency to keep these animals in the proximity of the market. In developing countries, where cooling, storage and transport problems complicate the distribution of meat, milk and eggs to urban populations, there is a strong tendency to establish production units in areas of high population and land pressure, and to bring in the feed from where-ever is the most economic and convenient.
While ruminants may be kept in sparsely inhabitated areas and harsh environments unsuitable for crop production, these species are increasingly kept near human settlement and associated cropping areas (Bourn and Wint, 1994). Despite this progressive trend towards intensification, integrated livestock-crop (and fishery/forestry) production is believed to be still the most common farming system across the globe. These assumptions can, however, only be confirmed by analysing the spatial distribution of livestock in relation to agro-ecological zonation, and the distribution of people and crop production, much of which is lacking.
This paper argues the need for a quantitative geographic framework to characterise global livestock production. The work presented is drawn from a series of preliminary FAO studies carried out in 1996 (FAO 1996a, and b), which aimed to establish the data processing and analytical techniques and protocols required to collate and interpret the information available in a systematic fashion.
Methods
The primary data sources held by FAO, and potentially suitable for mapping, include:
The WAICENT global data set on Country Agricultural, Land and Demographic variables for the years 1962, 1972, 1982, 1992 and 1994, in spreadsheet format, available through the Internet site (http://www. fao. org/lim500/agri_db. pl).
Raster images of agro-ecological zones (AEZ) and national boundaries, converted to vector polygon format;
Raster images of global human population numbers at a resolution of 5 × 5 minutes.
The animal population data are available only at national level, and not for within country agro-ecological zones. In contrast, global human population is available, in image format, at a resolution of approximately 10 × 10 kilometres. By dint of relatively simple, if labour intensive, image processing and GIS techniques, these can be used to produce human population numbers for each agro-ecological zone within each country.
A number of studies on Sub-Saharan Africa have shown that livestock and human population levels are closely associated (Bourn and Wint, 1994). Where there are more people there are more animals. This link is sufficiently robust to be evident at a global and continental level. This is shown in Table 1, which gives the best fits from a choice of linear, logarithmic, power, compound and growth regression equations for each category, together with their significance statistics. These relationships were applied to the AEZ human population data to predict total animal biomass in each AEZ.
It is, however, unlikely that a single equation would satisfactorily describe the relationship between the numbers of people and individual animal species at a global level - there is too much regional variability in livestock management practices and the range of species kept. Therefore, the numbers of individual species were estimated by calculating the number (or weight) of each livestock species per person for each country, and then applying these ratios to the individual AEZ human population data to give the weight of each species in each AEZ in each country. Full details of the methods and analysis protocols are given in (FAO, 1996a and b).
Table 1: Relationships between livestock and human populations
| Continent | Spp* | Function | Df | F | Significance | b1 (slope) | R2 |
|---|---|---|---|---|---|---|---|
| Africa | All | Power | 51 | 543.28 | . 000 | 1.9669 | . 914 |
| Asia | All | Power | 40 | 887.52 | . 000 | 1.9105 | . 957 |
| South Am. | All | Power | 14 | 54.82 | . 000 | 2.5727 | . 797 |
| North Am. | All | Linear | 23 | 66.55 | . 000 | 61.2857 | . 743 |
| Europe | All | Power | 41 | 209.91 | . 000 | 1.7860 | . 837 |
| Australia | All | Linear | 1 | 177.05 | . 048 | 779.06 | . 994 |
| Oceania | All | Linear | 4 | 117.94 | . 000 | 135.598 | . 967 |
| World | All | Power | 177 | 1026.64 | . 000 | 1.9336 | . 853 |
Linear equations of form y =ax + b1.Power equation of form: y = xb1.
y= Livestock Density (kg/km2). x= Human Population (no/km2). R2 is redefined, as it was assumed
that there are no livestock where there are no people so the equations were forced through Zero
* All Species; SR = Small Ruminants; LR=Large Ruminants; NR = Non-Ruminants (Pigs andPoultry)
Results
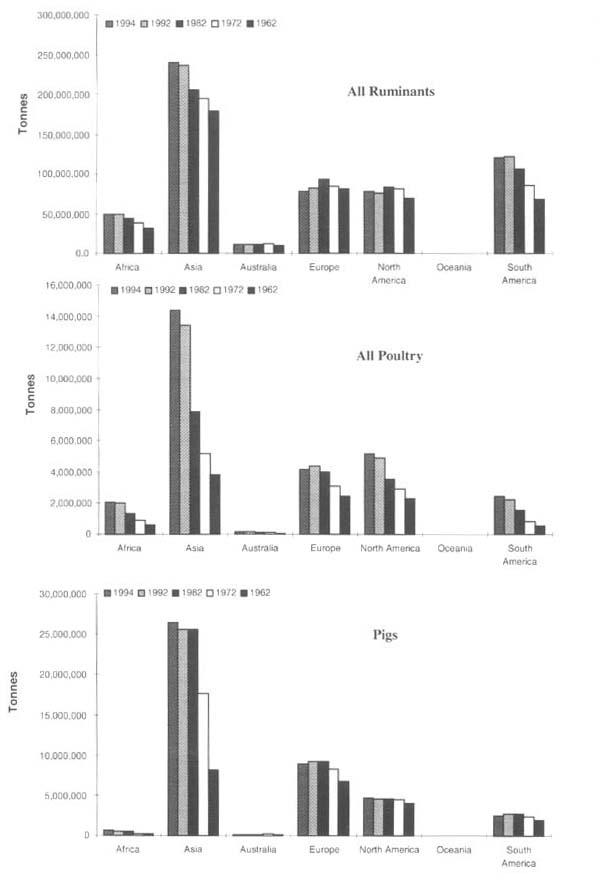
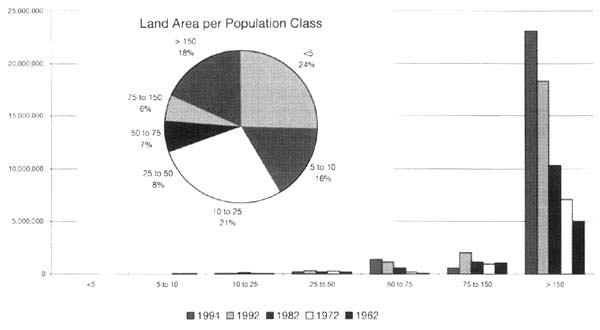
The distribution of different categories of livestock between continents shows Asia to be prominent in ruminants, poultry and pigs: it supports approximately 64 percent of the global livestock biomass. It should be stressed that the biomass distributions shown here reflect the weight and, thereby, the number of animals present, but does not provide information on the density of the animals, the productivity level or the volume of production. The latter two parameters indicate a different geographical focus with the emphasis on developed countries, particularly Western Europe (FAO 1996b).
Figure 1 also provides an indication of temporal changes in the livestock biomass levels. Pigs have increased most substantially in Asia, since 1962, though in recent years their biomass has stabilised. This suggests that any increases in production have been derived from rises in productivity. Poultry populations have risen in all continents, though by far the most strongly in Asia, both in absolute and relative terms. The number of ruminants, by contrast, have increased in the developing world, but have either remained static, or fallen, in the developed nations.
Figure 1: Livestock Biomass by Continent
Map 1: Livestock Biomass Density in Asia, 1994
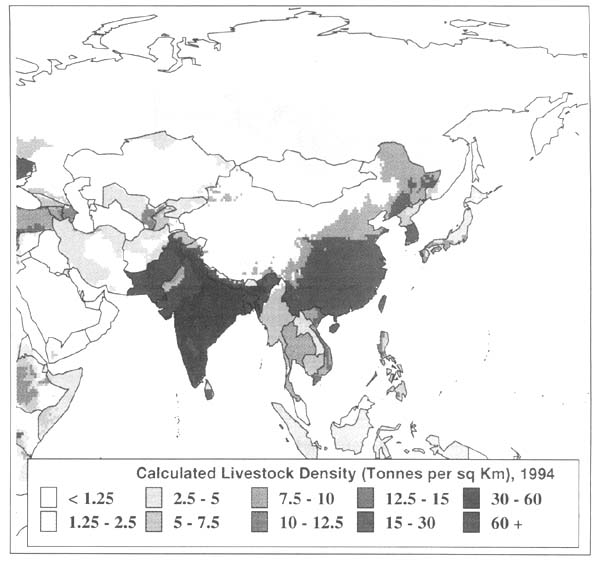
The relevance of this geographic breakdown becomes even more apparent when Map 1 is considered, depicting the distribution pattern of livestock within Asia, with the major foci in India and China Further interrogation of this data base in a geographical information system (GIS) shows these two concentrations are comprised of ruminant and monogastric animals respectively.
The evolution of the ruminant versus monogastric livestock biomass in Asia according to ecozones is substantiated in Figure 2. There is a clear tendency towards a replacement of ruminants by monogastric livestock in wetter areas (see Map 2). However, some caution is required when interpreting this trend because the progressive aggregation of monogastric livestock in humid and moist subhumid areas in Asia is not universal, and appears not so much influenced by the climatic conditions in which the animals are kept but, rather, by human preferences or anthropogenic factors.
Map 2: Agro-ecological Zone in Asia
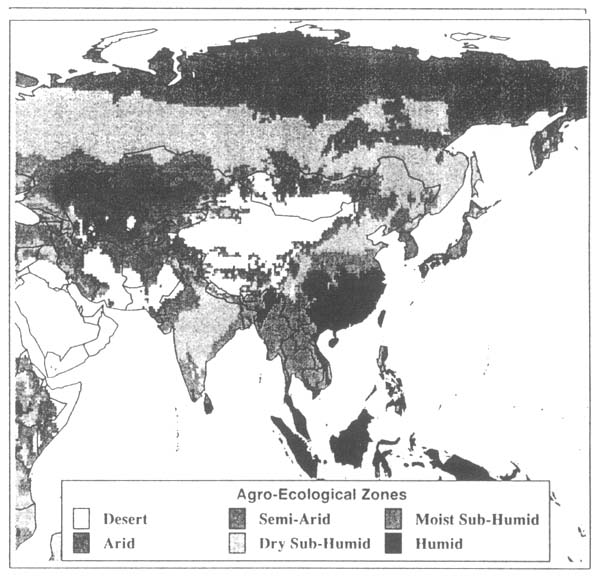
Figure 2: Non-Ruminants as a % of Total Biomass by Agro-Ecological Zone
The importance of the anthropogenic influence in determining non-ruminant distributions can be illustrated by geographical analysis of biomass distributions in relation to human population density. Both the poultry and pig biomass is shown in relation to human population in Asia (Figure 3) and compared to that of the remainder of the world (Figure 4). The accompanying pie charts detail the land area proportions corresponding with the respective human population density classes. In Asia, there is a very pronounced aggregation of both types of monogastric animals in the densely population areas. In the rest of the world, in contrast, this aggregation is less obvious, in that the non-ruminants are more evenly distributed in relation to human population density.
Interrogation of geographical information system data base shows that in China in 1994 approximately 95 percent of the total population (1.19 billion people) was distributed over 50 percent of the land area (4.57 million square kilometres), coinciding with the humid and subhumid ecozones. Here the vast majority of all the monogastric animals are kept. Thus, the wetter area of China forms the global epicentre of monogastric animals, with 9 tonnes live weight of monogastrics per square kilometre, in addition to an average of 260 people.
Figure 3:
Total Poultry Weight (Tonnes) in relation to Human Population Density (No/Km2)
Total Pig Weight (Tonnes) in relation to Human Population Density (No/Km2)
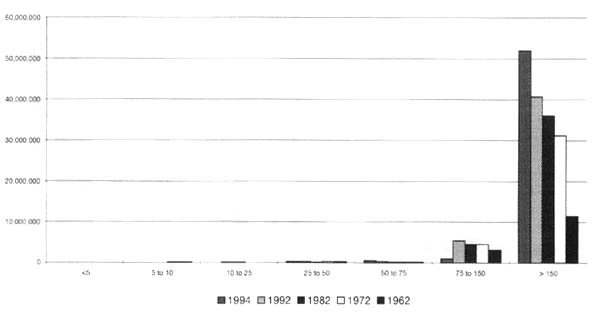
Figure 4:
Total Poultry Weight (Tonnes) in relation to Human Population Density
(No/Km2)
EXCLUDING ASIA
Total Pig Weight (Tonnes) in relation to Human Population Density (No/Km2)
EXCLUDING ASIA
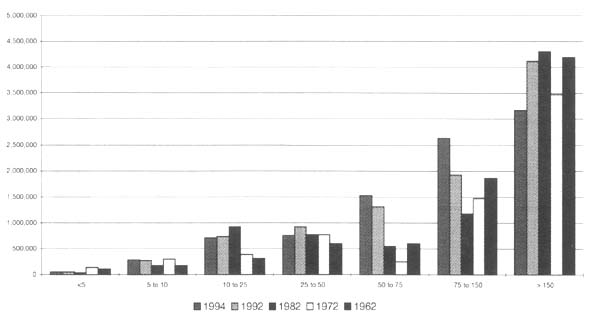
Figure 5:
Non-Ruminants as a Percentage of Total Livestock Biomass
As shown in Figure 5, monogastric animals constitute an increasing percentage of global livestock biomass. This trend is more marked for the continent of Asia as a whole. If, however, China is examined separately, this proportion is substantially higher than elsewhere, but has been static for the last 10 to 15 years. It should be noted that this apparent stability results from a rise in total livestock biomass levels in China, and obscures the absolute rise in non-ruminant biomass.
Discussion
The results suggest that the distribution of livestock biomass is strongly influenced by human factors rather than climatic features or ecozone (LGP). The relative increase in the numbers of monogastric animals in Asia is closely associated with the areas of highest human population pressures. An extrapolation of current trends suggest that in the year 2010 poultry and pig meat would comprise 70 percent of the total meat production in the developing world (FAO, 1995). In order to understand the implications of the animal protein production upsurge in Asia it is necessary to consider the changes in (i) the demand for the individual animal protein products such as eggs, milk and meat, (ii) the animal productivity levels and (iii) the related grain and land requirements.
Demand for animal protein
FAO (FAO, 1996c) has grouped the world's nations into six different classes according to
major food commodities consumed per capita:
| 1. Rice; | 2. Maize; |
| 3. Wheat; | 4. Milk/Meat/Wheat; |
| 5. Millet/Sorghum; | 6. Cassava/Yams/Taro/Plantain. |
Class 1 is mainly made up of countries from the Asia region with a high rice consumption and a relatively high proportion of animal protein in the diet that is increasing faster than anywhere else in the developing world. Despite this rapid growth, consumption levels of pork and ruminant meat is still only 29 and 10 percent respectively of those in developed countries. (FAO, 1995) Class 2 and 3 embrace diverse developing countries; class 4 includes mainly developed countries whilst the last two classes largely comprises the countries of inter-tropical Africa.
When these dietary habits and trends are considered in conjunction with the ongoing economic growth and rising income levels, and when taking into account the income and price elasticities of the demand for livestock products, it is not surprising that Asia shows the highest growth in animal protein production of all world regions, for poultry meat, eggs, pork, red meat and milk alike.
This increase is unlikely to proceed indefinitely. Consumption per capita is likely to eventually stabilize or become balanced with more fibers, to form what is perceived as a healthier diet. However, because of the projected absolute increases in number of people in Asia, the total consumption of animal protein, once this has attained its highest level, may not diminish much for a considerable period of time.
Efficiency of production
Equally dynamic are the levels of livestock productivity. With the continued advance of
genetics, feeding, health care and management, it may be assumed that the level of
productivity, measured in terms of efficiency of feed conversion, is likely to rise quite
spectacularly in most developing countries in the short to medium term. The present level of
productivity, estimated as the ratio of product to ‘standing crop’ of animals, suggests a
predominance of low to medium input level production systems. This is corroborated by the
figures on the sales of concentrate feed and veterinary products in South-East Asia which show
the highest growth rates in the world, though they are still relatively low compared to intensive
systems in developed countries (Yeo, 1996).
For the industrial systems it would appear that the end of the intensification trajectory has almost been attained. The conversion of 1.75 kg of concentrate feed into one kg of live weight chicken, which is nowadays feasible in modern production units, has approached physiological limits.
Feed grain and arable land requirements
In the developed world, about 65 percent of the total agricultural land area is allocated to the
production of cereals for livestock feed (FAO, 1995). Thus, with emerging economies and
middle-income countries in Asia following suit, animal agriculture would become the most
important farming activity world-wide. However, not all the required grain can be grown in
Asia. A recent analysis of different grain supply and demand projections models on China
suggested most models to be plainly wrong but, interestingly, the better models showed similar
results with grain production in the year 2010 ranging from 389 to 486 and the demand from
468 to 513 million metric tonnes. These findings suggest that China will depend on substantial
although not excessive grain imports. (Shenggen Fan and Mercedita Agcaoili-Sombilla, 1997).
It would appear that, globally, there is sufficient arable land to facilitate such development.
Before 1960, most increases in grain production resulted from expanding acreage under
cultivation, whilst between 1960–1990, at least 80 percent of the 110-percent increase in cereal
production came from raising yields per acre. Improved cereal yields have thus kept the global
area actually harvested for grain at around 600 million hectares. These increases in yields have
largely derived from the use of improved varieties of cereals, a 70-percent expansion of
irrigation (from 100 to 170 million hectares), and a more than tripling use of chemical fertilizer
(Action Group on Food Security, 1994).
Emerging diseases
While there may globally be sufficient land resources to allow for the dynamic expansion of
animal agriculture world wide there will be a series of both positive and negative effects on a
wide range of factors including food and income security, environmental preservation and, last
but not least, health. Regarding the latter, many diseases have developed varying degrees of
resistance to anti-microbial drugs and the WHO has reported (WHO, 1996) at least 30 new
diseases that have emerged in the last 20 years. Apart from increases in world trade and traffic
it is believed that the quickening pace of emergence and re-emergence of infectious diseases
may also be associated with the growing densities of man and livestock. A recent review
(Plotkin, 1997) suggested that the multi-sectoral factors causing disease emergence means that
the present policy and legal framework to address them is largely inadequate. This is illustrated
by recent experiences in Europe with BSE-CJD, as well as infectious livestock plagues such as
foot and mouth disease and classical swine fever.
The global village
A progressive rise of global animal agriculture will have mixed effects on the socio-economic
and biophysical environments. Though medium-high input levels in peri-urban animal protein
production will become more grain costly, this may be an inescapable transition stage towards
the prevalence of higher resource use efficiencies, before economic and environmental goals
can coincide.
The expected evolution of the global agricultural landscape is likely to be accelerated by recent international trade agreements. Globalization demands increased efforts to come to grips with the complexity of interactions among economic, social and ecological processes. Where agriculture is concerned, there is a clear geographic dimension to this type of analysis. As the present work shows, the dynamics in agriculture are highly relevant in the global resource management context.
Clarifying land pressures geographically; informed decision taking
Understanding global agriculture in turn demands a comprehension of the distributions of
livestock and associated land use patterns that can allow policy makers and planners to make
informed, data driven, decisions. This implies analyzing the available data in its geographical
context, as illustrated by the preliminary work presented here. This approach can, however,
only be effective if it is based on reliable, geo-referenced data, but will allow all available
information - both remotely sensed, and that derived from more traditional types of
agricultural statistics, to be integrated and evaluated effectively.
References
Action Group on Food Security (1994). “Feeding 10 billion people in 2050. The Key Role of the CGIAR's International Agricultural Research Centers”, A Report by the Action Group on Food Security, pp. 14.
Ausubel, J. H. (1996). Can Technology Spare the Earth?, American Scientist, Volume 84, 166–177.
Bourn, D. And Wint, W. (1994). Livestock, Land Use and Agricultural Intensification in Sub-Saharan Africa, ODI Network Paper 37a, London: Overseas Development Institute, pp. 22.
FAO (1995). World Agriculture: Towards 2010; An FAO study, Edited by Nikos Alexandratos, Food and Agriculture Organization of the United Nations, and John Wiley & Sons, Chichester, England. pp. 434–435.
FAO (1996a). Livestock Geography; A Demonstration of GIS techniques applied to Global Livestock Systems and Populations; Consultant report by William Wint. Food and Agriculture Organization, Rome, Italy. pp. 77.
FAO (1996b). Livestock Geography II; A Further Demonstration of GIS techniques applied to Global Livestock Systems, Populations and Productivity; Consultant Report by William Wint. Food and Agriculture Organization. Rome, Italy. pp. 90.
FAO (1996c). Food requirements and population growth, FAO, Technical Paper WFS 96/TECH/12 Provisional version May 1996, Food and Agriculture Organization, Rome, Italy. pp. 59.
FAO (1997). Food Outlook, global information and early warning system on food and agriculture. No. 1/2 1997, Food and Agriculture Organization, Rome, Italy. pp. 22.
Plotkin, B. J. and Kimball, A. M. (1997). “Designing an International Policy and Legal Framework for the Control of Emerging Infectious Diseases: First Steps”, Emerging Infectious Diseases, National Center for Infectious Diseases, Centers for Disease Control and Prevention, Atlanta, GA, USA, URL: http://www. cdc. gov/ncidod/EID/vol3no1/plotkin. htm, Posted: February 5, 1997.pp. 11.
Shenggen Fan and Mercedita Agcaoili-Sombilla (1997). “Why do projections on China's future food supply and demand differ?”, EPTD Discussion Paper No. 22, Environment and Production Technology Division, International Food Policy Research Institute, Washington, D. C., U.S.A.
WHO (1996). World Health Organization Division of Emerging and Other Communicable Diseases Surveillance and Control, Emerging and other communicable diseases strategic plan 1996–2000, WHO/EMC/96. 1., World Health Organization, Geneva.
Yeo, A. (1996). Vaccines & pet products take worldwide honours, Animal Pharm Review of 1996, PJB Publications Ltd 1996.
E. FLEISCHHAUERA, W. BAYERB, A. von. LOSSAUC
b Consultant for tropical animal husbandry and pasture management, Rohnsweg 56 D-37085, Goettingen
1. Dealing with complexity
UNCED in 1992 marked a shift in economic and political thinking. Sustainable use of natural resources has become an increasingly important and challenging issue in planning and governance. In this context, one of the most relevant sectors is agriculture, including animal production. This is characterised by great variability and complexity, because it is highly dependent on natural prerequisites for land-use such as climate, landforms, hydrology, soils, and biodiversity of flora and fauna, as well as social and economic conditions.
The effects of a particular livestock production system on the environment cannot be viewed in isolation. Firstly, they have to be seen within the wider economic and institutional setting. The operational rules for a subsistence economy differ substantially from those for a market-oriented one with a high dependency on external inputs and services. The structure and functioning of institutions to govern economic and social processes are closely linked to the state of economic development. This is especially true for land-use rights.
Secondly, animal production is strongly influenced by socio-cultural factors such as division of labour according to gender, differences in access to resources by individuals and groups, household and local-level decision-making, and food preferences.
Thirdly, animal production depends on agro-ecological conditions. This refers not only to natural conditions, such as climate, soil, topography, or flora and fauna, but also to land improvement such as terracing or drainage. The natural properties and human activities (including animal husbandry) determine land quality. In assessing environmental impact and sustainability, evaluation of land quality is one of the most important tasks.
Box 1: Definition of land quality
Land quality is a complex attribute of land which affects its suitability for specific uses (FAO 1976, 1993; Sombroek & Sims 1995). The concept was formulated in order to avoid having to refer to a large number of individual characteristics (e. g. mean annual rainfall, soil water-holding capacity, slope) in land evaluation. Examples of land quality are availability of water, availability of nutrients, susceptibility of soils to erosion. and quality of natural timber or of grazing land. As different stakeholders use land for different purposes, there is not one land quality, but a range of land qualities (Pieri et al 1996).
Assessing the impact of animal production on the environment and tracking the sustainability of livestock-keeping systems require a methodology which allows us to take natural and economic conditions as well as socio-cultural values into account. We recommend a stepwise approach:
Box 2: Steps and tasks within the framework of assessing and monitoring environmental impact and sustainability of livestock production
Step 1: Pressure-state-response (PSR)analysis
Step 2: Environmental impact assessment (EIA)
Step 3: Sustainability assessment (SA)
Step 4: Monitoring the track towards sustainable development (SD)
2. Identifying the issues and levels of interest
The most striking issue in research and political discussion is the dualism of livestock production for human welfare. On the one hand, it is common understanding that sustainable development in agriculture must include animal husbandry for economic and ecological reasons. Livestock play an important role in rapid recycling of non-food biomass and greatly contribute to the economic stability of farming systems. On the other hand, livestock production can consume large amounts of fossil energy, waste foodstuffs and seriously impair natural resources. Both can be true. An accurate analysis needs to reveal the effects and causes in each specific case.
For evaluating the key processes in livestock-environment interactions, for EIA and SA, and for building a framework for guidance and decision making, we need appropriate sets of indicators. These will differ depending on what level we work on (farm, regional or watershed level, national, government or global level).
This is illustrated by listing some of the different objectives of animal keeping held by farm families as opposed to national governments.
Table 1: Objectives of animal keeping, held by farm families and national governments
| Farm families: | National governments: |
|---|---|
| • to produce food | • to increase the Gross Domestic Product |
| • to generate income | • to reduce imports and save foreign currency |
| • to accumulate savings | • to increase exports and earn foreign currency |
| • to provide draft power | • to create employment |
| • to provide manure as fertiliser or fuel | • to improve income distribution and alleviate rural poverty |
| • to satisfy socio-cultural obligations | • to provide cheap meat and dairy products for urban dwellers |
| • to buffer against food shortages | • to sustain resources, including biodiversity |
| • to sustain natural resources for subsequent use | • to avoid negative impact on ecosystems and to protect wildlife and flora (including transboundary effects). |
| • to be in harmony with the natural surroundings. |
The multiple uses of landscapes must also be taken into account. As an example: rangelands may be used for extensive pasture, game viewing and hunting, collecting medicinal herbs, recreation, water catchment, forest production etc. The interests of the different stakeholders must first be expressed and recognised and then reconciled as part of the land-use planning process.
With respect to the environmental impact of livestock keeping, major issues are:
• unfavourable changes in vegetation composition and structure as a result of overgrazing. In the drylands, vegetation yield may be low, not because of livestock but because of low rainfall, and vegetation may recover quickly when rainfall improves. Where grazing predominates, animals will die before the vegetation is irreversibly damaged, but supplementary feeding can result in overgrazing. This risk is much higher in mixed farming than in pastoral systems;
• nutrient flows within farming systems. This is particularly important in mixed farming systems. Some nutrients are added to cropland via manure, but this can impoverish the rangelands and may not offset the nutrient losses from cropping;
• nutrient accumulation in industrial systems, where concentrate feeds may even come from other continents. This is common in industrial landless systems and can pollute water or overload soils with nutrients. The tremendous regional imbalances jeopardise the ecological equilibrium in a way similar to pollution from heavy industry. Suggestions to focus on industrial animal production units and to spread animal wastes on fields of specialised crop farmers will face very narrow economic and ecological limits;
• transmission of disease among animals and between animals and humans. The widespread use of antibiotics, not only to prevent or cure diseases but also to promote animal growth, leads to the development of resistant bacteria and germs and may jeopardise the possibilities to use antibiotics to cure infections in humans. This is a particular risk in intensive, industrial systems of animal production. Also new diseases, such as BSE, and the increasing salmonella infections of food are mainly linked to industrial systems.
• high inputs of fossil energy and unfavourable input-output ratios. This is especially true for systems with high-yielding animals, requiring concentrates and forages produced with high fertiliser inputs. The current low price of fossil energy promotes its extensive use.
• biodiversity of flora and fauna, including that of domestic animals. Biodiversity is closely linked to eco-systems' resilience, yet understanding of these linkages is still in its infancy. With respect to domestic animals, the difference between nutritional and veterinary requirements between breeds and the subsequent difference in impact on the environment should be taken into account.
Care must be taken not to blame animal production for environmental impacts for which it is not responsible. Soil erosion and loss of biodiversity in animals and plants are often due to road construction, non-sustainable forest exploitation or mono-cropping, rather than to livestock-keeping.
Most of the issues mentioned above must be investigated on a local level. However, important decisions which affect economic and ecological development are made by national governments, e. g. regulations for land tenure and nature conservation, allocation of funds for infrastructure, or subsidies for economic and social activities. Regulations for exports are often made on an international level. These issues should not be neglected in assessing the impact of livestock at a specific site. For international negotiations and consultation (e. g. World Trade Organisation, UNCED), governments also need information about the pressures to which animals are exposed or which they exert on the environment. Finally, we should not forget that sustainable use of natural resources is a prerequisite for sustainable economic and social development.
3. Applying the Pressure-State-Response approach to screening and scoping the Environmental Impact Assessment.
Information of factors which shape economies and the precondition for their improvement must be evaluated in order to structure measures with respect to their impact on the environment and socio-economic security. This has to be done in a way that can be repeated in different settings to ensure comparability of results. The pressure-state-response approach (PSR) offers a method for screening and scoping the main aspect which should be incorporated into the assessment and monitoring of change. At the same time the results of the PSR provide a more comprehensive framework for the environmental impact assessment (EIA). The PSR approach clarifies the most important links between pressures on land quality caused by human activity on one hand and the resultant state of land quality on the other hand, including changes with respect to space and time. It also clarifies reactions of the affected groups of the population and the political and administrative institutions.
The key tasks in evaluating the available data are
A simplified PSR application for range management in the Middle East is shown in Figure 1. Great attention has to be paid to identifying stakeholders and their scope for action.
A modification to the PSR-model as developed by Adriaanse (1993) and Pieri et al (1996) includes time scales into the approach (Fig. 2) and gives an impression of the dynamics and time dimension of pressures, states and responses. Some may change quickly whereas others last over long periods. Structuring and weighing the effects in such an analysis is a prerequisite for monitoring and planning the paths to more sustainability.
4. Assessing the environmental impact of animal production on land quality and ecosystem resilience
The main areas of impacts on the environment by various types of animal production can already be identified with the PSR model. The results of a more in-depth analysis of these impacts can be summarised in an environmental impact study. From an Environmental Impact Assessment (EIA) we expect a systematic identification and evaluation of effects of either present practices or proposed projects, plans, programmes or legislative measures on physico-chemical, biological and - as e. g. wildlife reserves are concerned - socio-economic and cultural components of the human environment.
In the case of planned changes the procedure must:
It is important that causes and effects are clearly identified and also that “well-known facts” are critically examined. The “overgrazing” in the African Sahel mainly proved to be a consequence of climatic variability i.e. low rainfall in some years. There is very little lasting negative effect on the rangeland vegetation. The droughts, however, showed the importance of “social erosion” (breakdown of traditional mechanisms of coping with drought, changes in animal ownership, unfavourable changes in access to land in wetter areas), which left many pastoralists destitute.
According to our approach, EIA should concentrate on impacts of production systems on the ecology.
Figure 1: A simplified example of Pressure-State-Response Analysis (rangelands in Middle East and North Africa).
| Applying the pressure-state-response method | ||
| Pressure | State | Response |
| Land Use and Management | Pressures → Resources ← | State of Land Quality Change Initial → Modified | → | Responses by Land Users, Managers, and Policy Makers |

| Pressures | state and changes | responses | |||
|---|---|---|---|---|---|
| - | High profitability of sheep fattening | - | Uneven access to pasture (rich pastoralists favoured because of water transport by truck which allows use of areas far from water points, whereas poorer pastoralists are restricted to areas closer to water points, which are more heavily grazed) | - | Breeding of more drought resistant crops |
| - | Cheap, subsidised concentrates | - | Decreasing plant cover and decline of palatable species | - | Removal of subsidies for concentrates |
| - | Attempts of state to settle nomads | - | Breakdown of traditional land use rights | - | Attempt to introduce group land rights, which restrict pasture users and season of grazing |
| - | Introduction of tractors and trucks | - | Breakdown of natural checks on animal numbers (e. g. seasonal lack of water, increased incidence of disease in areas with high numbers of livestock) | - | Protecting key areas so that indigenous plants can survive |
| - | Increasing human population | - | Many areas under cereal cultivation (with high cropping risks and therefore low inputs, land mining) | - | More law suites because of illegal cropping brought to court |
| - | Higher standard of living and less intensive use of animals (wool and meat only, milk less important) requiring more animals per family | - | Decreasing profitability of sheep fattening | ||
| - | Many alliances between traders (rich town people) and traditional leaders | ||||
 | |||||
Figure 2: Modified “Pressure-State-Response” Analysis
| Time scale | Pressures | States | Responses | ||
|---|---|---|---|---|---|
| t-n | natural catastrophes wars, famines | → | LQ characterised by historical forms of sustainable land use and land degradation | → | differentiation of land tenure, change of traditional land-use practices |
| ↓ |  | ↓ |  | ↓ | |
| t | population increase poverty damaging resources | → | LQ affected by intensification (both nutrient mining and nutrient surplus), land degradation | → | technologies with high fossil energy inputs (e. g. import of feed grain from U.S.A. as animal feed), migration; change of land tenure and land-use, strengthening of stakeholder participation, international financial and technical assistance |
| ↓ |  | ↓ |  | ↓ | |
| t+m | shortage of capital, unfair distribution of resources and income | → | LQ characterised regional differentiation in advances in sustainability, ecological resilience at risk. | → | advances in education and agricultural extension, development of alternative land-use, information technology, division of labour, more democratic decision making, international co-operation |
key: LQ Land quality, => effects/modification,
Source: Adriannse, 1993, Pieri et al 1996, modified
Box 3: Prognosis of impact of water development on rangeland use in Southern Somalia.
Purpose: Assessment of impact of planned government boreholes on future range utilisation, as aid to decide on financial support in 2 southern Somalian regions. The water project was planned to allow better pasture utilisation.
Methods: Use of livestock statistics to estimate grazing pressure; use of rainfall data to estimate potential vegetation yield; use of satellite imagery to determine geophysical units and settlement pattern. Use of maps and observation to estimate distances between existing water points, interviews with pastoralists to get their perception of the environment and information on capacity and organisational aspects of use of existing water points.
Results: Livestock population: camels, goats, sheep and cattle. Livestock numbers indicate that pastures are heavily used in all but very wet years. For dry years feed shortage predicted (also mentioned by pastoralists). Existing network of water points (spring, shallow wells, natural depressions, dams to collect surface water, rivers) is such that pasture can be used (at least by camels) year-round, if there is feed. Heavy use of vegetation evident around water points. Degraded area dependent on capacity of water point. When water point is abandoned, evidence of quick recovery of vegetation. Traditionally access to pasture controlled by access to water. Traditional watering practices (use of wooded troughs and wooded containers to transpo rt water) exerts some pressure on environment (cutting trees to make containers. ) However most areas still rich in trees (and wildlife). Also on some water points contamination of water by faeces and urine from animals. Introduction of additional water points would undermine traditional control of pasture, encourage speculation and potentially lead to pasture degradation.
Recommendations: change of project design, respecting traditional water rights, some minor adjustment on
design of water points to prevent contamination, advice against additional water points.
Source: Salzgitter Consult 1989.
Generally, a difference can be made between indicators, for which a threshold value can be defined and those for which norms have to be defined. An example for threshold values is the nitrate in drinking water, although the threshold value approach can orient itself at international norms e. g. those of the World Health Organisation (WHO). However, as experience shows, even that is a very political question and needs to be negotiated.
An example of “norms” which have to be defined by stakeholders is the vegetation under grazing. This is closely linked to “land quality”. The vegetation we aim for depends on intended use and has to be defined accordingly.
Table 2 lists some issues, indicators and methods of measurements which can be used in EIA. This list is by no means comprehensive and some of the indicators are open to debate. For an EIA the list of issues and the number of indicators has to be more comprehensive than for monitoring. For monitoring purposes only few indicators can be selected, which should be easy to measure and to interpret.
5. Formulating objectives for sustainable livestock production
The results of the PSR analysis and of the EIA have to be combined into an overall assessment, which has to include consideration of sustainability. Sustainable use of natural resources implies a way of resource use, that does not exhaust resources and leaves them for subsequent generations. “The impact (I) of any group of people on the environment can be viewed as the product of population (P) multiplied by the per-capita affluence (A) as measured by consumption, which in turn is multiplied by a measure of the damage done by the technology (T) employed in supplying each unit of that consumption” (Hardin 1992).
Table 2: Some issues, indicators and methods of measuring indicators for EIA of animal production
| Issue | Indicators | Methods of measuring |
|---|---|---|
| Unfavourable change of vegetation | composition of vegetation, indicator plants, ground cover | evaluation transects/quadrates to measure frequency, estimate of ground cover within quadrates, transects |
| Nutrient flows within mixed farming systems | nutrient budget, water pollution, indicator plants | calculation of nutrient flows, chemical analyses, measuring frequency |
| Nutrient accumulation in industrial systems | nutrient budgets, water pollution, indicator plants | calculation of nutrient flows, chemical analyses, determine frequency of indicator plants |
| Transmission of disease among animals and between animals and humans | frequency of occurrence of disease, number of infected vectors, occurrence of resistant germs | veterinary statistics, epidemiological studies, post mortem of animals, surveys, laboratory analyses |
| Inputs of fossil energy and unfavourable input-output ratios. | energy budgets, input/output ratio-calculations | model calculations, some measurements to complement/verify models |
| Biodiversity of flora and fauna, including of domestic animals | composition of flora and fauna, indicator animals / plants, diversity of land-scape, species/breed composition of domestic animals | observations and systematic enumeration of animal/plant population, mapping of landscape elements, population analysis |
The direction of the most pressing actions for enhancing sustainability can easily be derived from the formula I = P × A × T. In developing countries, with low per capita consumption, but high population growth, the main thrust should go into reducing population growth, since every progress in reducing the damage done to the environment by (T) will be offset by increases in (P). On the other hand, in industrialised countries with low population growth yet increasing affluence (A), the main thrust has to be on reducing consumption of resources or the (T). This is especially true for per capita consumption of fossil energy. Furthermore recycling of raw material and reduction or avoidance of waste is called for. To promote this we may have to change our definitions of “economic growth” and “economic development” to focus on sustainability and sustainable development. The definition of land use should be extended and include settlements, transport routes and other use of land which can affect the ecological functions of an area. Sustainability also raises the issue of the permissible extent and the necessary distribution of various kind of land-use in the light of ecosystems' resilience.
Sustainability is not a state which once reached, will last for ever. Sustainable management of natural resources has to be understood as a process and as a continuos challenge. During this process environmental, economic and social objectives have to be taken into account (Box 4).
Box 4: Five pillars of sustainable land management
Sustainable land management combines technologies, policies and activities aimed at integrating socio-economic principles with environmental concerns in order to simultaneously:
The objectives of productivity, security, protection, viability and acceptability can be called the pillars of sustainable land management and must all be met, if sustainability is to be achieved. Meeting only one or several but not all, will result in only partial or conditional sustainability. Source: Smyth and Dumanski 1993.
Some specific objectives for animal production in relation to sustainability are:
Where grain is used, it should mainly be as a buffer in years of good harvests or when grain stores for human consumption have to be renewed.
Within the overall land-use system some land may be set aside as nature reserves, where natural flora and fauna can find a refuge. It is important that endangered species are not only protected as species but are protected within their habitat. With respect to nature conservation there is a marked difference between a livestock farm, where wildlife may be fed and simply takes the place of domestic animals in damaging the environment, and a true nature reserve, where habitats are protected and animal populations are restricted according to natural carrying capacity. Areas with limited use may also play a vital role in maintaining the water cycle, or provide space, where valuable species can survive, and later recolonize other areas.
There are few situations where all these objectives are achieved. In most situations it is advisable to identify elements of the livestock production system which are non-sustainable, and tackle these to strengthen the process of sustainable natural resource management.
6. Monitoring the track towards more sustainability with appropriate indicators
According to the five “pillars of sustainability”, indicators for monitoring can be divided into the following groups:
Productivity indicators are a measure of efficiency per unit input of labour, production factors, or investment.
Stability indicators serve as measurements for changes and refer to mainly physical issues. The stability indicators should provide information on the normal variation and fluctuations e. g. due to climatic variations but also of trends. Stability has to be seen in connection with resilience. Resilience indicators should show how a farming system can deal with stress (e. g. drought, floods, disease outbreak).
Protection indicators should show how vital ecological functions of a landscape are, such as the water cycle, the soils, or the biodiversity change. Many indicators shown in table 2 can serve as protection indicators.
Economic viability indicators are based on fairly standard economic calculations to show gross margin or profitability. In short-term it is profit, but medium- to long-term it is economic stability which matters.
Indicators for fairness of the distribution or equity depend very much on perceptions of local people. However, the contact with decision-making outsiders can be very selective, and therefore outsiders have the responsibility of knowing with whom they interact. Equity indicators can also refer to how various economic and social groups (crop farmers, pastoralists, large herd- or landowners, women, young people) are favoured or promoted by advice and support in the use of productive technologies (Guiterrez 1994, Müller 1996).
Who benefits from PSR, EIA and sustainability assessment and the use of appropriate indicators? - As can be expected the benefits meet very heterogeneous target groups. Some beneficiaries and potential benefits from information derived from PSR, EIA and SA are:
Farmers/Pastoralists: makes people more aware of the state of environment, facilitates comparison of their own problems and performance with that of neighbours and friends. May give indications of potential solution for local problems.
Local self-help groups and NGOs: gives arguments for supporting people in their struggle to improve economic productivity and ecological security and to oppose inappropriate interference in the local environment.
Extension services: helps creating more awareness of environmental problems and facilitates comparing farmers' perception of problems with that of extension services. May give guidance in revisions of recommendations.
Researchers: pinpoints gaps in information. May help to make research more relevant for local people. Helps evaluating the effects of new technologies on ecological, social, and economic sustainability.
National/International NGOs/Environmental pressure groups: gives them better founded information on relevant environmental issues in order to revise their own position and to put pressure on government and the international community to change rules and regulations and project support in order to encourage sustainable development.
Policy makers, administrators and donors: helps to evaluate effects of own policies and programmes. Gives inputs into reformulating policies; possible impact on legal structure (e. g resource tenure regulations).
7. Need for improving assessment methodology, data generation and dissemination of information.
The assessment and monitoring of the process of sustainable livestock development not only needs carefully selected indicators, it also calls for a reference system of desired values and of thresholds for critical developments. Indicators should not be developed by specialists in isolation, but should be developed with the stakeholders (farmers, other land users, extension agents, researchers etc. ). Outside specialists will not only have to provide their specialist knowledge but may also have to act as facilitators in the process of negotiation for defining appropriate indicators.
Over the last few years a number of approaches for EIA, including for agriculture, have been proposed, but few have been extensively used in practice. The concept of sustainable resource management as a mainstream concept is little more than a decade old. Sustainability proved to be a very important but bulky concept, and it is only now that more progress is made in making it operational. As already shown in the PSR analysis, the time dimension needs much more attention. Furthermore the problems in animal production are so divers that a single blue print for assessment procedures is hardly feasible. We recommend a process approach. The basic concepts, as outlined, should be clear and, depending on the severity of the problems and the data available, a more or less comprehensive analysis should be carried out. In many instances, it is important to start the process of PSR, EIA and sustainability assessment. If monitoring proves to be somewhat inadequate, it can always be improved and expanded. However, like with other data collection exercises, it should be clear why particular data are collected, who is going to analyse and use them. Large data cemeteries are of no help to anybody.
In some areas even very basic data, such as rainfall, are presently not readily available for planning. PSR, EIA and sustainability assessment will to a large extent always have to rely on secondary data (e. g. meaningful rainfall series should include a complete set of data from at least 30 years). The available data should be collected in regional (district/provincial) data bases and be readily accessible for planning purposes. This also includes data on vegetation, animal populations etc.
The results of impact studies should not be shut away in reports or scientific journals, but communicated better to the public. This should not be restricted to “bad news”, but also serve to correct misconception, like the misconception about rangeland degradation in pastoral areas in Africa. This could be done by approaching international journals (e. g. National Geographic), national journals in both industrialised and developing countries, television or international, national or regional radio transmission.
As already stated the problems in livestock x environment interactions and their causes are very divers - depending on eco-region and production systems. The amount of information available (and the level of concern, as shown in the e-mail conference preceding this “face-to-face” conference) is such that a global virtual network would be very difficult to handle, both for organisers and users. We suggest that regional networks are supported, e. g. one for intensive production in industrialised countries, one for range management in Africa etc., Existing structures such as UNSO, the Club du Sahel or the dryland programme of IIED should as far as possible be used for such purposes. If necessary, they should receive additional support from donors, rather than new structures being set up.
8. References
Adriaanse, A. (1993) Environmental policy performance indicators - A study on the development of indicators for environmental policy in The Netherlands; The Hague.
Barret D. F. D., Therivel R. (1996) Environmental policies and impact assessment in Japan. Routlegde, Chapman and Hall, New York
Becker B. (1997) Sustainability assessment: a review of values, concepts and methodological approaches. CGIAR/Worldbank, Washington D. C.
Canter, L. W. (1996)) Environmental Impact Assessment; Singapore,
Defoer, T., Kante S., Hilhorst Th., De Groote H. (1996) Towards more sustainable soil fertility management. ODI Agriculture Research & Extension Network, London
Food and Agriculture Organization (1976) A framework for land evaluation. FAO Soil bulletin 32. FAO, Rome
Food and Agriculture Organization (1993) Guidelines for land-use planning; FAO, Rome,
Guiterrez E. (1994) The approximate sustainability index: a tool for evaluation national performance. Paper presented at the Network Seminar on sustainable development indicators. ODI, London.
Hammond, A., Adriaanse, A., Rodenburg, E., Bryant, D., Woodward, R. (1995) Environmental Indicators: a systematic approach to measuring and reporting on environmental policy performance in the context of sustainable development. World Resources Institute, Washington D. C.
Hardin G. (1992) Living within limits - ecology, economics and population taboos. Oxford University Press, New York.
Müller S., (1996) How to measure sustainability: an approach for agriculture and natural resources. Inter-American Institute for Cooperation on Agriculture (IICA)/ Deutsche Gesellschaft für Technische Zusammenarbeit (GTZ).
Pieri, C., Dumanski, J., Hamblin, A., Young, A. (1996) Land Quality Indicators. The World Bank, Washington D. C.
Salzgitter Consult/German Water Engineering (1989) Study on waterpoints in Gedo and Bakool Regions, final report. Salzgitter/Lingen.
Smyth, A. J., Dumanski, J. (1993) FESLM: An International Framework for Sustainable Land Management. Food and Agriculture Organization (FAO), Rome.
Sombroek, W. G., Sims, D. (1995) Planning for sustainable use of land resources: Towards a new approach. Food and Agriculture Organization, Rome.
DAVID WALTNER-TOEWS, N. O. NIELSEN
University of Guelph, Guelph, Ontario, Canada NIG 2W1
The roles of livestock in agricultural economy, culture and ecology are complex and vary according to specific contexts around the world. Several authors, including those of the background report for this conference, have identified and discussed many of these roles, and it is not our intent to recount them (Steinfeld et al 1997). It is widely recognized in these discussions that livestock are not raised for their own sake, but to meet interacting, and sometimes conflicting, human nutritional, economic and environmental needs. For instance, as part of an IDRC-funded research project on human disease problems associated with intensive livestock slaughtering practices along the riverbanks in Kathmandu, it has become clear these cannot be seriously dealt with without also addressing issues of community empowerment, rural-urban migration, globalization of the economy, energy and water use for non-agriculturally-related activities, and changes in nutritional habits and culture.
Having said this, it is also clear that there is a paucity of conceptual and methodological tools to do the inter- and transdisciplinary work necessary to address such complex interactions. Agroecosystem health represents a theoretically and practically coherent approach to research and management of the full range of issues - from human nutrition and health to economic adaptability and ecological integrity - which must be addressed if workable policies and management strategies incorporating livestock are to be developed. Drawing on a diverse body of systems and management literature, and building on experience related to veterinary herd health management and human population health and healthy communities, agroecosystem health pulls together research and management into a seamless process of sustainable learning and adaptation.
Agroecosystem health - the concept
Agroecosystem health management comprises at least five (not necessarily linear) steps: 1) a description of the agroecosystem in systemic terms; 2) identification of decision-makers and/or stakeholders; 3) establishment of goals, that is, perceived attributes of a healthy system, operational objectives related to those goals at various scales and time horizons, and determination of measurable indicators which will give information about whether or not those objectives are being achieved; 4) identification and implementation of desirable and feasible changes, which often involves resolving conflicts among goals set by different decision-makers at different levels; and 5) monitoring of the selected indicators, and adapting to changing circumstances or unexpected or undesirable outcomes. This may mean revisiting the description of the system, the objectives selected, and the management options chosen.
Agroecosystem health management should be distinguished from what one might call agroecosystem medical practice. While diseases and dysfunctions, the focus of medicine, are important both as stressors on the system and as indicators of system dysfunction, they are not in themselves the focus of health management. Medical practice, responding to specific problems, requires analytic and diagnostic skills in support of expert decision-making, assuming a stable systemic context. The intent is to identify what is undesirable and fix it. Health management, responding to a situation in which multiple problems and opportunities are connected in a web of interactions, is an integrative activity which draws on an understanding of historical development and desired futures to facilitate adaptive decisions about overall system management. The intent is to identify what is desirable and enhance it.
The application of health approaches to issues of environment and economy in agriculture enables us to draw on a strong tradition of dealing with the integration of science and practical management. Although the application of health concepts to the multi-level complexity of agroecosystems presents some unique challenges, those of us who have worked with health and disease in individual animals, herds, farms and communities, do not see these as being insurmountable.
The great strengths of applying health ways of thinking to agroecosystem evaluation are that it requires: 1) integration of the biophysical and socioeconomic dimensions of the problems being investigated, from nutrition and food security, to education and empowerment of women, to the protection of watershed integrity; 2) integration of research and management, which are viewed as being part of the same process of intervention and evaluation; and 3) bridging analytical/ diagnostic (medicine) and integrative (health management) issues, where particular problems are re-interpreted in systemic terms. Furthermore, the language of health is a language of public discourse which enables us not only to bridge the gap between science and management, but to involve the public we serve in the definition and resolution of these complex socio-ecological issues whose scope is clearly beyond the expertise of any particular group.
Agroecosystem health management: the practice
1. Describing the system
Agroecosystems are inherently multi-level. Fields are nested within farms, which are nested within rural communities and sub-watersheds, which comprise larger watersheds, bio-regions, and so on. This kind of a nested hierarchy has been called a holarchy, and the things which are nested are called holons. This provides a general terminology for talking about these kinds of systems. These holons, having definable boundaries, are interdependent at each scale and across scales. They are thus both necessarily bounded and leaky; indeed, one management goal of agroecosystem health is to maintain adequate boundaries without stifling interchange. This holarchic view of agroecosystems has become widely accepted as it is recognized that farmers make decisions in particular contexts, and that those regional contexts must be defined and managed in such a way that appropriate decisions can be made at the local level.
Any particular level in an agroecosystem may be viewed externally or internally. An agricultural community, may be viewed in terms of its internal needs and dynamics, or in terms of its relationships with the larger region in which it is situated.
For example, colleagues who are working with us on a joint CIAT-University of Guelph project on complex systems approaches to tropical agroecosystems (Rowley et al 1997) have identified important questions with regard to in- and out-flows of useful energy, materials and information. This is an external view, enabling us to study, for instance, the steepness of the gradient of useful energy across the system, that is, the size of the difference between inputs and outputs at farm, community or national levels. This enables us to identify whether this system is dependent on massive inputs, one measure of capacity to respond to future stressors.
By looking internally, we are able to determine how various operational objectives (for instance, minimization of risk, maximization of income) and activities to achieve those goals, (rotations, mixed systems, contract selling) can, or might, contribute to the development of sustainable, self-organizing structures in the local ecosystem. That is, are economic activities related to natural resource use contributing to the build-up of local capital? Once this is described, we can begin to look, for instance, at how various livestock roles affect these structures.
By exploring the holarchy within which these activities take place, one can begin to delineate temporal as well as spatial constraints, opportunities and the costs of change. For instance, income may be generated daily, at a household level, from livestock slaughter, but cumulative negative impacts on water quality may take a generation to accumulate at a watershed level, with catastrophic consequences. Individual farmer bankruptcies may appear as “noise” when measured in terms of national trends and averages, but may be tragic for individuals and families
Another way to assess agroecosystems externally at a particular level is to create attractor models in several dimensions. This is based on the observation that many socio-ecological systems fall into a few patterns of behaviour and resist pressures for change. In some cases, these appear to represent what my colleague Gilberto Gallopin of CIAT has called “perverse resilience”, leaving communities in states of economic stagnation and environmental degradation despite our best efforts. In other cases, agroecosystems appear to resist such degradation. If conceptual models of such attractors can be created, we can begin to identify their determinants. These are similar to what have been called determinants of health in the population health literature.
2. Identification of responsible decision-makers and stakeholders
Agroecosystems may be described in terms of at least two different kinds of holarchies: a biophysical one (animals, herds, subwatersheds), and a socio-economic one (individuals, families, communities, and countries). This is problematic, but not fatally. In most real world situations, some practical accommodations can be made which allow one to envisage the system in terms of the particular holarchy which is most important for decision-making on a particular set of issues. In most agroecosystems, farms and rural communities tend to represent important levels of decision-making with regard to both ecological and socio-economic issues.
In order to successfully implement an agroecosystem health management program, one must have a reasonable idea of power relationships within and across levels. Herd health programs have been remarkably successful because there is a well-identified manager who can set goals. At the community and regional levels, issues of governance are more problematic.
Institutional and stakeholder analysis can be carried out to determine who should be at the table, and how to involve them while recognizing political and economic power differentials.
Once the appropriate participants are recruited, participatory action research methods can be employed to facilitate the articulation of appropriate goals and objectives, given the constraints and opportunities identified through research. In many cases, conflict resolution and negotiation skills and multi-objective programming expertise may facilitate this process.
Some researchers have found influence diagrams, or signed diagraphs (Caley & Sawada, 1995) to be helpful. These identify feedback loops which re-inforce or weaken particular system states, and clarify who has the power to influence those connections. In these diagrams, which some have termed “spaghetti diagrams”, various components of the system are connected by arrows which are labelled as positive if they co-vary in the same direction, or negative if they co-vary in opposite directions. For instance, a line between income and meat-eating might be positive, while that connecting water quality with human disease would be negative. By examining these diagrams one can determine whether particular relationships are likely to be amplified or dampened when changes are made; when time-lags are considered, one can determine whether to expect stabilization or oscillation of patterns. In the context of such diagrams one can begin to understand why, for instance, the education and empowerment of women might have a greater long-term effect on the health of agroecosystems (both directly through increasing available knowledge to the system and indirectly by decreasing demands on the system through self-directed population control) than technological interventions which may appear to be more attractive in the short run.
In some cases, new organizations can be created to bridge economic or political jurisdictions. The International Joint Commission for the Great Lakes is one such example, but there are many other economy-environment round tables and non-governmental multi-stakeholder groups that have emerged throughout the world in the past few years, at levels ranging from local communities to the biosphere.
Whereas one branch of agroecosystem health management is based on a scientific description of the system, this cannot proceed without reference to the other branch, the articulation of what kind of system is considered to be desirable by decision-makers and stakeholders (Boyle et al 1996).
3. Setting goals and operational objectives, and selecting indicators
Having set out a holarchy and several dimensions, one must derive some criteria by which one may judge health. Most definitions of health combine a notion of a harmonious balance (measured in terms of the current functioning of the system) and the notion of capacity to achieve some goals (often measured in terms of various forms of social, economic or natural capital) (Waltner-Toews & Wall 1997). In general terms, one may ask the question: are the quality and quantity of internal and external resources sufficient, and is their organization appropriate, for the agroecosystem to meet its goals (Waltner-Toews & Wall 1997)?
Since agroecosystems are human re-arrangements of ecological systems, these goals are fundamentally human ones reflecting a desire to enhance the quality of life for ourselves and our descendants. Even the desire to maintain biodiversity can be seen as a way of protecting future options for human community development. In general, one moves from articulating general goals, to setting operational objectives, to selecting measurable indicators which can be used to assess progress.
Some of us have found it useful to place our various research and management activities into a cubic framework, with axes representing scale (farm, community, region), dimension (biophysical, social, economic) and health goals (equity, quality of life). With this as a starting place, we can begin a more rigorous process of identifying within and across scale contradictions and possible goal conflicts.
What emerges from this combination of holarchic system description and goal-setting by decision-makers is a process which incorporates the participation of farmers, communities and regional governing organizations in defining and monitoring the health status of the system of which they are a part. Because the capacity to adapt to unpredictable future changes is an essential part of health, and local empowerment is an element in this capacity, selection of indicators a priori by outside experts is counter-productive. The operational objectives which reflect agroecosystem goals, and indicators which measure their achievement, can only be identified through a process of negotiation among those who live in and/or have a stake in the health of those agroecosystems.
The role of researchers and agroecosystem health practitioners in this context shifts from the conventional view of experts giving advice, to that of facilitators helping to explore the possible consequences of alternative choices.
Based on the models used to describe the agroecosystem, communities may be able to better identify programs whose indirect effects are more beneficial than programs designed around more obvious, short-term, direct outcomes. For instance, the occurrence of malaria in northern Honduras and of parasitic zoonoses in Kathmandu might both be functions of inappropriately simple policy goals related to increasing income through agricultural production. On the other hand, some resource-poor communities have survived major stresses because they have been able to translate even minimal economic activity and available natural resources into building up a crucial third variable - local social and economic capital. The use of cover crops to feed livestock in mixed farming systems in Central America may have implications for relationships between men and women in families, between national goals for increased cash cropping versus local goals for food sufficiency, and between low-priced American corn and traditional corn-cover-crop systems.
In all these cases, the complex feedback loops identified in the models may help to guide intelligent, multi-level management programs and policies with verifiable outcomes.
Nevertheless, all of these methodological tools are merely aids to better understanding and more intelligent decision-making. They do not lead to expert knowledge and control, but to a more deft handling of uncertainty and change.
4. Implementing desirable and feasible changes
In conventional herd health or community health programs, the articulation of goals and objectives is seen to represent the transition from research to management. Science is descriptive and goal-neutral. Scientists can describe several states for a given socio-ecological system, but have no basis for preferring one over another. Furthermore, because of the complex feedback loops over various temporal and spatial scales, and because people are inside agroecosystems, it is neither ethically desirable nor scientifically feasible to run controlled experiments which test single hypotheses.
For instance, one might define a hypothesis related to more efficient production of beef. This might lead someone to study economies of scale, concluding that these result in major cost savings to the producers. However, such systems, focusing on internal efficiency, lead to recycling of wastes within the system. On the one hand, this results in larger volumes of cheaper meat, albeit with high energy subsidization; on the other hand, this marginalizes more farmers, disrupts and often destroys rural communities, produces more large volumes of point-source waste, and creates unprecedented ecological opportunities for foodborne pathogens such as Salmonella spp, E. coli and prions.
Because hypotheses about agroecosystem health relate to the system as a whole, they are necessarily complex and multi-faceted. Patterns of self-organization to which the system is drawn are strongly determined by the goals and their implementation. With global markets, facilitated through road-building and transport changes, applying increasingly steep gradients to local agroecosystems, single-goal attractors are almost invariably fatal attractors. In seeking to maximize achievement of a single goal, all the unstated goals like equity, democracy and sustainability are critically undermined. Furthermore, there may be no stable optimal solution, but a series of approximations. 1
It is at this stage of deciding on appropriate management programs that it becomes necessary to facilitate negotiations between various decision-makers to accommodate goals that may be conflicting. The creation of platforms for negotiation (Roling, 1996) or other fora is thus an essential part of agroecosystem health management.
5. Monitoring and adaptation
The monitoring of indicators, reflecting goals and objectives set by decision-makers and stakeholders through process of negotiation informed by science, is the most feasible way to test agroecosystem health hypotheses. Management, in this context is research; management programs are essentially “natural” experiments which should be designed and monitored as rigorously as any laboratory experiment. Agroecosystem health management demands that decision-makers become part of the research process, and that new programs at various scales be formally implemented in a way that allows for monitoring and adjustment. By incorporating human communities into the research process, by negotiating trade-offs between multiple goals, and by making policy and management changes part of the research process, agroecosystem health management is simultaneously research and management. One is not left, in the end, trying to sell experimental results to recalcitrant farmers or policy-makers.
Agroecosystem health management, being both participatory and structured in a looping fashion which mimics the system itself, does not result in a single definable outcome. In this, agroecosystem health management is quite unlike a simple experimental approach which asks a simple question under controlled conditions and receives a simple answer, or industrial management, which may focus on a simple outcome such as producing more pigs more cheaply. This may be frustrating to those of us used to well-defined experiments and business managers accustomed to the stable world of the 1960s and 1970s. Many executives of multi-enterprise corporations, however, have already recognized the significance of similar approaches in devising adaptive strategies to a rapidly changing world. It is none too soon for public institutions to follow suit. The outcome of this approach is a sustainable web of learning organizations, from farms to communities to global institutions, which are capable of acting, monitoring and adapting in a world characterized more than anything by perpetual change.
The contributions of animals to a sustainable biosphere, whether positive and negative, economic, cultural or ecological, cannot be determined by looking at the animals themselves, in terms of livestock production systems or animal populations. The values of animals are determined by the ways in which they interact with the full, complex socio-ecological context in which they are found. Agroecosystem health management is a way to put questions related to livestock, the environment, and human needs into a larger context in such a way that human activities can be structured to the benefit of all.
Acknowledgements
The authors wish to thank the International Development Research Centre (IDRC, Ottawa), the International Livestock Research Institute (ILRI, Nairobi), the Centro International de Agricultura Tropical (CIAT, Cali), and the Canadian International Development Agency (CIDA, Ottawa) for their support for various aspects of this work. We are also indebted to our colleagues on the Agroecosystem Health Project at the University of Guelph (1993–1996) for several years of fruitful debate on these issues. More recently, these ideas have benefited from an international workshop at the CIAT in Cali Colombia in May 1997. Organized as part of the CIAT-University of Guelph agroecosystem project, participants included project researchers (D. Waltner-Toews, G. Gallopin, T. Rowley, E. Raez-Luna); scientific advisor James Kay from Canada; and other researchers from Canada (H. Regier, S. Slocombe, M. Boyle), Italy (M. Giampietro, G. Pastore), Peru (M. Ara, H. Guerra Flores, R. Labarta Chavarri, J. E. Musso Marcovich), the U. S. (C. Restrepo) and CIAT (R. Best, S. Fujisaka, E. Veneklaas, R. Knapp, F. Holman and M. Winograd)
References
Boyle, M., Kay, J. J., Pond, B. 1996. State of the Landscape Reporting: the development of indicators for the provincial policy statement under the planning act. Ontario Ministry of Natural Resources, Maple, Ontario.
Caley, M. T. and Sawada, D. 1995. Mindscapes: the epistemology of Magoroh Maruyama. Gordon & Breach Publishing, Newark.
Roling, N. 1996. Towards and interactive agricultural science. European J of Ag Ed and Extension 2: 35–48.
Rowley, T., Gallopin, G., Waltner-Toews, D. and Raez-Luna, E. 1997. Developing an integrated conceptual framework to guide research on agricultural sustainability for tropical agroecosystems: CIAT-University of Guelph Project. Ecosystem Health. In press.
Steinfeld, H., de Haan, C., Blackburn, H. 1997. Livestock, environment, and human needs. Discussion paper for livestock-environment conference
Savory, A. 1988. Holistic Resource Management, Island Press, Covello, California.
Waltner-Toews, D. and Wall, E. 1997. Emergent perplexity: in search of post-normal questions for community and agroecosystem health. Soc Sci & Med. In press.
![]()
![]()
![]()