


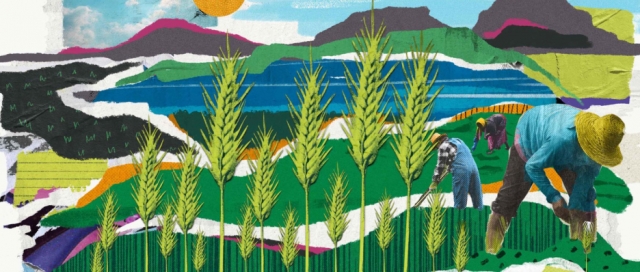
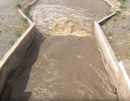
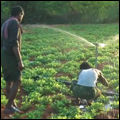
 FAO works to promote coherent approaches to sustainable land and water management.
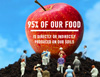
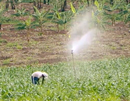
FAO's work in land and water is relevant to several dimensions of sustainable development, such as the governance and management of food production systems; the provision of essential ecosystem services; food security; human health; biodiversity conservation; and the mitigation of, and adaptation to, climate change.

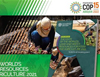
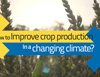
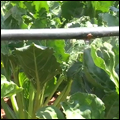
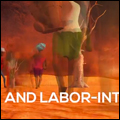
The State of the World's Land and Water Resources for Food and Agriculture 2025 (SOLAW 2025): The potential to produce more and better
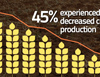
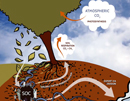
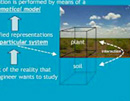
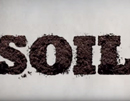
The report presents the status of land, soil and water resources, and practical actions and solutions for their sustainable use and management, illustrated with examples. It also identifies the key enablers required to scale up these transformative solutions for lasting impact to build more efficient, inclusive, resilient and sustainable agrifood systems. [Read more...]


Contact us
For more info please contact: [email protected]