![]()
![]()
![]()
3.1 Overview of the computer simulation model
3.2 Specification of forage on offer and animal activity
3.3 Algorithms simulating biological processes
3.4 Herd management policy options
Computer simulation of biological systems requires two basic simplifications. First, a system's processes have to be approximated with mathematical expressions involving only the subset of all possible variables that can be identified as determinants of each process. Second, although the links between the different interrelated processes of the system are time-continuous phenomena, they must be specified in discrete time-steps.
A plethora of explanatory variables might be suggested on theoretical grounds as determinants of the outcomes of a complex system. However, if they are to be incorporated in a mathematical model they must be readily measurable, with some known degree of accuracy, and their individual impact on the system must be well understood. For example, the quality and quantity of forage on offer, animal- activity and the physiological status of animals can be used as the major determinants of voluntary feed intake. Other factors, such as environmental temperature, humidity, palatability and toxicity, are known to play some role in influencing intake, but their quantitative impacts on intake are not adequately known. Thus, they are excluded from the simulation of forage intake.
The selection of an appropriate time-step is also determined by practical considerations. A short time-step, say 1 day, would require the detailed quantitative description of numerous micro-processes which might not be important in explaining the system's evolution over longer periods, which are more relevant in practical terms. A short time-step also requires a correspondingly frequent collection of a large volume of field data. However, such frequent data collection is generally not possible, or even justifiable. Finally, a short time-step substantially increases computational requirements. These increased requirements will pose some limitation on the use of a stochastic model as large and complex as the one presented here, even given the high speed of modern computers.
Based on these considerations a time-step of one month was chosen for the model. Herd-level field data are often collected at monthly intervals, so the use of this time-step facilitates model validation. Furthermore, a monthly time-step is generally adequate for the specification of management practices, such as breeding season, weaning age and supplementation.
The transition in the status of each animal from one calendar month to the next during the simulated time period is determined by the set of biological processes and decision rules embedded in the model. These are summarized in Figure 3.1. At the beginning of each month of simulation, the model determines the forage quality and quantity on offer and the activity level of animals in the herd. Forage on offer is simulated independently, based on historical time-series data. The details of the forage component of the model are elaborated in Section 3.2. After determining the forage on offer, the model determines the changes taking place in each animal's status during the month of simulation, using endogenous biological processes regulated by exogenous management policies. Each animal in the herd is processed independently, except for cows with suckling calves. Suckling calves secure at least a fraction of their energy intake in the form of milk from their dams, and the balance between energy demand and energy requirements is determined simultaneously for the cow and her calf to avoid over- or undercharging the energy costs to either of them.
Five general components in the model account for changes in the biological status of animals in a month of simulation: these are the forage intake, energy requirements, production and growth, reproduction, and mortality. The algorithms determining forage intake are based on the analytical relationships presented in Section 2.1, adjusted to specific systems by the procedure elaborated in Section 3.3.1. Similarly, energy requirements for the different body functions are obtained from the relationships given of Section 2.2, depending on the level of each activity.
Intake of feed energy is exactly balanced by its utilization for maintenance (plus pregnancy and lactation as required) and weight gain or loss. Separate production and growth algorithms are used to determine liveweight changes for adult males, calves and non-lactating cows, as well as milk production and liveweight change for lactating cows. As shown in Figure 3.1, the level of production and growth for individual animals may be influenced by exogenous management practices such as supplementary feeding, calf weaning, milk offtake and responses to drought. The details of the production and growth algorithms are elaborated in Section 3.3.2, and those of supplementary feeding, milking, weaning and drought options are described in Sections 3.4.1, 3.4.2, 3.4.3 and 3.4.7.
The reproduction component of the model determines whether a non-pregnant cow conceives or a pregnant cow calves during a given month. Conception is modelled as a probabilistic process, qualified by the distinction between heifers and mature cows. Conception is influenced by nutritional status and management practices, described as breeding policy in Figure 3.1, specifying the breeding season and a minimum weight and/or age to be attained before animals are bred. Details of the reproduction algorithms are presented in Section 3.3.3, and those of breeding policy in Section 3.4.4.
Figure 3.1 Basic components of the model
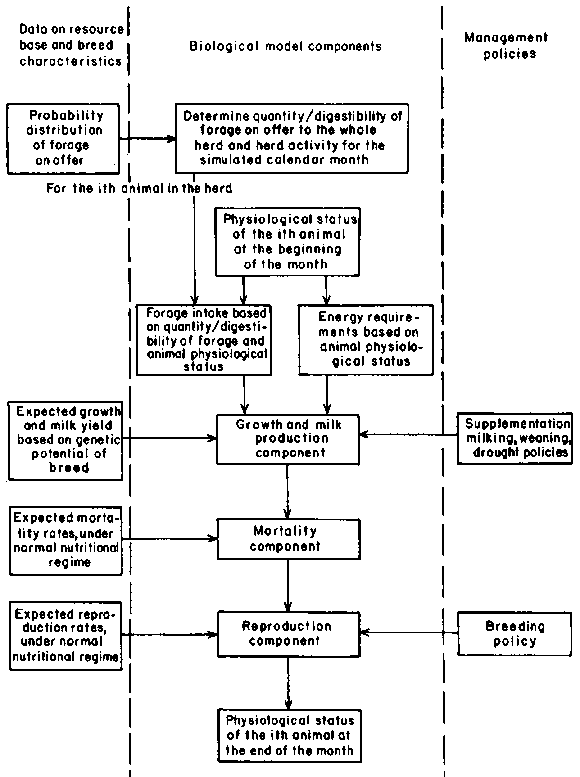
Finally, the mortality component of the model determines whether an animal dies during a month of simulation. Mortality is modelled as a probabilistic process qualified by the age of an animal and its nutritional status. Details of these algorithms are given in Section 3.3.4.
At the end of each simulated month, the model determines sales and purchases of animals, depending on individual animal attributes and on aggregate herd size targets, as specified by management. These components are discussed in detail in Sections 3.4.5 and 3.4.6. As extended periods of feed shortage are characteristic of semi-arid environments, the model includes a component to specify various selling- or supplementation options to mitigate against the effects of drought. These are described in detail in Section 3.4.7.
The quantity and quality of forage on offer to a herd under extensive grazing conditions vary substantially from season to season and from one year to the next. There are basically two approaches to incorporating this variability into a herd-level simulation model. First, the biological processes determining primary production can be described in quantitative terms as a subsystem, with forage output (quantity and quality composition) predicted from the driving variables of the primary production subsystem (see for example, van Keulen, 1975). Such an approach requires a statistical description of the variables of the primary production system, including rainfall intensity and seasonal distribution, soil fertility, solar radiation and grazing pressure. In practice, the amount of information required to drive the primary production model is overwhelming even in cases where the biological processes are well understood. Thus, this approach is impractical for a general herd simulation model with emphasis on secondary production.
The second approach, which is employed here, bypasses the underlying processes of the primers: production subsystem. Instead, the model uses a statistical description of the quantity and digestibility of forage on offer, based on field observations from the production system under study. Of course, this specification of primary production as an exogenous factor means that there is no feedback to the primary production system of the effects of its exploitation, for instance of overgrazing.
Like forage production, the seasonal level of activity of cattle herds is associated with environmental variability. Herd managers respond to the variability of forage on offer by seasonal migrations. Even in systems where forage is adequate throughout the year, the usual water sources might he exhausted for some periods so that animals must be moved to distant watering points. Excessive animal activity implies a significant additional energy cost and might also reduce forage intake due to the reduced time available for grazing. Both of these impacts are incorporated in the appropriate components of the model.
The specification of the level of animal activity is directly related to the specification of forage on offer. A year of good rainfall implies adequate forage and water resources, so that relatively low animal activity levels are expected. Conversely, a year of poor rainfall implies limited forage and water resources, requiring higher levels of animal activity.
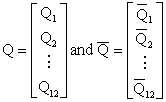
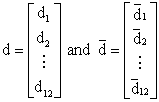
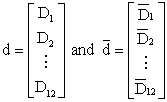
Statistical information on primary production and animal activity must be available on a monthly basis. However, monthly observations of forage quantity and digestibility are not independent of each other within a given year, as the environmental conditions prevailing during the growing season mainly determine primary production for the whole year. Thus, field observations of primary production have to encompass the full annual cycle. Analytically, a particular year outcome can be denoted by three 12-element vectors, Q, d and D, where Q describes the quantity of forage on offer (t/ha) for the 12 months of the annual cycle d describes the corresponding average digestibility of the forage, and D gives the corresponding average daily distances walked (km). Several years' observations of these variables provide a basis for their statistical description as a multivariate probability distribution function:
... (3.1)
where:
the vectors of monthly (1, 2,..., 12) quantities and average quantities for a given year (t/ha).
the vectors of monthly (1, 2,..., 12) digestibilities and average digestibilities for a given year (fraction)
the vectors of monthly (1, 2,..., 12) distances and average distances walked for a given year (km/day)
the estimated symmetric variance covariance matrix, derived from observed quantities and qualities of forage on offer and associated distances walked.
In general it is possible to obtain estimates for  and
S from a limited number of yearly observations.
However, these estimates will not be statistically significant unless information
exists for a longer time series, of say 20 to 30 years. Thus, to make the model
applicable to systems where time series records have not been kept consistently
for a long period, an additional simplification is introduced. It is assumed
that it is possible to construct K representative year types which characterize
the range of the possible outcomes of primary production in the system under
study. Additionally, it is assumed that each outcome has a known relative probability
of occurrence thereby allowing for the specification of a probability distribution
where the sum of K probabilities equals unity. Formally:
and
S from a limited number of yearly observations.
However, these estimates will not be statistically significant unless information
exists for a longer time series, of say 20 to 30 years. Thus, to make the model
applicable to systems where time series records have not been kept consistently
for a long period, an additional simplification is introduced. It is assumed
that it is possible to construct K representative year types which characterize
the range of the possible outcomes of primary production in the system under
study. Additionally, it is assumed that each outcome has a known relative probability
of occurrence thereby allowing for the specification of a probability distribution
where the sum of K probabilities equals unity. Formally:
 the quantity, quality
and activity vector for year type i (i = 1, 2, ..., K), and
the quantity, quality
and activity vector for year type i (i = 1, 2, ..., K), and
Pi = the probability of occurrence of year type i (i= 1, 2,...,K)
such that
At the minimum, K equals one, in which case this specification implies that primary production and animal activity are known with certainty and do not exhibit any year-to-year variability. A value of three for K implies that the primary production and associated animal activity of the system under study can he characterized in terms of 3 discrete year-types corresponding, say, to poor, average and good years. A maximum of 5 year-types is likely to be permitted by the data base in any one production context. To construct a more refined year-type classification, adequate information must be available to estimate primary production variability in the more accurate form as specified by equation (3.1).
An example of a data set required for the specification of forage on offer, covering 3 possible year-types, is presented in Appendix Table F.1.
3.3.1 Feed intake
3.3.2 Growth and milk production
3.3.3 Reproduction
3.3.4 Mortality
The general relationship determining forage intake by extensively grazing cattle, which emerges from the discussion in Section 2.1, is restated here as follows:
I = m(d, t) . m(Q) . m (D) . m(t) . m(x, t) . m(p, t) . a .... (3.2)
where
I = dry matter forage intake (kg/day)m(d, t) = digestibility-of-forage-correction multiplier, a function of the digestibility of forage on offer (d) and for high digestibility levels also of age (t)
m(Q) = quantity-of-forage-correction multiplier, a function of the quantity of forage on offer (Q)
m(D) = grazing-time-correction multiplier, a function of the distance walked per day- (D), taken as a proxy for grazing time limitations
m(t) = age-correction multiplier, a function of the age (t) of individual animals
m(x, t) = sex-correction multiplier, a function of the sex (x) and age (t) of individual animals
m(p, t) = physiological-status-correction multiplier, a function of the physiological status (p) and age (t) of individual animals
a = intake coefficient (kg dry matter/kg metabolic weight/day) of the reference class of animals
= expected liveweight (kg) for animal's age and sex (see Section 3.3.2.1).
The digestibility-of-forage-correction multiplier accounts for the effect of digestibility or the voluntary intake of animals (physical limit) and the adjustments to intake at very low and very high digestibility levels. Its specification is as follows:
(a) for d £ 0.40m(d, t) = (d/0.40) 0.06/(1-d) for all t(b) for 0.40 < d £ 0.65
m(d, t) = 1/(1-d) for all t(c) for d > 0.65
m(d, t) = 1/(1-d) for t £ 1.5 years
m(d, t) = 1.86/d for t > 1.5 years
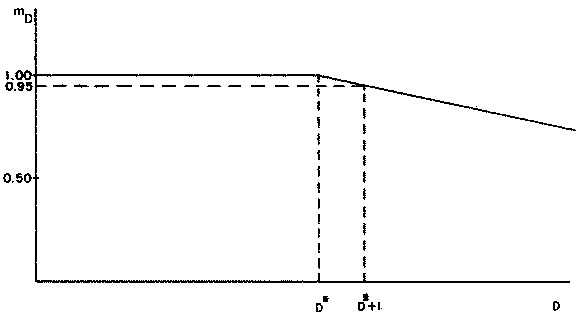
The quantity-of-forage-correction multiplier and the grazing-time-correction multiplier account for adjustments in voluntary intake due to limitations in the quantity of acceptable forage on offer and the time available for grazing. During certain seasons, estimated ad libitum intakes might not be realized because of insufficient forage on offer and/or excessive walking requirements, such as to distant watering points or for migrations. Section 2.1.2 explained in principle how these constraints could reduce voluntary intake below the ad libitum level. As the data required to estimate the relationships proposed in Section 2.1.2 are normally not available, a simplified formulation is employed here, based on a minimum of data. Assume:
Q* = the minimum quantity (t/ha) of acceptable forage on offer, below which a reduction in ad libitum forage intake is observedD* = the maximum distance (km) walked per day, above which a reduction in ad libitum forage intake is observed.
These two threshold levels imply that forage intake will equal the ad libitum level when both the quantity of forage on offer (Q) is greater than Q* and the distance walked per day (D) is less than D*. If either of these conditions is not met, then a reduction in the voluntary intake is assumed, though the extent of this reduction is an empirical question. The assumed effects of these two factors are shown in Figures 3.2 and 3.3, subject to validation for each particular system under study. Figure 3.2 implies a reduction to 50% of the ad libitum intake level when the quantity of acceptable forage on offer is 50% of the threshold level. Similarly, Figure 3.3 implies a 5% reduction intake below the ad libitum level for each km walked over the threshold level D*. Formally, the assumed multiplicative effect of the forage on offer (Q) on ad libitum intake is:
(a) for Q £ Q*m(Q) = Q/Q*(b) for Q > Q*
m(Q) = 1.0
and the assumed multiplier effect of distance walked daily (D) is:
(a) for D £ D*m(D) = 1.0(b) for D > D*
m(D) = 1.0 - 0.05 (D - D*).
The age-correction multiplier accounts for the reduction in voluntary intake of animals older than 8 years and the zero forage intake of animals younger than 2 months. Its specification is:
(a) for t £ 0.17 years (÷ 2 months)m(t) = 0(b) for 0.17 years < t £ 8 years
m(t) = 1.0(c) for t > 8 years
m(t) = 1.0 - 0.03(t - 8).
Figure 3.2 Assumed multiplicative effect (mQ) of quantity of acceptable forage on offer (Q) on voluntary intake
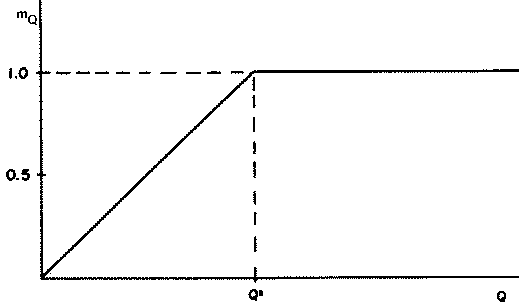
Figure 3.3 Assumed multiplicative effect (mD) of daily distance walked (D) on voluntary intake
The sex-correction multiplier accounts for the apparent higher appetite of young males (x = 1) relative to young females (x = 2). It is assumed that males up to 18 months have a 10% higher appetite than females of a corresponding age. Formally, this multiplier is specified as:
(a) for x = 1m(x, t) = 1.1 for t £ 1.5 years
m(x, t) = 1.0 for t > 1.5 years(b) for x = 2
m(x, t) = 1.0 for all t.
For the specification of the physiological-status-correction multiplier, the following animal classes (p) are considered:
1. very young calves (3 to 6 months)
2. young and rapidly growing animals (7 to 18 months)
3. males and dry females (older than 18 months)
4. pregnant cows (last 3 months of pregnancy)
5. lactating cows, including cows which are both lactating and pregnant.
Animal class 3 is taken as a reference class (i.e. m(3, t) = 1.0). On the basis of this class, together with the literature reviewed in Section 2.1.1, the correction multipliers for the other animal classes are specified as:
(a) for p = 1 (0.25 £ t £ 0.5 years)m(p, t) = 0.53(b) for p = 2 (0.5 < t £ 1.5 years)
m(p, t) = 0.53+ 0.47 (t - 0.5)
(i.e. an interpolation between classes 1 and 3)(c) for p = 3 (t > 1.5 years)
m(p, t) = 1.0(d) for p = 4 (last 3 months of pregnancy)
m(p, t) = 1.07 for all t(e) for p = 5 (lactating cows)
m(p, t) = 1.15 for all t.
Finally, the intake coefficient of the reference class of animals (a) is calculated on the basis of observations from the particular system under consideration. In any production system, there exists a calendar month of the most probable year type during which the reference class of animals is in equilibrium as regards liveweight, that is, neither gaining nor losing weight. This implies that the daily dry matter intake during this equilibrium month is just sufficient to maintain body weight for the reference animal at the level of activity for the month.
The liveweight of the reference animal (for example, a 7-year-old dry female) is known, as are the quantity and digestibility of the forage on offer and the level of animal activity for the equilibrium month. The computation of the intake coefficient (a) is achieved by equating intake requirements, as specified by functional forms (2.11) to (2.13), sufficient to allow exactly for maintenance and the animal's level of activity, with the functional form (3.2).
For example, consider the forage on offer as specified in Appendix Table F.1 and the breed as specified by the parameters given in Appendix Table F.2. Also assume that during an average year-type the reference class (7-year-old dry females) maintains liveweight during the month of April, when the digestibility of forage on offer is 0.50 and the animals walk 12 km/day. The intake requirements to maintain a 350 kg animal at this activity level, as obtained from equations (2.11) to (2.13), are 7.32 kg dry matter/day. The coefficient of intake for the reference class of animals is then computed by equating this equilibrium intake requirement with functional form (3.2):
1/(1-0.50) . 1 . 1 . 1 . 1 . 1 . a . 350 = 7.32
which yields an intake coefficient a = 0.0509.
In addition to forage, the feed available to an animal could include supplements. Provisions are made in the model for two types of supplementation: concentrates and high quality forage. In both cases, the quality and the quantity of the supplements are specified by management (Section 3.4.1). Aside from their different nutritive values, the two types of supplements are distinguished in the model in terms of their impact on voluntary forage intake through grazing. Because concentrates are generally supplied in small quantities and are highly digestible, it is assumed that they do not have any positive or negative effect on the level of voluntary intake through grazing, although it has been reported in some studies, such as Campling et al (1972), that the provision of urea results in increased voluntary intake of very low quality forage. When supplementation consists of high quality forage, it is assumed that the quantity consumed reduces the amount of standard forage which would have otherwise been consumed through grazing. For each kg of high quality forage consumed, voluntary intake of the standard forage is assumed to be reduced by 0.5 kg. In summary, concentrates are treated as net additions to voluntary intake through grazing, whereas high-quality forage is assumed to substitute for lower-quality forage which would have otherwise been consumed by a ratio of 2 to 1.
3.3.2.1 Liveweight limits and the condition index. A simulation model of herd productivity must include an adequate representation of the liveweight potential of the breed under study. Observed liveweights of individual animals of a particular breed are a function of the genetic characteristics of the breed and the production system in which they are maintained. When sufficient liveweight data are available for the system under study, the expected values of liveweights can be estimated, as well as the distribution of liveweights according to age and sex categories. These statistics can then be used to estimate extreme upper and lower limits of fluctuations in liveweights such that observed liveweights will lie within these limits with a specified degree of confidence.
Assume that the observed average liveweight evolution curve of animals of a given sex in the system under study is described by the following function:
... (3.3)
where:
t = animal's age (months)
and that the distribution of liveweights around  is given by the general function F
... (3.4)
where
= the estimated standard deviation of liveweights at age t.
This is, in general, a function of t:
... (3.5)
Estimated parameters of functional forms (3.3) through (3.5) will depend on the production system in which the observations were made and the number of years over which data were recorded. E the observations were from a few years with below average performance, then the mean liveweights calculated will be below those which would be estimated if the data were recorded from another sequence of years more representative of the system under study. Similarly, the range of liveweights at any age estimated from a short time series will tend to be smaller than that estimated from a longer time series. Thus, ideally, these relationships should be estimated from data collected over an adequately long and representative time period, to express the full range of liveweight possibilities for the breed and system under study. The actual period required depends on the variability of environmental conditions in the system where forage availability varies substantially from year to year, a longer period is necessary.
Although statistical estimates of functions (3.3) through (3.5) could theoretically be possible, in practice they would require considerable cross-sectional and time-series data to guarantee high levels of significance. Because such data are often not available, less stringent assumptions than those in (3.3) to (3.5) have to be made for the specification of liveweight evolution and associated distributions. Thus, it is assumed that liveweights are distributed normally around their mean for a sex and age category, with a coefficient of variation kt which implies a standard deviation of liveweight variability:
... (3.6)
A procedure is presented in Appendix A to permit an approximate estimation of function (3.3) from a minimum set of data, when time-series and cross-sectional data are not sufficient for direct estimation. The coefficient of liveweight variability is in general a function of age, and, for a given breed of environment, reflecting adaptations to relatively favourable or harsh conditions. For modelling purposes, three categories of animals are considered: calves up to 6 months for which the major source of energy intake is milk from their dams, relatively mature animals (over 18 months), and animals in a transition period from 7 to 18 months. For the first category, the value of k is taken as equal to 0.30, and it is assumed to be independent of breed and environmental variability. This value was found to reflect calf liveweight variability for a number of breeds and production systems, but it can be changed readily if it does not depict the situation for a particular application of the model. For mature animals, the coefficient of variation is provided as data, derived from observed liveweight variability for the system and breed under study. Finally, for animals in the transitional category, the coefficient of variation is computed by interpolation between 0.30 and the coefficient for mature animals.
Under these assumptions concerning average liveweight evolution and associated variability around the expected values for each age group, it is possible to construct an upper and lower boundary of liveweight variability. Thus, using a normal distribution, the 95% confidence boundaries for liveweight are defined as follows for each sex:
... (3.7)
... (3.8)
where:
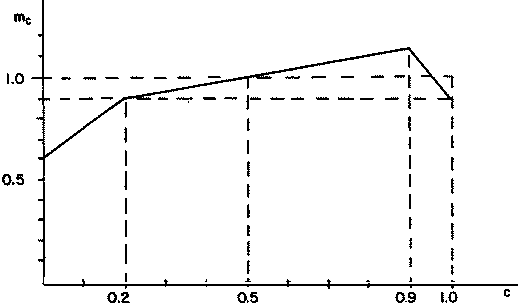
Wmax, t and Wmin, t = the upper and lower liveweight limits respectively, max. t mm, t at the 5% probability level.
The estimated range for each sex defines a feasible set of simulated liveweights. Figure 3.4 depicts the general shape of the average liveweight evolution curve and associated liveweight boundaries and presents two exemplary cases of liveweight paths. Case 1 shows an animal with a below average nutritional status until it dies due to starvation at the time its liveweight drops below the lower boundary, Wmin, t at age t1. The liveweight evolution of the second animal (case 2) depicts a more typical situation, where liveweight changes follow seasonal forage fluctuations. In this case, the liveweight of the animal oscillates above and below the mean for its sex and age, and it survives at least until age t2.
The upper boundary for each sex can be regarded in practical terms as the maximum liveweight of animals of the breed under study. Similarly, the lower boundary can be regarded as the minimum liveweight, below which death occurs due to starvation. Thus, no animals should be observed below that weight. It is recognized that this is a simplification of the complex set of factors which regulate liveweight and limit liveweight fluctuations, as substantial differences are observed among individuals of a given breed. However, since data are often inadequate to ascribe particular genetic potentials to each animal in the simulated herd, it is assumed that all animals of the breed under study are genetically equivalent as regards their potential for liveweight gain and tolerance to fluctuations in liveweight over time. Similarly, it is assumed that animals of the same class and physiological status have identical constraints on intake and identical feed conversion efficiencies.
For an animal of a certain age and weight, a liveweight condition index can he defined depending on the relative position of its current liveweight vis-a-vis the corresponding upper and lower liveweight limits:
ct = (Wt - Wmin, t)/(Wmax, t -Wmin, t) ... (3.9)
where Wmax, t and Wmin, t are as in (3.7) and (3.8).
The condition index ranges from 1.0 (when Wt equals Wmax, t) to 0.0 (when Wt equals Wmin, t). This index is used in the model to modify lactation yields and reproductive performance.
The liveweight limits are also used to determine the maximum permissible liveweight gain or loss during a simulated month. At the end of the simulated month an animal of age t in months can at most increase its liveweight to Wmax, t+1 or at most decrease it to Wmin, t+1. Thus, the maximum daily liveweight increase (DWimax) and decrease (DMdmax) are:
DWimax = (Wmax, t+1 - Wt)/30 ... (3.10)DWdmax = (Wt - Wmin, t+1)/30 ... (3.1 1)
where again Wmax, t+1 and Wmin, t+1 are obtained from equations (3.7) and (3 8) and where a month has 30 days. These two permissible liveweight changes play an important role in the specification of the growth algorithms as described in subsequent sections.
The growth algorithms that follow determine average daily change in liveweight over a month of simulation based upon the energy content of the total feed available to each animal, and its requirements as specified in Section 2.2. Intake of feed energy is used for maintenance (plus pregnancy and lactation when appropriate), with any surplus or deficit balanced by liveweight gain or loss. In a situation of energy surplus, if the resulting daily liveweight gain is in excess of DWimax then. the feed intake is reduced to the level which gives a gain exactly equal to DWimax. In an energy-deficit situation, if the resulting daily liveweight loss is greater than DWdmax, then for non-lactating animals the weight loss will exceed DWdmax, and the animal dies due to starvation in the subsequent month if it fails to increase its liveweight above the lower liveweight boundary. For lactating animals, the energy expended on lactation is reduced (implying a reduction in milk yield) to the level where weight loss does not exceed DWdmax. If the weight loss at zero milk yield still exceeds DWdmax then, as for non-lactating animals, the cow dies due to starvation in the subsequent month of simulation. The calculations to determine the balance between available energy and energy requirements are made on a daily basis, with productivity over a month calculated as 30 times the daily changes.
3.3.2.2 Growth algorithm for adult males. Energy intake by adult males in the simulated herd is used first to satisfy maintenance and second for weight gain. If the energy intake is not sufficient to meet maintenance requirements then body resources are mobilized as required and the animal loses weight. Energy is available from the basic forage on offer and from food supplements if they are provided.
A descriptive flowchart of the growth algorithm for males is presented in Figure 3.5, indicating the computational procedures followed. Forage intake (Iaf) and the forage requirements for maintenance (Irfm) are determined first. If forage intake is more than adequate for maintenance the animal will gain weight equivalent to the excess energy in the forage intake over the energy required for maintenance, plus the energy from any food supplements provided. If the energy from forage is not sufficient for maintenance but a food supplement is provided, then the total intake is compared with maintenance requirements: if intake is greater than requirements, then weight gain occurs, if less, then body reserves are mobilized to meet the energy deficit and the animal loses weight.
Table 3.1 illustrates the computational procedures involved in the growth algorithm for males. The exact relationships used in the calculations are shown in the footnotes to the table. Out of a total forage intake of 7.58 kg/day, 3.55 kg/day are available for weight gain above maintenance requirements. This results in a potential daily gain of 0.89 kg or 26.7 kg for the month of simulation. Since this potential monthly gain is well below the maximum permissible, actual daily gain equals potential daily gain, i. e. DW = 0.89 kg/day.
3.3.2.3 Milk production algorithm. The milk production algorithm used in this model is shown in Figure 3.6. Three factors determine the daily milk yield: the age of the cow, the number of months post-partum and the liveweight condition index. The maximum potential yield (Ypmax) is usually realized by middle aged cows. The extent to which the milk yields of younger and older cows are reduced below this maximum depends on the breed and the particular production system. In general, the potential milk yield of a cow at age t can be expressed as:
Ypt = Ypmax . yt ... (3.12)
where:
Ypt = potential milk yield per lactation (kg) of a cow at age t
Ypmax = maximum potential milk yield per lactation (kg) of middled aged cows
yt = potential milk yield realized at age t relative to the maximum (fraction).
If sufficient data are available, it is possible to specify relative potential milk yields at all ages. Appendix B presents an analytical procedure for estimating the age effect from a minimum of data.
The distribution of milk yield over a given lactation is primarily a function of breed and management environment. In general, the daily milk yield increases to a maximum by the 4th to 6th week post-partum and declines steadily thereafter. Exponential formulations have often been used to estimate lactation curves from weekly or daily data (Cobby and le Du, 1978; Wood, 1969). The time-step in this model is one month, so there is only need to approximate the lactation curve in monthly intervals. Thus the maximum potential daily milk yield during the n'th month post-partum can be expressed as:
Figure 3.5 Flowchart of the growth algorithm for adult males
Table 3.1 Illustration of calculations involved in the growth algorithm for adult males a
|
Variable |
Value | |
|
System-related variables | ||
|
|
1. Quantity of forage on offer (Qf) |
2.7 t dry matter/ha |
|
|
2. Digestibility of forage on offer (df) |
0.60 |
|
|
3. Threshold quantity of forage below which voluntary intake is reduced (Q*f) |
0.8 t dry matter/ha |
|
|
4. Distance walked per day (D) |
8 km/day |
|
|
5. Threshold distance above which voluntary intake is reduced (D*) |
14 km/day |
|
|
6. Intake coefficient for reference class (a) |
0.0509 |
|
Animal-related variables | ||
|
|
7. Age (t) |
2 years |
|
|
8. Mean liveweight for age ( |
270 kg |
|
|
9. Coefficient of variation for liveweight (kt) |
0.25 |
|
|
10. Current liveweight (Wt) |
240 kg |
|
|
11. Upper liveweight limit (Wmax, t) |
402 kg |
|
|
12. Lower liveweight limit (Wmin, t) |
138 kg |
|
|
13. Voluntary intake of forage (Iaf) |
7.58 kg dry matter/day |
|
|
14. Net energy required for maintenance (Erm) |
24.58 MJ/day |
|
|
15. Forage efficiency coefficient for maintenance (km) |
0.696 |
|
|
16. Forage intake required for maintenance (Irfm) |
4.03 kg dry matter/day |
|
|
17. Forage available for weight gain (Iaf - Irfm) |
3 55 kg dry matter/day |
|
|
18. Forage efficiency coefficient for weight gain (kg) |
0.424 |
|
|
19. Net energy available for weight gain (Eag) |
13.18 MJ/day |
|
|
20. Potential weight gain (DWp) |
0.89 kg/day |
|
|
21. Actual weight gain (DW) |
0.89 kg/day |
a The production system in this example is as described in Appendix Tables F.1 and F.2. The calculations reported here correspond to the values given for November (month 11) during a poor year.b The sources for the values of different variables are:
1 to 5 from Appendix Table F.1
6 as computed in Section 3.3.1
7, 9 and 10 data for illustrative purposes
8 obtained as in Appendix A using values from Appendix Table F.2
11 and 12 from relationships (3.7) and (3.8) respectively
13 from relationship (3.2)
14, 15 and 16 from relationships (2.12), (2.13) and (2.11) respectively
18, 19 and 20 from relationships (2.20), (2.10) and (2.19) respectively.Mpt, n max = (Ypt/30) . hn ... (3.13)
where:
Mpt, n max = maximum potential daily milk yield of a cow at age t in the t, n max n'th month post-partum (kg/day)Ypt = as obtained from equation (3.12)
n = period post-partum (months)
hn = maximum potential milk yield at the n'th month of lactation, as an fraction of total yield.
In practice, the average monthly yields over the 1st and 2nd months postpartum are approximately equal. For modelling purposes, it is assumed here that milk yields are equal for the first 2 months post-partum and decline linearly thereafter. This simplification of the lactation curve considerably reduces the field data required for its estimation, while retaining its essential attributes. Appendix C presents an analytical procedure and the data required for estimation based on these assumptions.
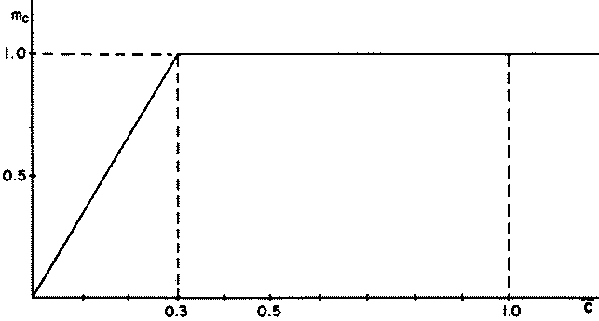
The cow's energy balance during the current month and its nutritional status during previous months are principal determinants of the actual current milk yield (Broster, 1972; Lowman et al, 1979). The cow's energy balance during the current month is based on total available energy minus energy requirements: the algorithm dealing with this aspect is discussed in detail in the following section. The nutritional status of previous months can be summarized by the current liveweight condition index as given by (3.9). When this condition index is above 0.3, it is assumed that liveweight condition does not have any effect on potential milk yield. For a condition index below 0.3, a linear effect is assumed, as depicted in Figure 3.7. Formally, the assumed multiplicative effect of liveweight condition on potential milk yield is defined as mc = 1 for c ³ 0.3, and mc = c/0.3 for c < 0.3. Thus, potential daily milk yield is:
Mpt, n = Mpt, n max . mc ... (3.14)
where
Mpt, n = potential daily milk yield of a cow at age t in the n'th month post-partum (kg/day)
Mpt, n max = as obtained from equation (3.13)
c = current liveweight condition index
mc = assumed multiplicative effect of liveweight condition on maximum potential daily yield.
Table 3.2 illustrates the sequence of calculations to determine daily potential milk yields. Based on the parameters of the system under consideration and the specific parameters of the cow considered in this example, the potential milk yield is calculated as 2.44 kg/day. This potential daily milk yield is used as an input to the calculations of the cow growth algorithm described in the following section. Depending on the total energy available to the animal, this potential daily milk yield may or may not be achieved.
Figure 3.6. Flowchart of the algorithm for milk production
Table 3.2 Illustration of calculations involved in the milk production algorithm a
|
Variable b |
Value | |
|
System- related variables | ||
|
|
1. Maximum milk yield per lactation (YP max) |
800 kg |
|
|
2. Length of lactation (N) |
9 months |
|
|
3. Fraction of milk produced in the first 2 months of lactation (h1,2) |
0.35 |
|
Animal-related variables | ||
|
|
4 Age (t) |
5 years |
|
|
5. Expected liveweight for age ( |
350 kg |
|
|
6. Coefficient of liveweight variation (kt) |
0.25 |
|
|
7. Current liveweight (Wt) |
340 kg |
|
|
8. Upper liveweight limit (Wmax, t) |
521 kg |
|
|
9. Lower liveweight limit (Wmin, t) |
178 kg |
|
|
10. Liveweight condition index (ct) |
0.47 |
|
|
11. Fraction of maximum yield for a 5-year-old cow (y5) |
0.985 |
|
|
12. Potential milk yield per lactation for a 5-year-old cow (Yp5) |
788 kg |
|
|
13. Period post-partum (n) |
6 months |
|
|
14. Maximum daily milk yield during the 6th month post partum as a fraction of total (h6) |
0.093 |
|
|
15. Maximum daily milk yield during the 6th month post-partum (Mp5, 6 max) |
2.44 kg/day |
|
|
16. Multiplier effect of liveweight condition on milk yield (mc) |
1.0 |
|
|
17. Potential daily milk yield during the 6th month post-partum (Mp5, 6) |
2.44 kg/day |
a The production system considered in this example is as described in Appendix Tables F.1 and F.2.b The sources for the values of different variables are:
1 to 4 data for illustrative purposes
5 obtained from Appendix A using values from Appendix Table F.2
6 and 7 data for illustrative purposes
8, 9 and 10 from relationships (3.7), (3.8) and (3.9) respectively
11 obtained as in Appendix B using values from Appendix Table F.3
12 from relationship (3.12)
13 data for illustrative purposes
14 obtained as in Appendix C using values from Appendix Table F.3
15, 16 and 17 from relationship (3.13), Figure 3.7 and relationship (3.14) respectively.
Figure 3.7 Assumed multiplicative effect (mc) of liveweight condition index (c) on potential milk yield
3.3.2.4 Growth algorithm for adult females. In general, cows use energy for maintenance, pregnancy, lactation and weight gain. In this model it is assumed that energy needs for maintenance and pregnancy are satisfied first. Maintenance and pregnancy are treated as joint and inseparable energy demands. If additional energy is available it is used first for lactation and then, only when full milk production potential is realized, for weight gain. Energy needs for maintenance and pregnancy have to be met at all times, either from the food on offer or by mobilizing body reserves. Body reserves are also mobilized to meet lactation requirements.
Figure 3.8 is a flowchart of the growth algorithm for cows. The potential milk production of a lactating cow is provided to the algorithm, based on the cow's age, stage of lactation and condition (Section 3.3.2.3). Forage intake (Iaf) is determined, and compared with forage requirements for maintenance (Irfm) and pregnancy (Irfp). The flowchart details the subsequent operation of the algorithm based on this comparison, with the calculations leading to predicted daily weight gain or loss. In summary, if overall energy intake is adequate, lactation requirements are met and any residual energy intake is deposited as weight gain. Body reserves are mobilized as required if the energy intake is inadequate for maintenance and pregnancy needs. If intake is sufficient for these functions but not sufficient to meet calculated needs for lactation, then body reserves can be mobilized up to a maximum level corresponding to a weight loss DWdmax (Section 3.3.2.1). A downwards adjustment in milk yield is in effect when required body reserves for lactation are in excess of DWdmax.
Figure 3.8 Flowchart of the growth algorithm for adult females
Table 3.3 Illustration of calculations involved in the growth algorithm for cows a
|
Variable b |
Value | |
|
System-related variables (additional to Table 3.2) | ||
|
|
1. Quantity of forage on offer (Qf) |
1.3 t dry matter/ha |
|
|
2. Digestibility of forage on offer (df) |
0.42 |
|
|
3. Threshold forage quantity below which- voluntary intake is reduced (Qf*) |
0.8 t dry matter/ha |
|
|
4. Distance walked per day (D) |
15 km/day |
|
|
5. Threshold distance above which voluntary intake is reduced (D*) |
14 km/day |
|
|
6. Intake coefficient for reference class (a) |
0.0509 |
|
|
7. Quantity of supplements provided (Ias) |
1.29 kg dry matter/day |
|
|
8. Digestibility of supplements (ds) |
0.86 |
|
Animal- related variables (additional to Table 3.2) | ||
|
|
9. Voluntary intake of forage (Iaf) |
6.90 kg dry matter/day |
|
|
10. Net energy required for maintenance (Erm) |
37.20 MJ/day |
|
|
11. Forage efficiency coefficient for maintenance (km) |
0.652 |
|
|
12. Forage intake required for maintenance (Irfm) |
9.30 kg dry matter/day |
|
|
13. Forage deficit for maintenance (Irfm-Iaf) |
2.40 kg dry matter/day |
|
|
14. Net energy deficit for maintenance (DErm) |
9.60 MJ/day |
|
|
15. Supplements efficiency coefficient for maintenance (km) |
0.76 |
|
|
16. Supplements required to meet maintenance deficit (Irsm) |
1.01 kg dry matter/day |
|
|
17. Supplements available for lactation (Ias-Irsm) |
0.28 kg dry matter/day |
|
|
18. Net energy required per unit of milk produced (e1) |
3.6 MJ/day |
|
|
19. Potential daily milk yield (Mp5, 6) |
2.44 kg |
|
|
20. Net energy required for potential lactation (Er1) |
8.87 MJ/day |
|
|
21. Supplements efficiency coefficient for lactation (k1) |
0.63 |
|
|
22. Supplements required for potential lactation (Irsi) |
1.11 kg dry matter/day |
|
|
23. Supplements deficit for lactation (Irsm + Irsi - Ias) |
0.83 kg dry matter/day |
|
|
24. Net energy deficit for lactation (Er1) |
6.57 MJ/day |
|
|
25. Weight loss required to meet lactation (DWr1) |
0.40 kg/day |
|
|
26. Actual weight loss (DW) |
0.40 kg/day |
a The production system considered in this example is as described in Tables F.1, F.2 and Table 3.2. Calculations correspond to June (month 6) of an average year.b The sources for the values of different variables are:
1 to 5 from Appendix Table F.1
6 as computed in Section 3.3.1
7 and 8 data for illustrative purposes
9 from relationship (3.2)
10, 11 and 12 from relationships (2.12), (2.13) and (2.11) respectively
14 from relationship (2.10)
15 and 16 from relationships (2.13) and (2.11) respectively
18 data for illustrative purposes, see relationship (2.15)
19 from Table 3.2
20, 21 and 22 from relationships (2.14), (2.16) and (2.11) respectively
24 and 25 from relationships (2.10) and (2.23) respectively.
The computation procedures of this algorithm are illustrated in Table 3.3. The production system and the status of the cow used in this example are the same as in Table 3.2. In addition to forage intake, the cow is supplemented by 1.5 kg of barley daily, which corresponds to 1.29 kg dry matter as the dry matter content of barley is 860 g/kg.
Forage intake by the cow is calculated as 6.90 kg/day which is insufficient to meet the cow's maintenance and pregnancy requirements, due to its low digestibility and the cow's excessive activity. The energy deficit for maintenance and pregnancy is fully met by supplements, with an excess 0.28 kg/day of supplements available for lactation. As this is not sufficient to meet total lactation requirements, the animal will lose a calculated 0.40 kg/day liveweight. Total potential weight loss for the current month of simulation equals 12.0 kg (calculated as 0.40 x 30) and is well within permissible weight loss limits. Thus the lactation requirements of the cow are fully met, the animal loses 12.0 kg over the month, and at the end of the month has a simulated liveweight of 328 kg (calculated as 340 - 12).
3.3.2.5 Growth algorithm for calves. In the context of the model, a calf is defined as an unweaned animal whose energy requirements are met totally or partially by milk from its dam. In general, both forage and supplements may also be available to a calf. The algorithm in the model specifies that milk consumption has first priority for calves, forage is consumed next, and supplements are then consumed if they are available and can be utilized. In the model, the voluntary forage intake by calves up to 2 months is zero.
The growth algorithm for calves is depicted in Figure 3.9. Milk available to a calf (Ma) is taken as equal to the residual of the milk yield of its dam minus any offtake for human consumption. The quantity of milk required to meet the calf's maintenance (Mrm) is calculated and compared with the quantity of milk available. If sufficient milk is available for maintenance, then any excess milk plus any forage or supplements consumed results in weight gain. If insufficient milk is available for maintenance, then calculations are made to determine if the forage available can meet the maintenance deficit. If the available forage is also inadequate, then supplements (if available) are used to meet the remainder of the maintenance deficit. If available forage and/or supplements are inadequate, body reserves are mobilized to meet the residual energy deficit for maintenance and the calf loses weight. The calf gains weight when the total energy intake is greater than maintenance requirements, subject to the maximum permissible level of weight gain.
The operational procedures of the algorithm are illustrated in Table 3.4. A 6-month-old male calf is taken as an example. In addition to 3.5 kg of milk available from its dam, it also consumes 2.03 kg dry matter of forage daily. Milk alone is not adequate to meet its maintenance requirements, leaving an energy deficit of 3.70 MJ/day to be met by forage. The available forage covers this deficit fully, with an excess of 1.45 kg dry matter/day which results in a potential weight gain of 0.58 kg/day or 17.4 kg for the month. As this potential monthly gain is below the maximum permissible gain, the actual gain will also equal 0.58 kg/day, and at the end of the month the simulated liveweight will be 117.4 kg (computed as 100 + 17.4).
Figure 3.9 Flowchart of the growth algorithm for calves
Table 3.4 Illustration of calculations involved in the growth algorithm for calves a
|
Variable b |
Value | |
|
System-related variables | ||
|
|
1. Quantity of forage on offer (Qf) |
3.4 t dry matter/ha |
|
|
2. Digestibility of forage on offer (df) |
0.62 |
|
|
3. Threshold forage quantity below which voluntary intake reduced (Q*f) |
0.8 t dry matter/ha |
|
|
4. Distance walked per day (D) |
8 km/day |
|
|
5. Threshold distance above which voluntary intake reduced (D*) |
14 km/day |
|
|
6. Intake coefficient for reference class |
0.0509 |
|
Animal-related variables | ||
|
|
7. Age (t) |
0.5 years |
|
|
8. Sex (x) |
1 (-male) |
|
|
9. Expected liveweight for age and sex ( |
87 kg |
|
|
10. Coefficient of liveweight variation (kt) |
0.30 |
|
|
11. Current liveweight (Wt) |
100 kg |
|
|
12. Upper liveweight limit (Wmax, t) |
138 kg |
|
|
13. Lower liveweight limit (Wmin, t) |
36 kg |
|
|
14. Milk intake available from dam (Ma) |
3.50 kg/day |
|
|
15. Net energy per unit of milk available (e1) |
3.60 MJ/kg |
|
|
16. Voluntary intake of forage (Iaf) |
2.03 kg dry matter/day |
|
|
17. Net energy required for maintenance (Erm) |
12.52 MJ/day |
|
|
18. Milk intake required for maintenance (Mrm) |
4.97 kg/day |
|
|
19. Milk deficit for maintenance (Mrm-Mra) |
1.47 kg/day |
|
|
20. Net energy deficit for maintenance (DErm) |
3.70 MJ/day |
|
|
21. Forage efficiency coefficient for maintenance (km) |
0.70 |
|
|
22. Forage intake required for maintenance deficit (Irfm) |
0.58 kg dry matter/day |
|
|
23. Forage available for weight gain (Iaf - Irfm) |
1.45 kg dry matter/day |
|
|
24. Forage efficiency coefficient for weight gain (kg) |
0.44 |
|
|
25. Net energy available for weight gain (Eag) |
5.78 MJ/day |
|
|
26. Potential weight gain (DWp) |
0.58 kg/day |
|
|
27. Actual weight gain (DW) |
0.58 kg/day |
a The system considered in this example is as described in Tables F.1 and F.2. Calculations correspond to November (month 11) of an average year.b The sources for the values of different variables are:
1 to 5 from Appendix Table F.1
6 as computed in Section 3.3.1
7, 8, 10, 11, 14 and 15 data for illustrative purposes
9 obtained as in Appendix A using values from Appendix Table F.2
12 and 13 from relationships (3.7) and (3.8) respectively
16 from relationship (3.2)
17 and 18 from relationships (2.12) and (2.25) respectively
20, 21 and 22 from relationships (2.24), (2.13) and (2.11) respectively
24, 25 and 26 from relationships (2.20), (2.10) and (2.19) respectively.
3.3.3.1 Heifer reproductive maturity. As indicated in Section 2.3, aside from management interventions, a heifer's first successful conception is determined principally by age and liveweight. This process is stochastic, as for any given age there exist different transitional probabilities associated with different liveweights, with higher probabilities applying for heifers in relatively better condition.
This formulation requires considerable data from the system under study for estimating the probability surface, as postulated in Figure 2.6. Such data are seldom available, however, even for production systems which have been relatively thoroughly studied. Usually, an age/liveweight relationship must be inferred from data on the age distribution of heifers at first calving, which can be translated into an age distribution at first successful conception. This distribution is usually skewed, as shown in Figure 3.10 where t0 corresponds to the average age at first successful conception of heifers of average liveweight, Similarly t1 and t2 are the minimum and maximum observed ages at first conception, corresponding to heifers of very good and very poor liveweight condition, respectively.
Operationally, the conditions for heifer reproductive maturity can be approximately
specified from ages t1, t0 and t2 in conjunction
with the breed's average liveweight evolution curve and the associated minimum
and maximum boundaries, as specified in Section 3.3.2.1. Liveweight  in
Figure 3.10 corresponds to the minimum liveweight of heifers at t2
required for reproductive maturity. Similarly, liveweights
in
Figure 3.10 corresponds to the minimum liveweight of heifers at t2
required for reproductive maturity. Similarly, liveweights  and
and
 correspond to ages t0
and t1 respectively.
correspond to ages t0
and t1 respectively.
The linear segments (AB) and (BC) define approximately the age/liveweight combinations required for heifer reproductive maturity. The shaded area then defines the feasible age/liveweight set for the breeding herd. Whether a heifer of age t and liveweight Wt has reached reproductive maturity can be ascertained by checking on whether point (Wt. t) is in the feasible set. The relevant cheeks are:

for t1 £ t £ t0 ... (3.15)

for t0 < t £ t2 ... (3.16)
where 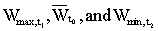 are obtained from
equations (3.7), (3.3) and (3.8) after substituting t1, t0
and t2 respectively.
are obtained from
equations (3.7), (3.3) and (3.8) after substituting t1, t0
and t2 respectively.
In addition to these physiological conditions for reproductive maturity, conceptions are only possible within the conditions of the breeding regime in effect, as specified in Section 3.4.4.
3.3.3.2 Conceptions. In any month of the breeding season, a fraction of cows in the breeding herd will conceive. Since the mechanisms underlying the loss of foeti before full term are difficult to model, it is assumed that conception results in a birth 9 months later, as the gestation period of cows is 284 days. Thus, since birth rates are perfectly correlated with conception rates in the model, annual calving rates and conception rates are synonymous. The model calculates the energy cost for a 284 day gestation, although the simulated time is 9 months or 270 days.
Figure 3.10 Age and liveweight combinations for heifer reproductive maturity
Three variables were identified in Section 2.3 as the main determinants of conception for mature cows: age, liveweight and the interval since previous calving. The individual effects on conception of the first two of these factors were shown in Figures 2.7 and 2.8 respectively. Though these factors affect conception simultaneously, data do not usually exist to allow a multivariate estimation. At best, data exist to estimate the age effect on fertility, which rotationally can be represented by:
where:
t = age of cow (years)
= average annual conception rate corresponding to age t (fraction).
For situations where adequate data are not available, Appendix D describes a procedure for approximate estimation using a minimum data set.
Observed herd fertility corresponds to a particular breeding regime, ranging from controlled seasonal breeding to breeding year-round. The specification of the breeding regime in the model is described in Section 3.4.4. It is assumed here that, other things being equal, a cow is equally likely to conceive in any month of the breeding season. This assumption implies the following relationship between the expected probability of conception in a single month of the breeding season and the annual conception rate:
... (3.17)
where:
= the expected probability of conception during a given month of the t breeding season of a cow of age t
L = the length of the breeding season in months.
Given  (annual conception
rate) and L, equation (3.17) can be solved for
(annual conception
rate) and L, equation (3.17) can be solved for  using, for example, Newton's approximation method.
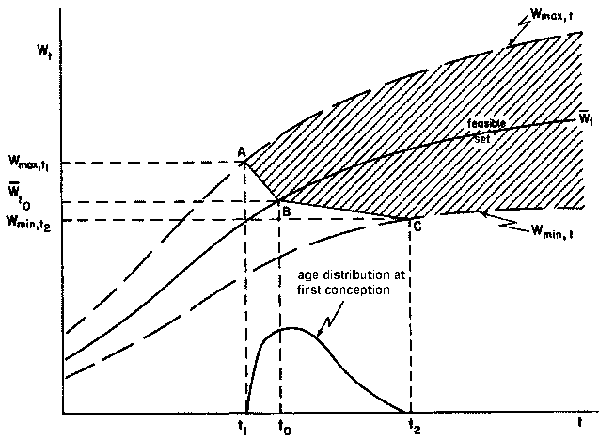
The actual probability of conception during a given month of the breeding season is also a function of the liveweight condition of the animal (c) and the number of months post-partum (n). As data on the effects of these two factors are usually limited, the simplest formulation of their effects is considered here, subject to validation for particular systems. Their respective effects are incorporated into the model in a multiplicative fashion as shown in Figures 3.11 and 3.12. The condition multiplier (mc) implies a reduction in the probability of conception to 60% of its expected value when the animal has lost considerable weight (c = 0). Conception is more favourable than normal for animals at higher than average weights, with a maximum probability of conception at c = 0.90. For over fat cows, with a condition index greater than 0.90, the probability of conception is assumed to be slightly depressed. Analytically, the assumed impact of liveweight on the probability of conception is:
mc = 0.60+1.5c for c £ 0.20
mc = 0.833 + 0.33c for 0.20 < c £ 0.90
mc = 3.233 - 2.333 c for c > 0.90.
The post-partum period multiplier (mn) implies a complete prohibition of conception during the 1st month post-partum and no effect thereafter. Analytically, this multiplier is defined as:
mn = 0.0, for n < 2
mn = 1.0 for n ³ 2.
In summary, the probability of conception for an animal of age t, of condition c, at the n'th month post-partum is given by the relationship:
... (3.18)
where:  is derived from
the solution of equation (3.17), given
is derived from
the solution of equation (3.17), given  and
L.
and
L.
Figure 3.11 Assumed multiplicative effect (mc) of liveweight condition index (c) on the probability of conception
3.3.3.3 Births. Conception in the model leads to a birth after a 9-month gestation unless the cow dies during this period. The sex of the newborn calf is determined probabilistically, with equal probability for either sex. If the calf is a male, no other attribute is determined at the time of its birth. However, for female calves three attributes are determined probabilistically at birth, based on the a priori probabilities of their occurrence in the simulated herd due to chance or genetic inheritance. These are conformation, fertility and milk let-down capacity.
From experience, and according to his preference and standards, a herd manager will judge a female calf as having an acceptable or unacceptable conformation for retention as a breeding cow. The probability of a female calf actually being born with bad conformation is provided as data. A random number between 0.0 and 1.0 is drawn for each female calf born if the number drawn is less than the bad conformation probability, the calf is identified as having bad conformation and is designated to be culled according to the particular policy followed for the herding system under study.
Some fraction, usually small, of a population of females of any particular breed will never conceive because of a variety of disorders. This intrinsic infertility rate is one of the determinants of the overall fertility of a herd; its importance relates directly to the cost of maintaining an unproductive female until the herd manager can detect her infertility. While there are diseases which might result in infertility of previously fertile cows, it is assumed that such occurrences are of minor importance and accounted for in the specification of overall fertility rates. Hence the concern here is only infertility relating to probabilistic intrinsic factors.
In the simulated herd this intrinsic infertility is determined at the time of a female's birth. The fraction of barren heifers out of the total number of heifers that reach reproductive age can usually be established from records made over a period of years. When a female calf is born, a random number between 0.0 and 1.0 is drawn from a uniform distribution. If this number is less than the given fraction of barren females, then that female is identified as barren. Until the point when they would be identified by management, all barren females are treated as any other females, subject to the same management policies. Barren females are disposed from the herd only when a culling policy is applied in regard to reproductive performance; if such a policy is absent then a barren cow will stay in the simulated herd for an extended period until it dies or is sold for some other reason.
The capacity of a lactating cow to let down milk for human offtake relates to its breed type, and within a breed to the particular psychosynthesis of individual dams. In a female calf this particular attribute can be considered inherited from its dam or attributed totally to chance. In either case, it is assumed that the fraction of cows that let down milk is known for the herd under study, as well as the portion of the milk yield that they let down. Whether a newborn female will be able to let down milk during her reproductive life is again determined probabilistically by drawing from a uniform probability distribution between 0.0 and 1.0 and comparing the number drawn with the specified probability that a female in the herd will be able to let down milk. If the number drawn is greater than this value then milk can be taken in the absence of a suckling calf. The maximum fraction of milk which can be taken in the absence of a calf is provided as data to the model.
This cattle model focuses on the dynamics of herd-level productivity in response to different nutritional regimes and management practices. Because the principal source of variability in the model is in the quantity and quality of forage on offer, in any run of the model the simulated nutritional status of animals could vary considerably, and some losses could occur in the simulated herd due to nutritional stress. Thus, the model is structured so that deaths can occur due directly to nutritional stress if harsh production environments are being simulated. Additionally, the model allows for 'normal' losses caused by a complex set of factors not directly related to nutritional status.
As detailed in Section 3.3.2.1, the liveweight of any animal in the simulated herd is bounded from below according to its age and sex. The lower boundary corresponds to the lowest observed liveweights of animal alive in the herd. If an animal loses sufficient liveweight or does not gain liveweight as it should in accordance with its increasing age, its age/liveweight combination may fall below this lower boundary, in which case death occurs with certainty due to starvation.
In addition, in each month of the simulation each animal has a chance of death independent of its nutritional status. In this way the model accounts for the wide range of causes of death in real production systems. The specification of this source of mortality is based on observed annual 'normal' mortality rates for each age class in the absence of nutritional stress. Annual mortality rates are different for different animal classes. In some systems, a high mortality rate is observed for calves to 1 year of age. After the animals pass their early growth stage, their chances of survival increase rapidly. The lowest death rates are typically observed for animals from about 4 to 9 years. After that, problems associated with old age appear which are manifested in progressively increasing death rates.
These general observations suggest that to simulate mortality with a reasonable degree of accuracy, age-related differences in mortality rates must be taken into account. This is done in the model by specifying two age groups, animals younger and older than 1 year. Within the first group calves up to 3 months are treated separately. Thus, if S1 is the survival rate to 3 months and S2 the survival rate to 1 year, then the monthly probability of death to 3 months (P1) and the monthly probability of death from 4 months to 1 year can be calculated as:
... (3.19)
... (3.20)
The monthly mortality rates obtained from (3.19) and (3.20) are the test values in binomial trials where a random number between 0.0 and 1.0 is drawn for each animal from a uniform distribution. If the number drawn is less than the test value corresponding to the animal's age, then death occurs and the animal is removed from the herd.
Annual mortality rates for animals over 1 year old are disaggregated by age. In cases where age-specific information is not available, Appendix E provides a procedure for estimating age-related mortality rates from a minimum of data. Annual mortality rates are used to calculate monthly rates, such that when compounded over 12 months they give the annual rates. As in the ease of calves, these monthly mortality rates are the test values in binomial trials. For example, if the annual mortality rate for a given age is 5% (i.e. survival probability of 95% over a year), then the appropriate test value in the binomial trial is .0043 (where (1 - .0043) 12 = 0.95). A random number between 0.0 and 1.0 is drawn and if it is less than the test value death occurs.
3.4.1 Supplementary feeding
3.4.2 Milk offtake
3.4.3 Weaning
3.4.4 Breeding
3.4.5 Purchases
3.4.6 Sales
3.4.7 Drought policy
Costs are incurred directly or indirectly when livestock are fed with supplements. Purchased feeds incur direct costs. Farm-produced supplements may be available, but in the context of the productivity of the whole farm it might be more advantageous to use them in another way, rather than feeding them to the cattle herd. In both eases, the type, quality and quantity of feed supplements available for livestock are limited. Thus, the level of supplementation, its allocation between different classes of stock and its seasonal distribution are important economic questions.
As indicated in Section 3.3.1, two distinct kinds of supplementary feeds are considered: concentrates and improved quality forages. Additionally, it is assumed that supplements are only given when the digestibility of forage on offer is below a certain specified threshold level. The maximum quantities of supplements available per head are also specified by management.
Supplements are usually provided only to particular classes of animals in the herd. Animals with higher energy needs, higher production potential or those considered essential to the long-term viability of the herd are commonly given preference. In the model a limited number of different animal classes can be supplemented. These are:
1. female calves prior to weaning when the quantity of milk available from their dams is below a certain level (X1)2. male calves prior to weaning when the quantity of milk available from their dams is below a certain level (X2)
3. female calves for a specified period in months (X3) after weaning
4. male calves for a specified period in months (X4) after weaning
5. lactating cows for a specified period in months (X5) after calving
6. pregnant cows for a specified period in months (X6) before calving
7. non-pregnant cows for a specified period in months (X7) before the beginning of the breeding season. This class only applies in a controlled breeding situation (see Section 3.4.4).
8. steers for a specified period in months (X8) before the planned sale date
9. all animals whose weight drops a certain percentage (X9) below their expected weight.
In addition to these specifications for particular animal classes, threshold levels of forage digestibility (d*fi) must be specified for each animal class below which supplementation takes place, as well as the quantities of concentrates (Iaci) and/or improved forage (Iasi) available to each class and their respective digestibilities (dci) and (dsi).
An example of a supplementation policy is given in Table 3.5, with three classes of animals specified for supplementation. Female calves (class 1) are supplemented prior to weaning with a maximum of 0.75 kg dry matter/day of concentrates of 83% digestibility if less than 2 kg/day of milk are available to them and if the digestibility of the forage on offer is below 60%. Lactating cows (class 5) are supplemented for the first 4 months after calving with a maximum of 2.5 kg dry matter/day of improved forage of 65% digestibility if the digestibility of the forage on offer is below 50%. Steers (class 8) are supplemented for 3 months before sale with a maximum of 2.0 kg dry matter/day of improved forage of 65% digestibility, if the digestibility of the forage on offer drops below 45%. An appropriately high threshold level for any class will cause the animals in that class to be supplemented independently of the digestibility of the available forage, if so desired.
Table 3.5 Example specification of supplementation options a
|
Class to be Supplemented (i) |
Xi |
d*fi |
Iaci |
dci |
Iasi |
dsi |
|
1 |
2 |
0.60 |
0.75 |
0.83 |
- |
- |
|
5 |
4 |
4.50 |
- |
- |
2.5 |
0.65 |
|
8 |
3 |
0.45 |
- |
- |
2.0 |
0.65 |
a See text for variable definitions.
Some cattle breeds require stimulation by their calves before they will let down milk for human offtake. In these eases, only cows with a calf at foot can be milked, and lactation will cease when the calf is weaned. Other breeds can be milked with or without a calf, with no difference in total daily yield. The capacity of a breed to let down milk without a calf is incorporated in the model with the specification of the milk let down fraction, as described in Section 3.3.3.3. After calves are weaned, only this fraction of the total potential milk yield can be removed for human consumption.
Milk offtake for human consumption reduces the energy available to the suckling calf. It can also make additional energy demands on the lactating cow if milking together with suckling results in more milk taken than by the calf alone. A rational manager milks cows selectively, taking into account the condition of both cows and calves. Thus, lactating cows are grouped into a limited number of classes for modelling the milking process. A milking policy is based on a set of rules provided as data to a simulation run, comprising any combination of the following options:
1. A maximum percentage (X1) of a cow's daily milk yield can be taken from cows with a female calf at foot.2. A maximum percentage (X2) of a cow's daily milk yield can be taken from cows with a male calf at foot.
3. For female calves, no milk offtake is allowed if the weight of the calf drops below a certain percentage (X3) of its expected weight (
4. For male calves, no milk offtake is allowed if the weight of the calf drops below a certain percentage (X4) of its expected weight (
5. A maximum percentage (X5) of the cow's daily milk yield can be taken from cows in their first lactation.
6. No milk offtake is allowed if the total daily yield is below a certain level (X6).
7. No milk offtake is allowed if the weight of the lactating cow drops below a certain percentage (X7) of its expected weight (Wt in Section 3.3.2.1).
8. No milk offtake is allowed from a cow more than a specified number of months (X8) pregnant.
A milking policy specified, for example, with X1 = 40%, X2 = 60% and X3 = 80% implies a maximum milk offtake of 40% for a cow with a female calf and 60% for a cow with a male calf. Additionally, milk offtake from cows with female calves will cease whenever calf weights drop below 80% of expected levels.
The weaning component of the model takes into consideration explicit policies specified by management (controlled weaning) and particular circumstances when the dams cannot provide sufficient milk for their calves (enforced weaning). Controlled weaning can be specified in two ways. All suckling calves may be weaned in a particular calendar month regardless of their age or liveweight. Such an option is only relevant in a controlled breeding situation when the calves are all approximately the same age. Otherwise, calves may be weaned individually when they reach prespecified ages and liveweights.
Enforced weaning occurs before the appropriate calf age and liveweight levels have been reached if the dam dies, if her milk production ceases, or if she reaches the 8th month of her next pregnancy. These checks are made before the controlled weaning algorithm is executed.
For both controlled and enforced weaning the linkages between the dam and her calf are broken. Thereafter in the simulation, the calf is treated as a separate animal.
The breeding policy used in the model includes control over the breeding season and the condition and age of the animals to he bred. The breeding season is specified in terms of the calendar months each year when conception can take place. In this way, two or more separate breeding seasons could be specified. E no particular breeding season is specified, the model assumes year-round breeding. Within any month of the breeding season, the liveweight and age of each individual female must exceed prespecified limits. If such limits are not specified, then every mature female has access to breeding regardless of liveweight and age.
Herds are often built up in ranch development schemes by purchasing heifers as breeding stock. Because these purchases are usually financed by loans, they are scheduled in advance over a period of years, with the type of animal purchased and the time of purchase each year detailed in the ranch development programme. Because the elapsed time between the acquisition of breeding stock and the sale of their progeny is typically at least 3 or 4 years, the ranches will, overall, have negative cash flows during this period. For this reason, short-term steer-raising enterprises are often included in the first years of a ranch development programme to provide a high rate of capital turnover and a cash surplus needed to finance the negative cash flow of the breeding enterprise. So that the model can be used in ranch development schemes, it permits detailed specification of both heifer and steer purchases.
It is recognized that opportunistic purchases of stock can and do take place. However, such purchases depend upon many factors, including the manager's perception of risk, the availability of cash and the relative and absolute prices of stock and forage, so they are considered beyond the scope of the current model.
In this model, stock purchases can be made only during the first 5 years of a run. Heifers and steers purchases are specified as follows:
1. Heifers can be bought during a given calendar month (d1) at a certain age (t1) and weight (W1), and in numbers N11, N12, ... , N15 for the first 5 years of operation respectively.2. Steers can he bought during a given calendar month (d2) of a certain age (t2) and weight (W2), and in numbers N21, N22, ... , N25 for the first 5 years of operation respectively.
An example of a buying policy is given in Table 3.6. In this example,, 46 heifers are bought in the first 5 years, all during the 5th calendar month (May), at an age of 36 months and weighing 240 kg: 15 are bought in year 1, 12 in year 2, 8 in year 3, 6 in year 4, and 5 in year 5. Thirty-five steers are bought in July (month 7), at an age of 24 months and weighing 200 kg: 20 are bought in year 1, 10 in year 2, 5 in year 3 and none in years 4 or 5.
Purchased animals are treated exactly the same way as other animals the simulated herd; they are subject to the same breeding, supplementary feeding and selling policies.
Table 3.6 Example specification of a buying policy
|
Class of Animals Acquired |
Calendar Month of Acquisition |
Age of Acquired Animals (months) |
Liveweight of Acquired Animals (kg) |
Number Acquired During First 5 Years of Run |
||||
|
1 |
2 |
3 |
4 |
5 |
||||
|
Heifers |
5 |
36 |
240 |
15 |
12 |
8 |
6 |
5 |
|
Steers |
7 |
24 |
220 |
20 |
10 |
5 |
- |
- |
As with buying policy, only prespecified selling rules are included in the model; opportunistic sales are not modelled. Animals are sold when they are no longer considered productive, when they reach planned market weights or ages or if the total female herd exceeds the target size, giving a marketable surplus of heifers.
Sales of individual animals depend on liveweight and age conditions which have been specified for different classes of stock. These conditions are entered as data and apply throughout a run:
1. Males after they reach a certain age (t1) and weight (W1) are sold in a specified calendar month (d1).2. Females above a certain weight (W2) which do not calve by a certain age (t2) are sold in a specified calendar month (d2).
3. Females with poor conformation are sold in a specified calendar month (d3) after reaching a certain age (t3) and weight (W3).
4. Cows which have not conceived for an extended period (t4) since their last calving are sold in a specified calendar month (d4).
5. Cows which are neither lactating nor pregnant and have reached old age (t5) are sold in a specified calendar month (d5).
An example of a sales policy is given in Table 3.7. Males, barren females and females with poor conformation are sold during the 5th calendar month (May) when they reach 42, 60 and 42 months of age and weigh at least 350, 270 and 250 kg respectively. Cows are sold during the 9th calendar month (September) in either of two cases: if they have not conceived for at least 30 months after their last calving, or when they reach old age, specified in this example as 120 months.
Table 3.7 Example specification of a selling policy for individual animals in different classes
|
Animal Class (i) a |
Calendar Month of Sale |
Critical Age in Months (ti) |
Critical Weight in Kg (Wi) |
|
1 |
5 |
42 |
350 |
|
2 |
5 |
60 |
270 |
|
3 |
5 |
42 |
250 |
|
4 |
9 |
30 |
- |
|
5 |
9 |
120 |
- |
a As specified in text.
A second set of sale policy options available in the model specifies the conditions under which excess heifers are sold. Based on resource carrying capacity or other considerations, a target size of the breeding herd may be specified. The breeding herd includes all females which have reached reproductive age and have had at least one exposure to breeding. If this target size is exceeded, then the excess heifers are sold.
In systems where the quantity and quality of forage on offer vary widely from year to year, a sequence of years of poor forage may occur, leading to a drought situation. The effect on the herd of such a situation will depend on many factors, including the prior condition of the individual animals, the age and sex composition of the herd and the management response, which could include strategic emergency sales of animals and/or supplementary feeding.
In the context of the model, a situation is defined as a drought when the average liveweight condition index of the herd at the beginning of a simulated month is below a certain threshold value and the digestibility of the forage on offer during that month is not sufficient for maintenance of the reference animal. The threshold condition index for the herd used in the model is 0.10.
In such a drought situation, the model assumes that all animals other than. those in the breeding herd are sold. Calves at foot are weaned and sold and all lactating cows are dried off. All remaining animals in the breeding herd receive sufficient supplementation to maintain liveweight, with allowance for pregnancy requirements where appropriate. The quality of the drought supplement is provided as data to the model. The occurrence and duration of drought situations and the total quantity of strategic supplements provided are reported at the end of each run.
![]()
![]()
![]()


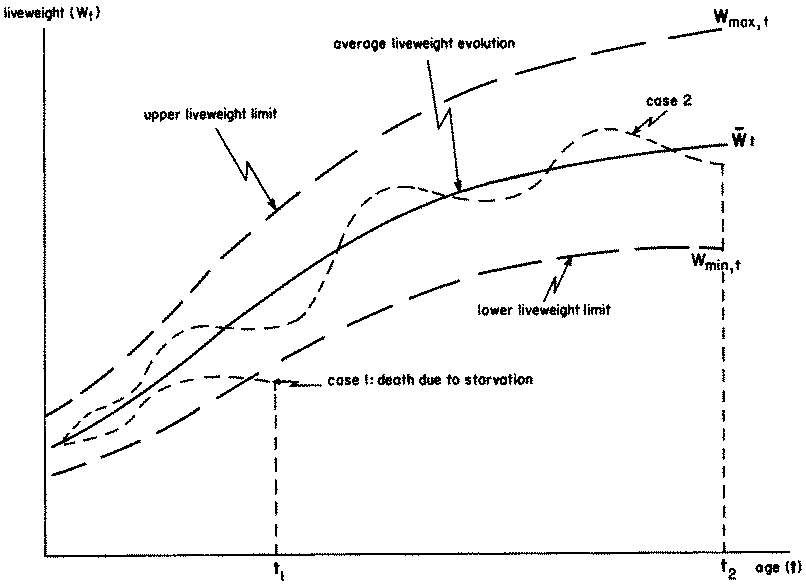
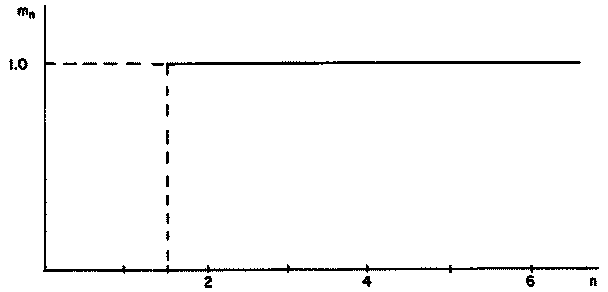