![]()
![]()
![]()
Cattle population structure
Small ruminant population structure
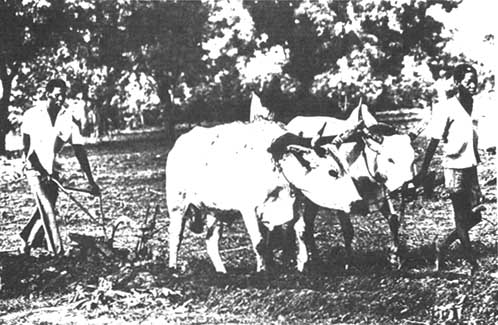
With the exception of a relatively small number of animals owned purely as an investment, cattle are kept principally to provide milk for subsistence or draught power for agriculture (Figure 25). Minor functions of cattle are as drawers of carts, for lifting water from deep wells (especially in the north of the area), and to provide manure for fertilizing fields. Some transhumant groups use oxen as burden animals for the transport of people, personal effects and camp gear.
Small ruminants are kept primarily as a source of meat and as a ready source of cash. Macina sheep, however, also provide wool and milk (Section 5, Table 16), Maure sheep provide hair, and a large proportion of goats is milked at least some time in the course of a life cycle.
The age and particularly the sex composition of herds is regulated to a great extent by the main herd functions. Table 17 shows some typical herd structures in the different production subsystems of central Mali. Although the functions of these particular herds are known, in this case it would be possible to deduce the functions from the demographic structure alone. The high percentage of mature castrates in the two main cultivating groups is a result of the requirement for draught oxen. These herds are not, however, able to maintain themselves by recruitment from breeding, and draught animals have to be purchased from other ethnic groups.
Figure 25. Work oxen ploughing a field in central Mali after the early rains.
Table 17. Cattle herd structures (%) in central Mali.
|
Class of stock |
Ethnic group, type of management and use |
||||||
|
Bambara, sedentary, milk and draught |
Mixed, sedentary, draught and milk |
Fulania, transhumant, milk and transport |
Fulania, transhumant, milk |
Rimaibe, sedentary, milk and draught |
Tuarega nomadic, milk and transport |
||
|
Males |
|||||||
|
|
<1 year |
5.6 |
7.2 |
9.9 |
9 |
15 |
16.3 |
|
|
1-3 years |
8.5 |
9.3 |
12.5 |
6 |
13 |
9.3 |
|
|
>3 years |
32.7 |
46.3 |
15.6 |
6 |
8 |
12.2 |
|
Total |
46.8 |
62.8 |
38.0 |
21 |
36 |
37.8 |
|
|
Females |
|||||||
|
|
<1 year |
6.2 |
5.7 |
10.2 |
10 |
15 |
9.8 |
|
|
1-3 years |
11.3 |
11.1 |
15.2 |
24 |
12 |
14.7 |
|
|
>3 years |
35.7 |
20.2 |
36.1 |
45 |
38 |
37.6 |
|
Total |
53.2 |
37.0 |
62.0 |
79 |
65 |
62.1 |
|
|
Castrates as % of total herd |
32.3 |
43.4 |
9.3 |
4 |
7 |
12.9 |
|
a From Sangare (1983).
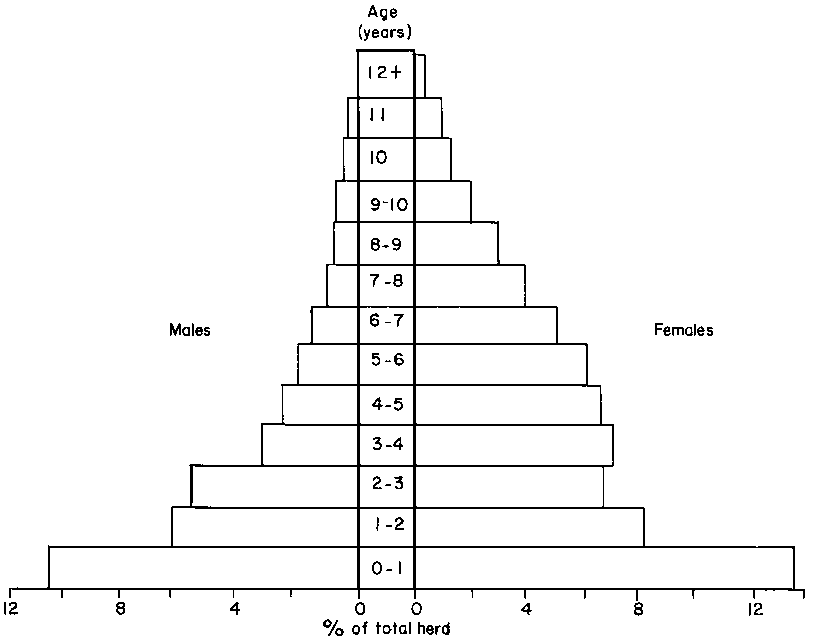
In herds where milk is the major product (the detailed structure of such a herd is given in Figure 26), the proportion of breeding females is in the region of 40% of all animals: about two-thirds of these females, or a total of 25 to 27% of the herd, can be expected to be lactating at any one time. Even in the urban herds, which are generally considered to have milk as the primary output, these figures hold true (Table 18). It needs to be remembered that, where milk is a product, the milk taken for human consumption is at the expense of the calf, as no concentrates or substitutes are fed other than some coarse roughages. This practice has repercussions on calf growth and survival.
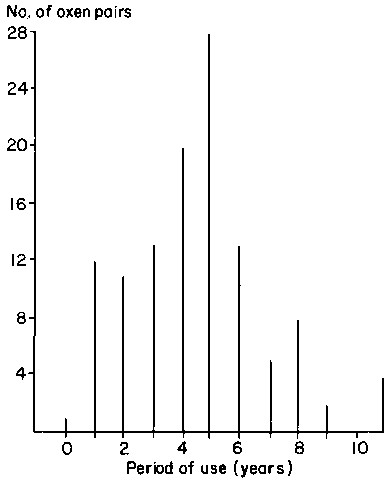
Oxen are usually trained to the plough and start work at about 4 years of age. It is possible that in both the millet and rice subsystems oxen are being kept to an age at which they are relatively inefficient producers of power. If this is the case (and Figure 27 provides some evidence that it is), it results from the extremely slow growth rate and late maturity of this class of stock, the difficulties in replacing them, particularly in recent years, and (even when supplied on credit) the amortisation cost. There will be a continuing demand for work oxen. The best means of satisfying this demand is probably to improve early nutrition to ensure entry into the work force at a younger age. This will result in either prolonging their working life or permitting their retirement at a younger age, giving better carcass quality. Whether limited feed resources should be devoted to this target or whether they should be used for breeding cows and currently working animals needs further study.
Fulani transhumant herds provide a reserve of mature male animals for transfer as draught animals to the neighbouring agropastoral systems. The herds of the latter, in particular those of the rice subsystem, have too few breeding cows whose fertility levels are too low to ensure herd stability. As a result mature draught animals must be purchased to maintain herd numbers and structure. Our assessment of the numbers of work oxen in the irrigated areas is in general accord with the returns of the Office du Niger although in some villages up to 70% of the cattle are recorded as work oxen and figures of 55% are not uncommon. Such an unbalanced herd structure has obvious repercussions on the stocking rate, and it is necessary for each head of cattle in the rice subsystem to be counted as 0.94 TLU and for each in the millet subsystem as 0.90 TLU. This compares with a 'normal' value for cattle herds of 0.73 TLU.
As for cattle, the age and sex composition of small ruminant flocks is regulated by the main functions of the flocks, but to a considerably lesser degree.
Figure 26. Population structure a Fulani herd with milk as a primary function.
Table 18. Age and sex structure of cattle populations in three urban areas in central Mali.
|
Age (years) |
Nionoa (n = 588) |
Ségoub (n = 901) |
Mopti and Sevarec (n = 743) |
|||
|
M (%) |
F (%) |
M (%) |
F (%) |
M (%) |
F (%) |
|
|
<1 |
12.76 |
14.46 |
12.65 |
14.54 |
18.71 |
23.15 |
|
1-2 |
4.59 |
3.06 |
6.10 |
7.55 |
2.29 |
7.81 |
|
2-3 |
4.42 |
4.42 |
3.00 |
5.11 |
0.94 |
1.75 |
|
3-4 |
1.02 |
5.27 |
1.44 |
3.33 |
0.27 |
2.83 |
|
4-5 |
4.42 |
21.77 |
1.66 |
2.66 |
0.40 |
12.65 |
|
>5 |
4.59 |
19.22 |
7.77 |
34.18 |
2.02 |
27.19 |
|
Total |
31.80 |
68.20 |
32.62 |
67.37 |
24.63 |
75.38 |
Sources: a Fayinke (1980); b Maiga (1980); c Ballo (1980).
Examples of flock structures in a number of central Malian societies are given in Table 19 for goats and in Table 20 for sheep. Male sheep and goats (whether entire or castrated) in general contribute about 25% of total numbers. Offtake of males (in addition, perhaps, to a higher death rate at very young ages) commences early, before 6 months of age in the better-managed flocks. In strict husbandry terms, males capable of breeding are in excess of the 2.5% actually required, but the possibilities of loss and of temporary sterility due to nutritional or disease stresses have to be considered. Moor sheep flocks have a ratio of breeding males to females of 1:13 while that of Fulani flocks is 1:15. For both these ethnic groups sheep provide wool as well as meat, and mature entire males therefore contribute to flock economics in addition to fulfilling a breeding role. With the exception of the Tuareg nomadic flocks only in Fulani Macina sheep flocks do castrates contribute significantly to flock numbers - a further indication of the importance attached to wool production by the Fulani.
Figure 27. Distribution of oxen pairs by current working life in a central Malian village.
No comparative data on pre- and post-drought flock structures are available. This is unfortunate but it is probable that with the rapid rate of flock turnover and high levels of nasality any effects would be of an ephemeral nature. With the exception of the structure of Macina flocks (Table 16) there was little evidence in central Mali of any system of flock stratification other than the short-term separation of kids and lambs from their dams at very young ages.
Table 19. Flock structures of goats owned by some ethnic groups in central Mali.
|
Ethnic group |
Management system |
Total no. of animals
|
Males (%) |
Females (%) |
||||||
|
Total |
>14 months |
<14 months |
Castrates |
Total |
>14 months |
<14 months |
Breedinga |
|||
|
Tuaregb |
Pastoral/nomadic |
648 |
21.0 |
11.4 |
9.6 |
5.4 |
79.0 |
66.0 |
13.0 |
70.3 |
|
Tuareg |
Pastoral/transhumant |
702 |
26.2 |
5.6 |
20.6 |
5.0 |
73.8 |
46.8 |
27.2 |
55.9 |
|
Fulanib |
Pastoral/transhumant |
569 |
21.0 |
6.3 |
14.7 |
4.0 |
79.0 |
60.4 |
18.6 |
66.6 |
|
Fulanic |
Agropastoral/transhumant |
346 |
28.6 |
7.8 |
20.8 |
8.1 |
71.4 |
49.7 |
21.7 |
56.9 |
|
Moor |
Pastoral/transhumant |
682 |
20.2 |
3.4 |
16.8 |
1.2 |
79.8 |
51.8 |
28.0 |
59.1 |
|
Bambara |
Agropastoral/sedentary |
926 |
24.9 |
5.5 |
19.4 |
3.6 |
75.1 |
52.8 |
22.3 |
60.2 |
a Females older than 10 months.
b Peacock (1983).
c Fulani agropastoralists in the Niger inundation zone own also Macina sheep.
Table 20. Flock structures of sheep owned by some ethnic groups in central Mali.
|
Ethnic group |
Management system |
Total no. of animals |
Males (%) |
Females (%) |
||||||
|
Total |
>14 months |
<14 months |
Castrates |
Total |
>14 months |
<14 months |
Breedinga |
|||
|
Tuaregb |
Pastoral/nomadic |
933 |
26.4 |
12.3 |
14.1 |
14.0 |
73.6 |
52.3 |
21.3 |
63.5 |
|
Tuareg |
Pastoral/transhumant |
667 |
27.4 |
6.8 |
20.6 |
5.0 |
72.9 |
46.7 |
26.2 |
61.7 |
|
Fulanib |
Pastoral/transhumant |
215 |
29.8 |
7.5 |
22.3 |
5.1 |
70.3 |
46.5 |
23.8 |
60.5 |
|
Fulanic |
Agropastoral/transhumant |
4 543 |
25.5 |
10.2 |
15.3 |
11.2 |
74.5 |
45.3 |
29.2 |
63.3 |
|
Moor |
Pastoral/transhumant |
1 045 |
22.9 |
6.9 |
16.0 |
6.2 |
77.2 |
51.5 |
25.7 |
66.0 |
|
Bambara |
Agropastoral/sedentary |
241 |
23.5 |
2.0 |
21.5 |
2.1 |
75.5 |
45.4 |
30.1 |
62.4 |
a Females older than 10 months.
b Peacock (1983).
c Fulani agropastoralists in the Niger inundation zone own also Macina sheep.
![]()
![]()
![]()