![]()
![]()
![]()
Meat production: A case study at Niono slaughterhouse
Milk production
Productivity indices
Numbers and seasonality of animals slaughtered
Sex and age structure
Carcass weights
Contribution of cattle to meat supply
In the year from March 1979 to February 1980, a total of 1075 cattle, 643 sheep and 5794 goats were slaughtered at Niono slaughterhouse. Chi-square tests showed highly significant differences (P<0.001) in the monthly numbers of animals slaughtered. There were significant increases (P<0.01) in the numbers of cattle (1210) and sheep (756) slaughtered in the following year (March 1980-February 1981) but not (P>0.05) in the numbers of goats (5858). A very small number of camels - 20 to 30 head per year - were also slaughtered.
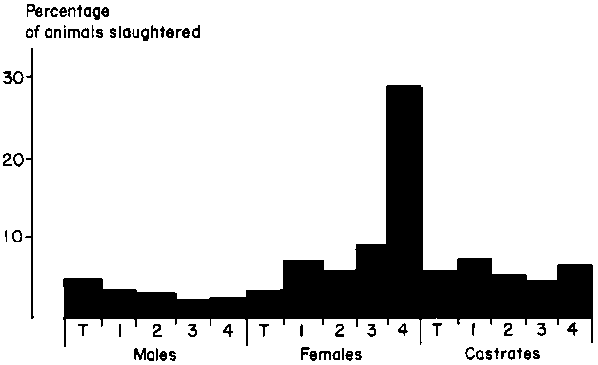
For all three species, females were the dominant sex slaughtered although to a lesser extent in the case of goats. This is well illustrated by Figure 38 which shows that 68% of castle, 76% of sheep and 54% of goats slaughtered at Niono were females. The greater numbers of females slaughtered are due to a considerable extent to the much greater demand for male animals for export (in the case of cattle and sheep), and also to the demand for work oxen.
For all species, females were generally in the older age ranges having outlived their useful reproductive life. Broken-mouthed animals totalled some 25% of all females in the oldest age group (both full and broken-mouthed females are shown with four pairs of permanent incisors in Figure 38).
The overall weighted mean carcass weight for cattle was 109.4 kg. This is 32.6% lower than the official figure of 145 kg used in national statistics.
As can be seen from Figure 39, cattle provided most of the marketed meat in Niono town, this being equivalent to about 60% of the total supply. At certain times of the year, however, they provided less meat than goats, indicating some complementarity of these two species. Beef available to the urban population of Niono through commercial channels was 7.5 kg per person in 1979/1980 and 7.8 kg in 1980/1981, excluding edible offal. However, cattle do not provide proportionately as much offal as do small ruminants due to the significantly smaller proportion of lungs (X² = 9.13, d.f. = 1, P<0.01) and liver (X² = 10.40, d.f. = 1, P<0.01) condemned for diseased states among small ruminants.
Few data were obtained on this characteristic. Average milk offtake for human consumption was estimated to be 1.088 litres per day with a range of 0.502 to 2.490 litres for individual animals at different stages of lactation. Lactation length averaged 297 ± 81 days in the range 200 to 506 days. Total lactation offtake for human consumption was estimated at 323 litres.
The characters of calf weight at 12 months of age, reproductive performance (expressed as the parturition interval) and calf survival (the death of a calf resulting in a zero index for that cow) have been used to construct productivity indices for individual cows.
The three indices used were calculated as:
|
Index I |
|
|
Index II |
|
|
Index III |
|
Sex and agea composition of animals slaughtered at Niono slaughterhouse.
Figure 38.a. Cattle
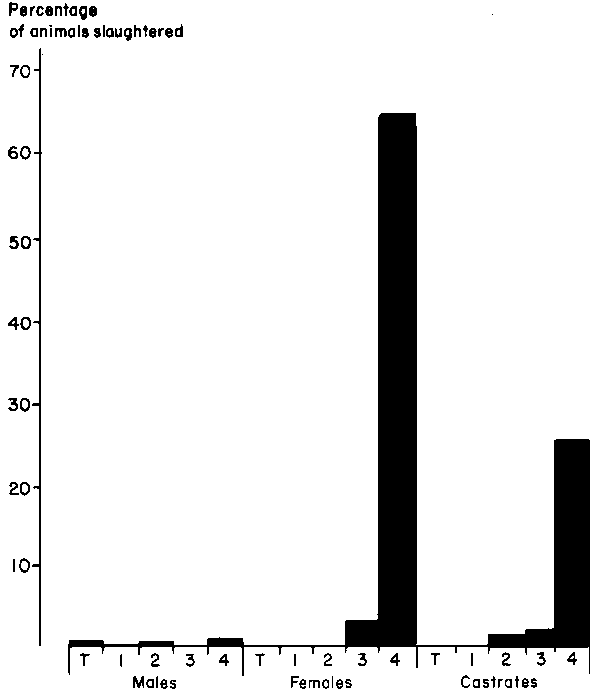
Figure 38.b. Sheep
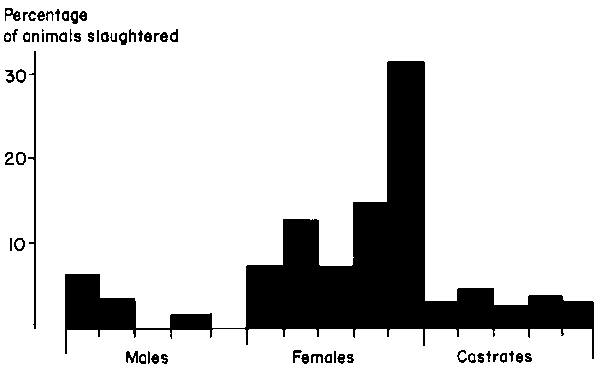
Figure 38.c. Goats
In total, 247 indices were calculated and were used in least-squares analysis to test for the effects of different variables on the indices. Year effects were not tested because of the long parturition intervals in relation to the total period of the study. The results of the analysis of variance for the three productivity indices are shown in Table 30.
The least-squares means of the three productivity indices are given in Table 31. Only parity had any significant effect on productivity, first carvers being less productive than all other classes of cows except third carvers. No other variable exerted a significant effect, this probably being due to the overall poor level of performance.
Herd productivity would be less by some 5% than that given in Table 31 due to deaths of breeding females.
Figure 39. Species contribution to meat supplied from Niono slaughterhouse.
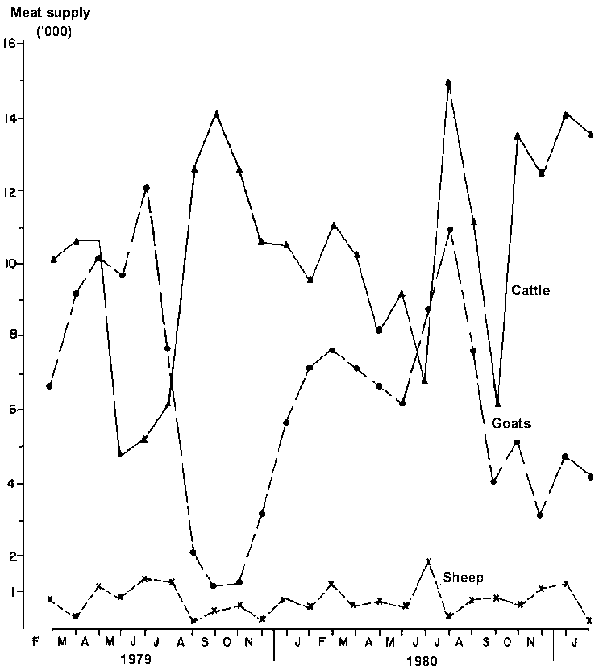
Table 30. Analysis of variance of came productivity indices.
|
Source of variation |
d.f. |
Index I |
Index II (x 104) |
Index III (x 104) |
|
System |
1 |
17.0 |
9.2 |
12.6 |
|
Season |
3 |
391.0 |
120.5 |
1 819.5 |
|
Parity |
3 |
2 751.9*** |
246.8 |
5 530.4* |
|
Sex |
1 |
99.6 |
103.5 |
1 677.8 |
|
Herd/millet |
3 |
559.1 |
41.1 |
827.8 |
|
Herd/rice |
4 |
457.9 |
108.2 |
1 935.1 |
|
Error |
132 |
457.8 |
108.2 |
1 935.1 |
***P<0.001; *P<0.05.
Table 31. Least-squares means of came productivity indices.
|
Variable |
n |
|
|
|
|
|
Observed mean |
247 |
34.40 |
164 |
0.698 |
|
|
Overall LS mean |
247 |
36.20 |
163 |
0.704 |
|
|
System |
|||||
|
|
Millet |
106 |
36.61 |
161 |
0.702 |
|
|
Rice |
141 |
35.96 |
166 |
0.707 |
|
Season |
|||||
|
|
Cold dry |
39 |
37.57 |
168 |
0.722 |
|
|
Hot dry |
167 |
36.44 |
176 |
0.747 |
|
|
Rains |
30 |
30.09 |
134 |
0.587 |
|
|
Post-rains |
11 |
41.04 |
176 |
0.762 |
|
Parity |
|||||
|
|
1 |
74 |
28.16a |
140 |
0.586a |
|
|
2 |
50 |
52.09b |
181 |
0.782b |
|
|
3 |
32 |
33.88ab |
155 |
0.677ab |
|
|
4+ |
91 |
41.02b |
178 |
0.722b |
|
Sex |
|||||
|
|
Female |
136 |
35.62 |
157 |
0.677 |
|
|
Male |
111 |
36.95 |
170 |
0.732 |
|
Herd/millet |
|||||
|
|
5 |
11 |
40.45 |
168 |
0.739 |
|
|
7 |
12 |
43.04 |
181 |
0.787 |
|
|
8 |
50 |
32.80 |
148 |
0.636 |
|
|
15 |
33 |
30.17 |
146 |
0.644 |
|
Herd/rice |
|||||
|
|
53 |
39 |
34.45 |
171 |
0.730 |
|
|
60 |
33 |
33.20 |
147 |
0.619 |
|
|
64 |
39 |
33.67 |
149 |
0.643 |
|
|
67 |
16 |
40.71 |
187 |
0.798 |
|
|
69 |
14 |
37.77 |
176 |
0.745 |
Within variable groups, means followed by different letters differ significantly (P<0.05). Variable groups without any letters did not show a significant difference in the analysis of variance.
![]()
![]()
![]()


