![]()
![]()
![]()
3.8.1 Small pelagic fish
3.8.2 Demersal resources
Fish distribution
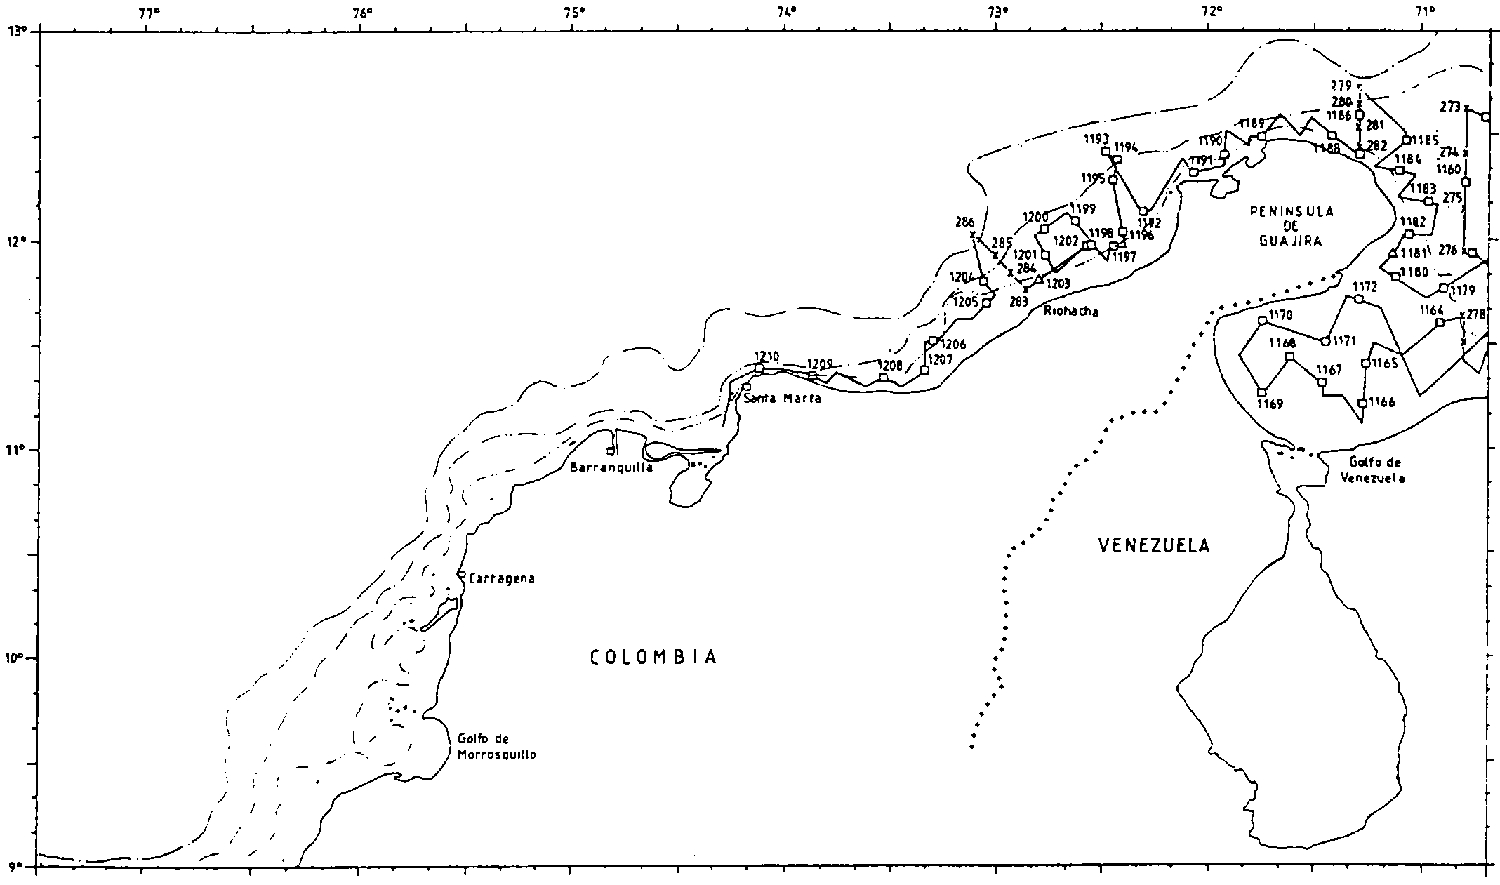
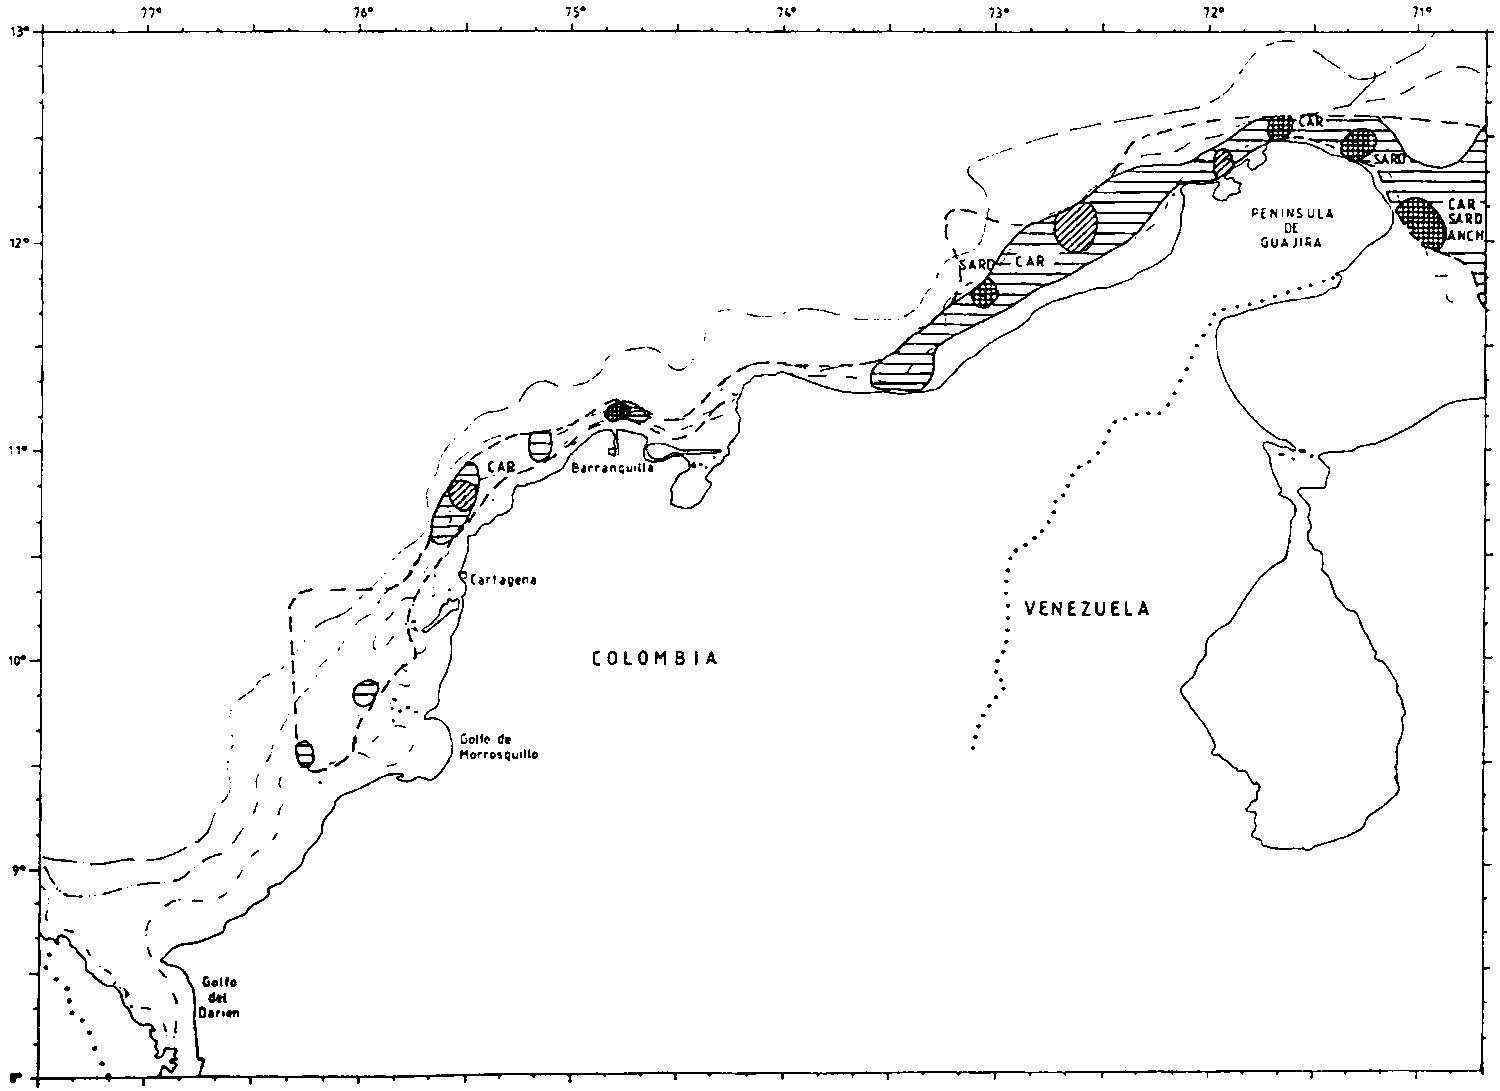
Figure 3.8.2 shows the distribution of densities of pelagic fish based on the acoustic observations. Some aggregations of medium density which represented fish in schools and layers were found in all except the last survey. Most of these are seen to be located to the north and west of the Guajira Peninsula. The aggregations were identified as sardinella, thread herring, some anchovy, carangids and scombrids.
Catch composition
Table 3.8.1 shows a summary of the catch data for the pelagic fish from both bottom and mid water trawl hauls. As emphasized previously in this report these data are not directly representative of the composition of these groups in the sea because of the differences in catchability between species and sizes.
The clupeids and the carangids formed the main part of the pelagic fish in the catches. In the December survey only low catch rates were obtained for nearly all groups indicating a season of low availability. Significant catches of scombrids and barracudas were only obtained in the March survey.
Table 3.8.1 Colombia, Guajira Peninsula to Sta. Marta. Catch rates in kg/hour by main groups by surveys. Mean rate, three highest rates and rate of occurrence. All Hauls.
|
Survey |
Mean rate |
Highest rates |
Rate of occurrence |
|||
|
|
CLUPEIDS |
|
|
|
|
|
|
1 March |
53 |
364, |
288, |
88 |
12/18 |
|
|
2 June |
105 |
1283, |
720, |
245 |
16/27 |
|
|
3 September |
53 |
1216, |
189, |
43 |
18/32 |
|
|
4 December |
21 |
410, |
75, |
28 |
9/25 |
|
|
|
CARANGIDS |
|
|
|
|
|
|
1 March |
36 |
177, |
132, |
77 |
18/18 |
|
|
2 June |
53 |
228, |
225, |
198 |
19/27 |
|
|
3 September |
24 |
247, |
146, |
63 |
27/32 |
|
|
4 December |
25 |
139, |
107, |
84 |
21/25 |
|
|
|
SCOMBRIDS |
|
|
|
|
|
|
1 March |
30 |
195, |
183, |
41 |
14/18 |
|
|
2 June |
3 |
16, |
15, |
14 |
13/27 |
|
|
3 September |
4 |
80, |
18, |
8 |
12/32 |
|
|
4 December |
2 |
13, |
4, |
4 |
7/25 |
|
|
|
BARRACUDAS |
|
|
|
|
|
|
1 March |
12 |
102, |
61, |
24 |
11/18 |
|
|
2 June |
3 |
63, |
9, |
2 |
8/27 |
|
|
3 September |
3 |
55, |
19, |
4 |
8/32 |
|
|
4 December |
1 |
2, |
2, |
2 |
6/25 |
|
Table 3.8.2 Colombia, Guajira Peninsula to Sta. Marta. Species distribution of small pelagic fish. Catch by weight of species by surveys as per cent of total catch of family.
|
Survey: |
1 |
2 |
3 |
4 |
Mean |
|
|
|
CLUPEIDS |
|
|
|
|
|
|
Mean catch, kg/hour |
53 |
105 |
53 |
21 |
|
|
|
Sardinella aurita |
74 |
99 |
11 |
7 |
61 |
|
|
Opisthonema oglinum |
16 |
1 |
82 |
93 |
35 |
|
|
Chirocentrodon bleekerianus |
4 |
|
6 |
|
2 |
|
|
Etrumeus teres |
5 |
|
1 |
|
1 |
|
|
|
CARANGIDS |
|
|
|
|
|
|
Mean catch, kg/hour |
36 |
53 |
24 |
25 |
|
|
|
Trachurus lathami |
26 |
9 |
58 |
10 |
26 |
|
|
Chloroscombrus chrysurus |
17 |
12 |
|
40 |
17 |
|
|
Decapterus spp. |
31 |
59 |
15 |
20 |
41 |
|
|
Selene spp. |
17 |
14 |
10 |
23 |
17 |
|
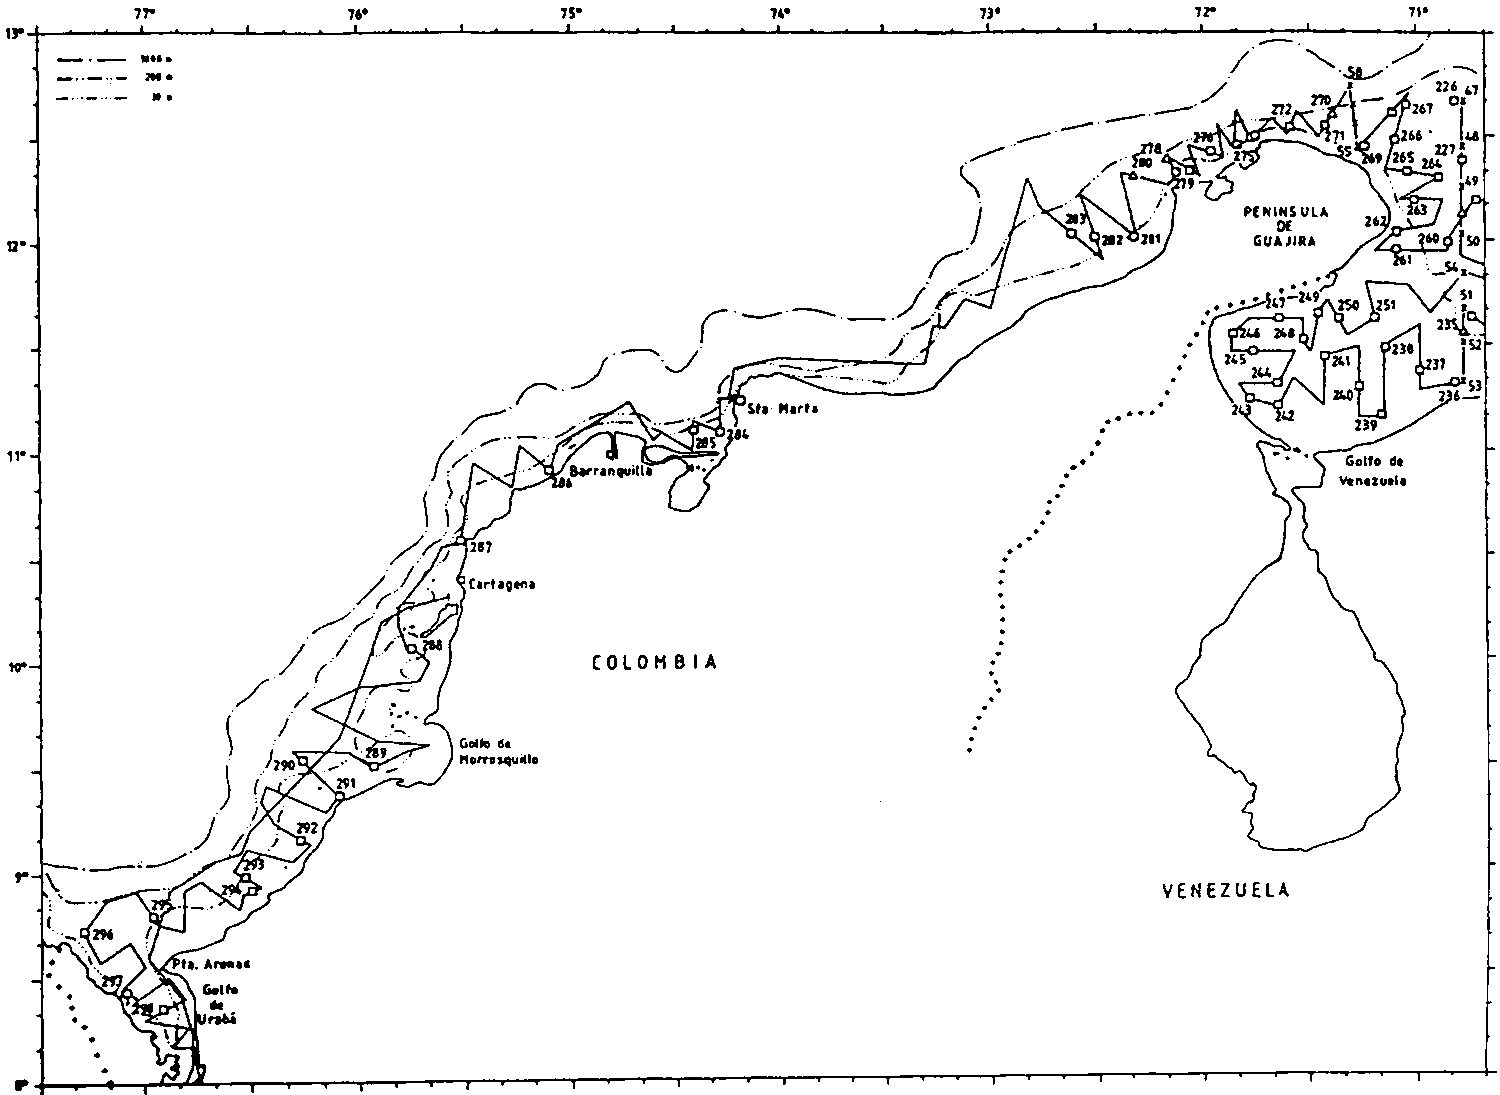
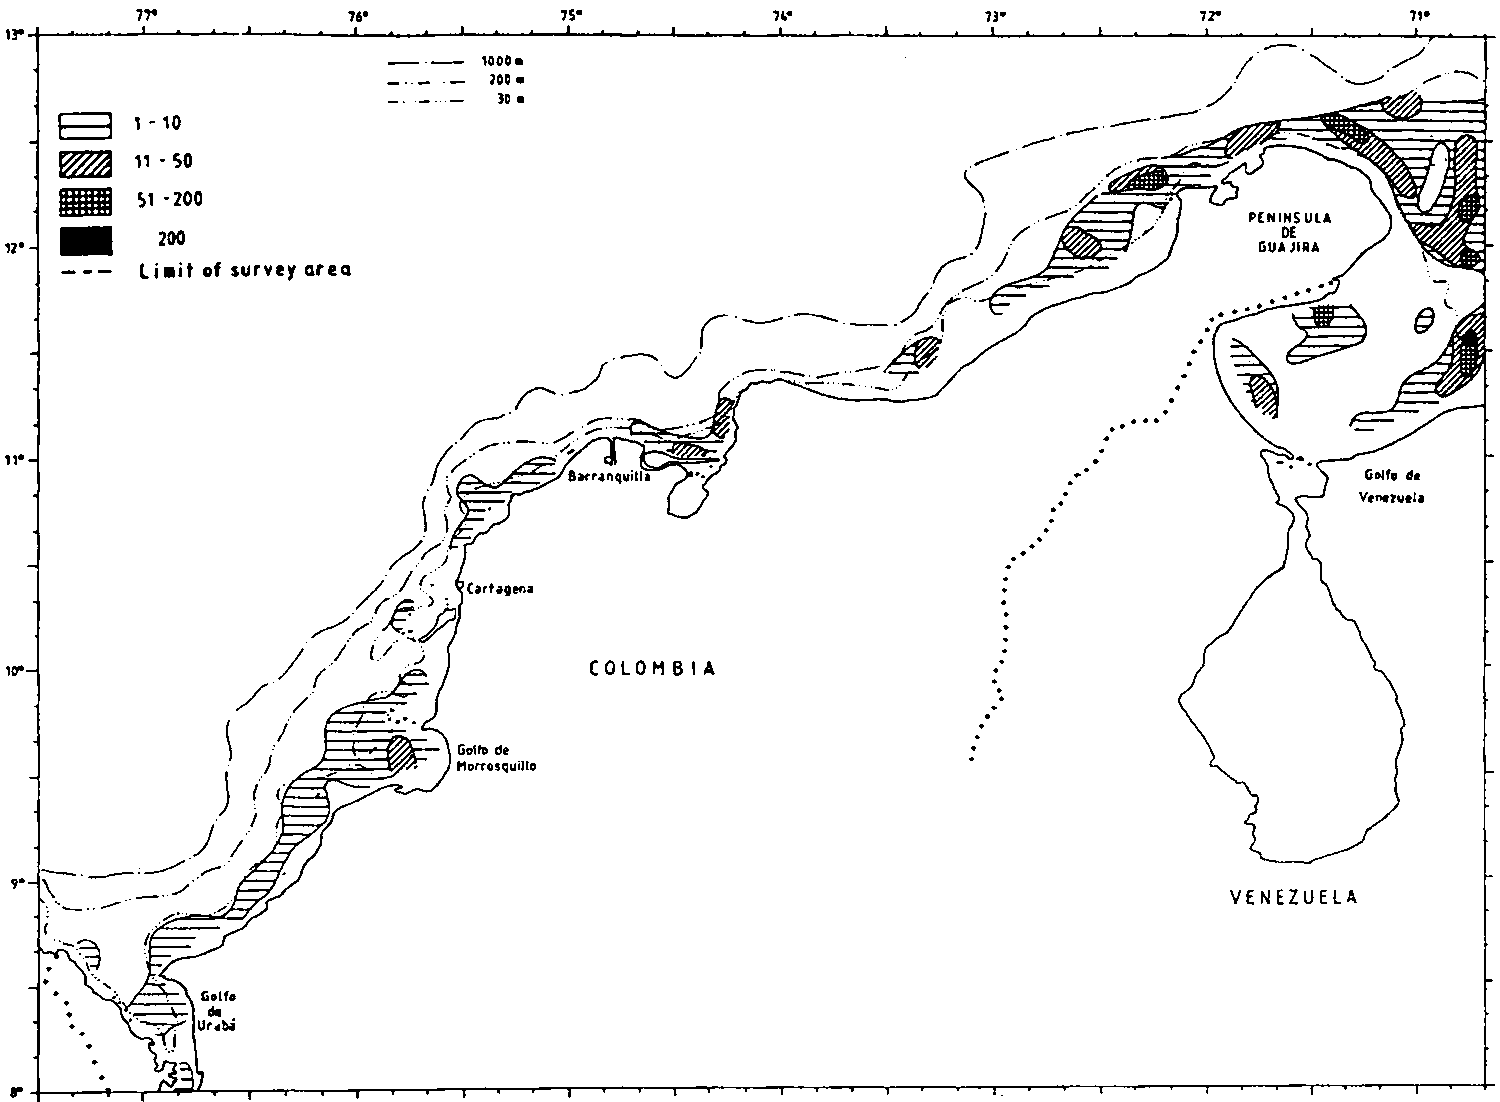
Figure 3.8.1. Course tracks and fishing stations, by surveys for Colombian waters (the map includes also part of Venezuelan waters).
Figure 3.8.2. Fish distribution as recorded by the acoustic system, by surveys for Colombian waters (the map includes also part of Venezuelan waters).
Biomass estimates
Table 3.8.3 shows the estimates of biomass for the two groups of pelagic fish based on the acoustic observations of density. The species composition for the clupeids indicate that the sardinella and the thread herring stocks may have different seasons of availability in the area. Assuming that this is the case we will propose to use the mean of surveys 1 and 2 to indicate the biomass of the sardinella and the mean of surveys 3 and 4 for the thread herring. This gives 60 000 tonnes and 40 000 tonnes respectively for the two stocks.
For the carangids we will use the mean of surveys 1 through 3 as the estimated available standing stock. The biomass estimates of the small pelagic fish can thus be summarized as follows:
|
Sardinella |
60 000 |
tonnes |
|
Thread herring |
40 000 |
tonnes |
|
Carangids |
14 000 |
tonnes |
|
Scombrids, barracudas |
4 000 |
tonnes |
|
Survey |
Pelagic 1 |
Pelagic 2 |
Total |
|
1 March |
80 000 |
7 000 |
90 000 |
|
2 June |
40 000 |
10 000 |
50 000 |
|
3 September |
60 000 |
30 000 |
90 000 |
|
4 December |
20 000 |
6 000 |
26 000 |
Demersal fish
The data for the analysis of the demersal resources east of Sta. Marta comprise 15, 20, 28 and 19 trawl hauls from the respective coverages. Below, only the highlights from the analysis with the main species or species groups are commented upon in the text. The complete results from the analysis are included in Annex 7 of the DATA FILES.
Catch composition
Table 3.8.4 shows the mean catch rates in kg/hour and the catch distribution by size classes for the main species of demersal fish.
The data have been analysed by two bottom depth strata, 0-50 m and 50-100 m, but no systematic difference in species composition is revealed. The main species are lane snapper L. synagris, vermillion snapper Rhomboplites aurorubens, mutton snapper L. analis, southern red snapper L. purpureus and tomtate grunt Haemulon aurolineatum. Trigger-fish Balistes capriscus is also frequent in the catches, but does not play any economic importance. The average catch rate by main species groups are shown in Table 3.8.5.
The snappers dominate with a rate of 64 kg/hour, followed by grunts 14 kg/hour. The groupers, croakers and seabreams have lesser importance with mean catchrates between 5 and 7 kg/hour. Other demersal species, mainly non-commercial sum to a catch rate of 51 kg/hour.
Table 3.8.4 Colombia east. Mean catch rates and catch distribution by size classes for all successful swept-area hauls carried out.
|
Species |
Mean rate |
Number of hauls in catch groups. |
Rate of occurrence* |
||||||
|
kg/hour |
1-30 kg |
30-100 kg |
0.1-03 t |
0.3-1 t |
1-3 t |
>3 t |
|||
|
INNER SHELF 0-50 m |
|
|
|
|
|
|
|
|
|
|
|
Lane snapper |
36 |
43 |
9 |
0 |
1 |
|
|
53/83 |
|
Triggerfish |
29 |
16 |
3 |
1 |
1 |
|
|
21/83 |
|
|
Mutton snapper |
9 |
25 |
15 |
1 |
|
|
|
41/83 |
|
|
OUTER SHELF 50-120 m |
|
|
|
||||||
|
|
Vermillion snapper |
21 |
46 |
8 |
3 |
|
|
|
59/83 |
|
Mutton snapper |
18 |
|
|
|
|
|
|
|
|
|
South red snapper |
17 |
27 |
2 |
1 |
1 |
|
|
31/83 |
|
|
Tomtate grunt |
13 |
28 |
4 |
3 |
|
|
|
35/83 |
|
|
Lane snapper |
11 |
|
|
|
|
|
|
|
|
* Calculated on basis of all hauls on shell.Table 3.8.5 Colombia east. Mean catch rates (kg/hour) in all hauls by main commercial groups.
|
Family |
INNER SHELF |
OUTER SHELF |
ALL SHELF |
|
0-50 m |
50-120 m |
0-120 m |
|
|
Snappers |
50 |
75 |
64 |
|
Groupers |
0 |
8 |
5 |
|
Croakers |
8 |
5 |
6 |
|
Grunts |
10 |
17 |
14 |
|
Seabreams |
6 |
8 |
7 |
|
Other demersal |
75 |
35 |
51 |
The area of the shelf east of Sta. Marta has been measured by planimeter to 540 nm2 between 0 and 50 m and 2 300 nm between 50 and 100 m bottom depth. By multiplying these areas with the estimated mean densities from the tables in Annex 7 of the DATA FILES, estimates of biomass by species or species groups are obtained. Such estimates are presented in Table 3.8.6.
As most of the demersal species are relatively longlived, the variation in biomass between surveys does not point to a variation in stock size, but more to migration across the area of analysis or to statistical errors due to high sampling variance. The increase of biomass of snappers in both depth strata in the fourth survey points to a migration from the mouth of the Gulf of Venezuela, as the increase of snappers in Colombia corresponds to a sudden decline of the species in the Gulf.
The December survey points to a peak in the resources, with a biomass of commercially important species at a level of 14 000 tonnes of which 11000 are snappers. With the data from all surveys pooled, the snappers are estimated to 6 800 tonnes, croakers abt. 600 tonnes, grunts abt. 1 500 tonnes, groupers 600 tonnes and seabreams 700 tonnes. This sums to around 10 000 tonnes of commercial demersal fish as the yearly average.
Table 3.8.6 Colombia east. Estimates of biomass of demersal fish by main groups and surveys.
|
|
Survey 1 |
Survey 2 |
Survey 3 |
Survey 4 |
All surveys |
|
INNER PART 0-50 m |
|||||
|
Snappers |
100 |
650 |
450 |
2 500 |
900 |
|
Croakers |
500 |
0 |
100 |
0 |
150 |
|
Grunts |
250 |
0 |
50 |
300 |
150 |
|
Groupers |
0 |
0 |
25 |
50 |
15 |
|
Seabreams |
0 |
100 |
250 |
100 |
100 |
|
Other demersal |
500 |
1 350 |
400 |
2 600* |
1 350 |
|
OUTER PART >50 m |
|||||
|
Snappers |
3 750 |
6 350 |
4 400 |
8 600 |
5 800 |
|
Croakers |
0 |
1 700 |
0 |
0 |
400 |
|
Grunts |
1 000 |
2 400 |
1 000 |
1 000 |
1 300 |
|
Groupers |
500 |
1 200 |
0 |
900 |
600 |
|
Seabreams |
400 |
900 |
500 |
750 |
600 |
|
Other demersal |
1 500 |
2 300 |
2 000 |
2 900 |
2 800 |
|
Total, main groups |
6 500 |
13 300 |
6 800 |
14 200 |
10 000 |
|
Total, other dem. |
2 000 |
3 700 |
2 500 |
5 500 |
4 200 |
* 50% Balistes capriscus
Squid
Table 3.8.7 summarizes the catch data for the shelf squids. The higher catch rates in the March survey most probably reflect a seasonal cycle in production and is similar to the variations found in the squid data from the Gulf. The species composition based on the proportion by weight in the total catches show about 60% Loligo pealei and 40% Loligo plei. The highest catch rates were obtained in March in the depth range 50-70 m at stations north-east and north of the Guajira Peninsula.
A swept area estimate for the March survey gives a standing biomass of approximately 5 000 tonnes.
Table 3.8.7 Colombia, Guajira Peninsula to Sta. Marta. Squid, Catch rates in kg/hour by main groups by surveys. Mean rate, three highest rates and rate of occurrence.
|
Survey |
Mean rate |
Highest rates |
Rate of occurrence |
||
|
|
|
|
|
||
|
1 March |
35 |
176, |
117, |
84 |
14/18 |
|
2 June |
2 |
14, |
10, |
9 |
11/27 |
|
3 September |
1 |
6, |
5, |
5 |
16/32 |
|
4 December |
3 |
31, |
8, |
7 |
17/25 |
Sharks were caught with mean rates in surveys ranging from 3 to 12 kg/hour and with highest catch rates of 115, 84 and 66 kg/hour. About 40% was smalltail shark Carcharhinus porosus, 20% scalloped hammerhead Sphyrna lewini and 17% Mustelus spp.
Deep sea shrimp
A few hauls were made at 300 to 500 m depth to test the presence of shrimps. Giant red shrimp Aristaemorpha folicea and royal red shrimp Pleoticus robustus were among the shrimp species which occurred in modest amounts in the catches up to about 2 kg/hour. These data do not add any information to that provided by the very extensive surveys made jointly with the Agency for International Cooperacion of Japan in 1980. (Anon. 1981)
![]()
![]()
![]()