ABOUT THE GSOCseq
The first ever country-driven Global Soil Organic Carbon Sequestration Potential Maps (GSOCseq) V1.0.0 have just been relesed!
These maps allow for the estimation of topsoil (0-30 cm) soil organic carbon sequestration potential in agricultural areas under four soil management scenarios: a Business as Usual (BAU) scenario and three Sustainable Soil Management (SSM1, SSM2 and SSM3) scenarios***.
The untapped potential of sequestering Soil Organic Carbon (SOC) in agriculturally managed soils as one of the most cost-effective nature-based solutions for climate change mitigation and adaptation has been widely described in recent years. However, unlocking this potential relies on the establishment of strong mechanisms to monitor, report and verify (MRV) changes in SOC stocks.
***The SSM practices considered in this approach are directly translated into three levels of C input to the soil. The C input of the SSM scenarios was estimated as a percentual increase over the BAU C input. The use of pre-defined percentages in C input increase allowed the global application of the RothC model. C input increases over the BAU scenario were set at:
* Low (SSM1): 5 percent increase in C input
* Medium (SSM2): 10 percent increase C input
* High (SSM3): 20 percent increase in C input
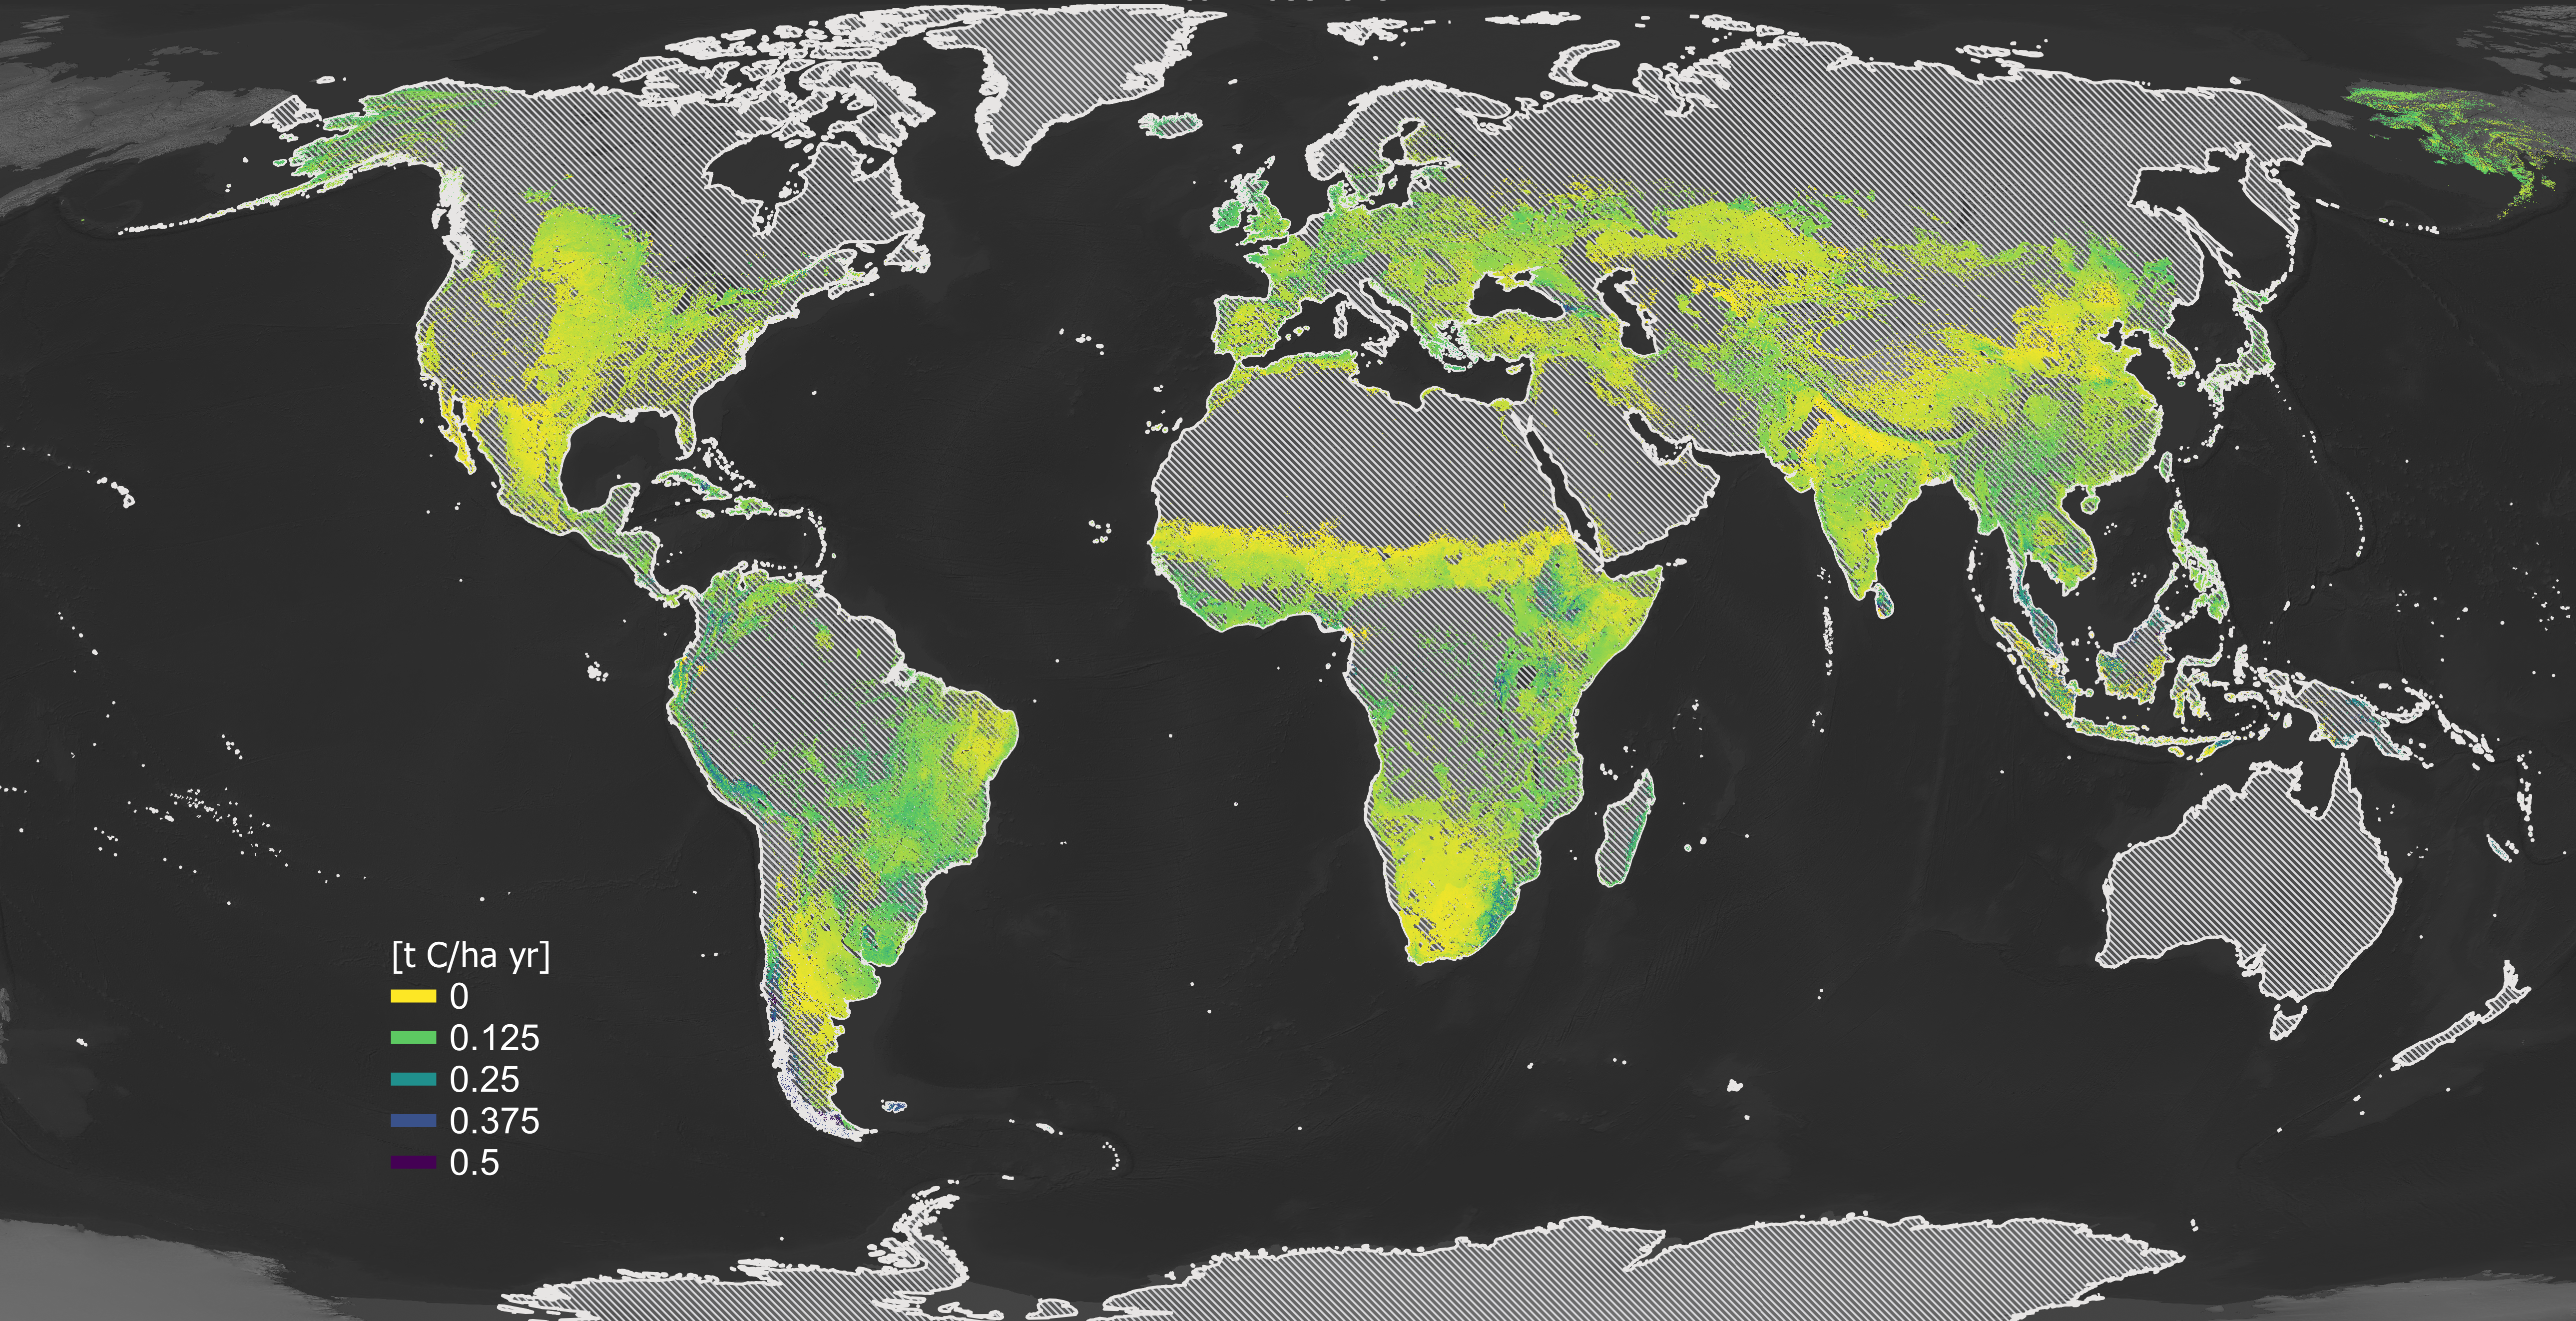
RELATIVE SEQUESTRATION POTENTIAL
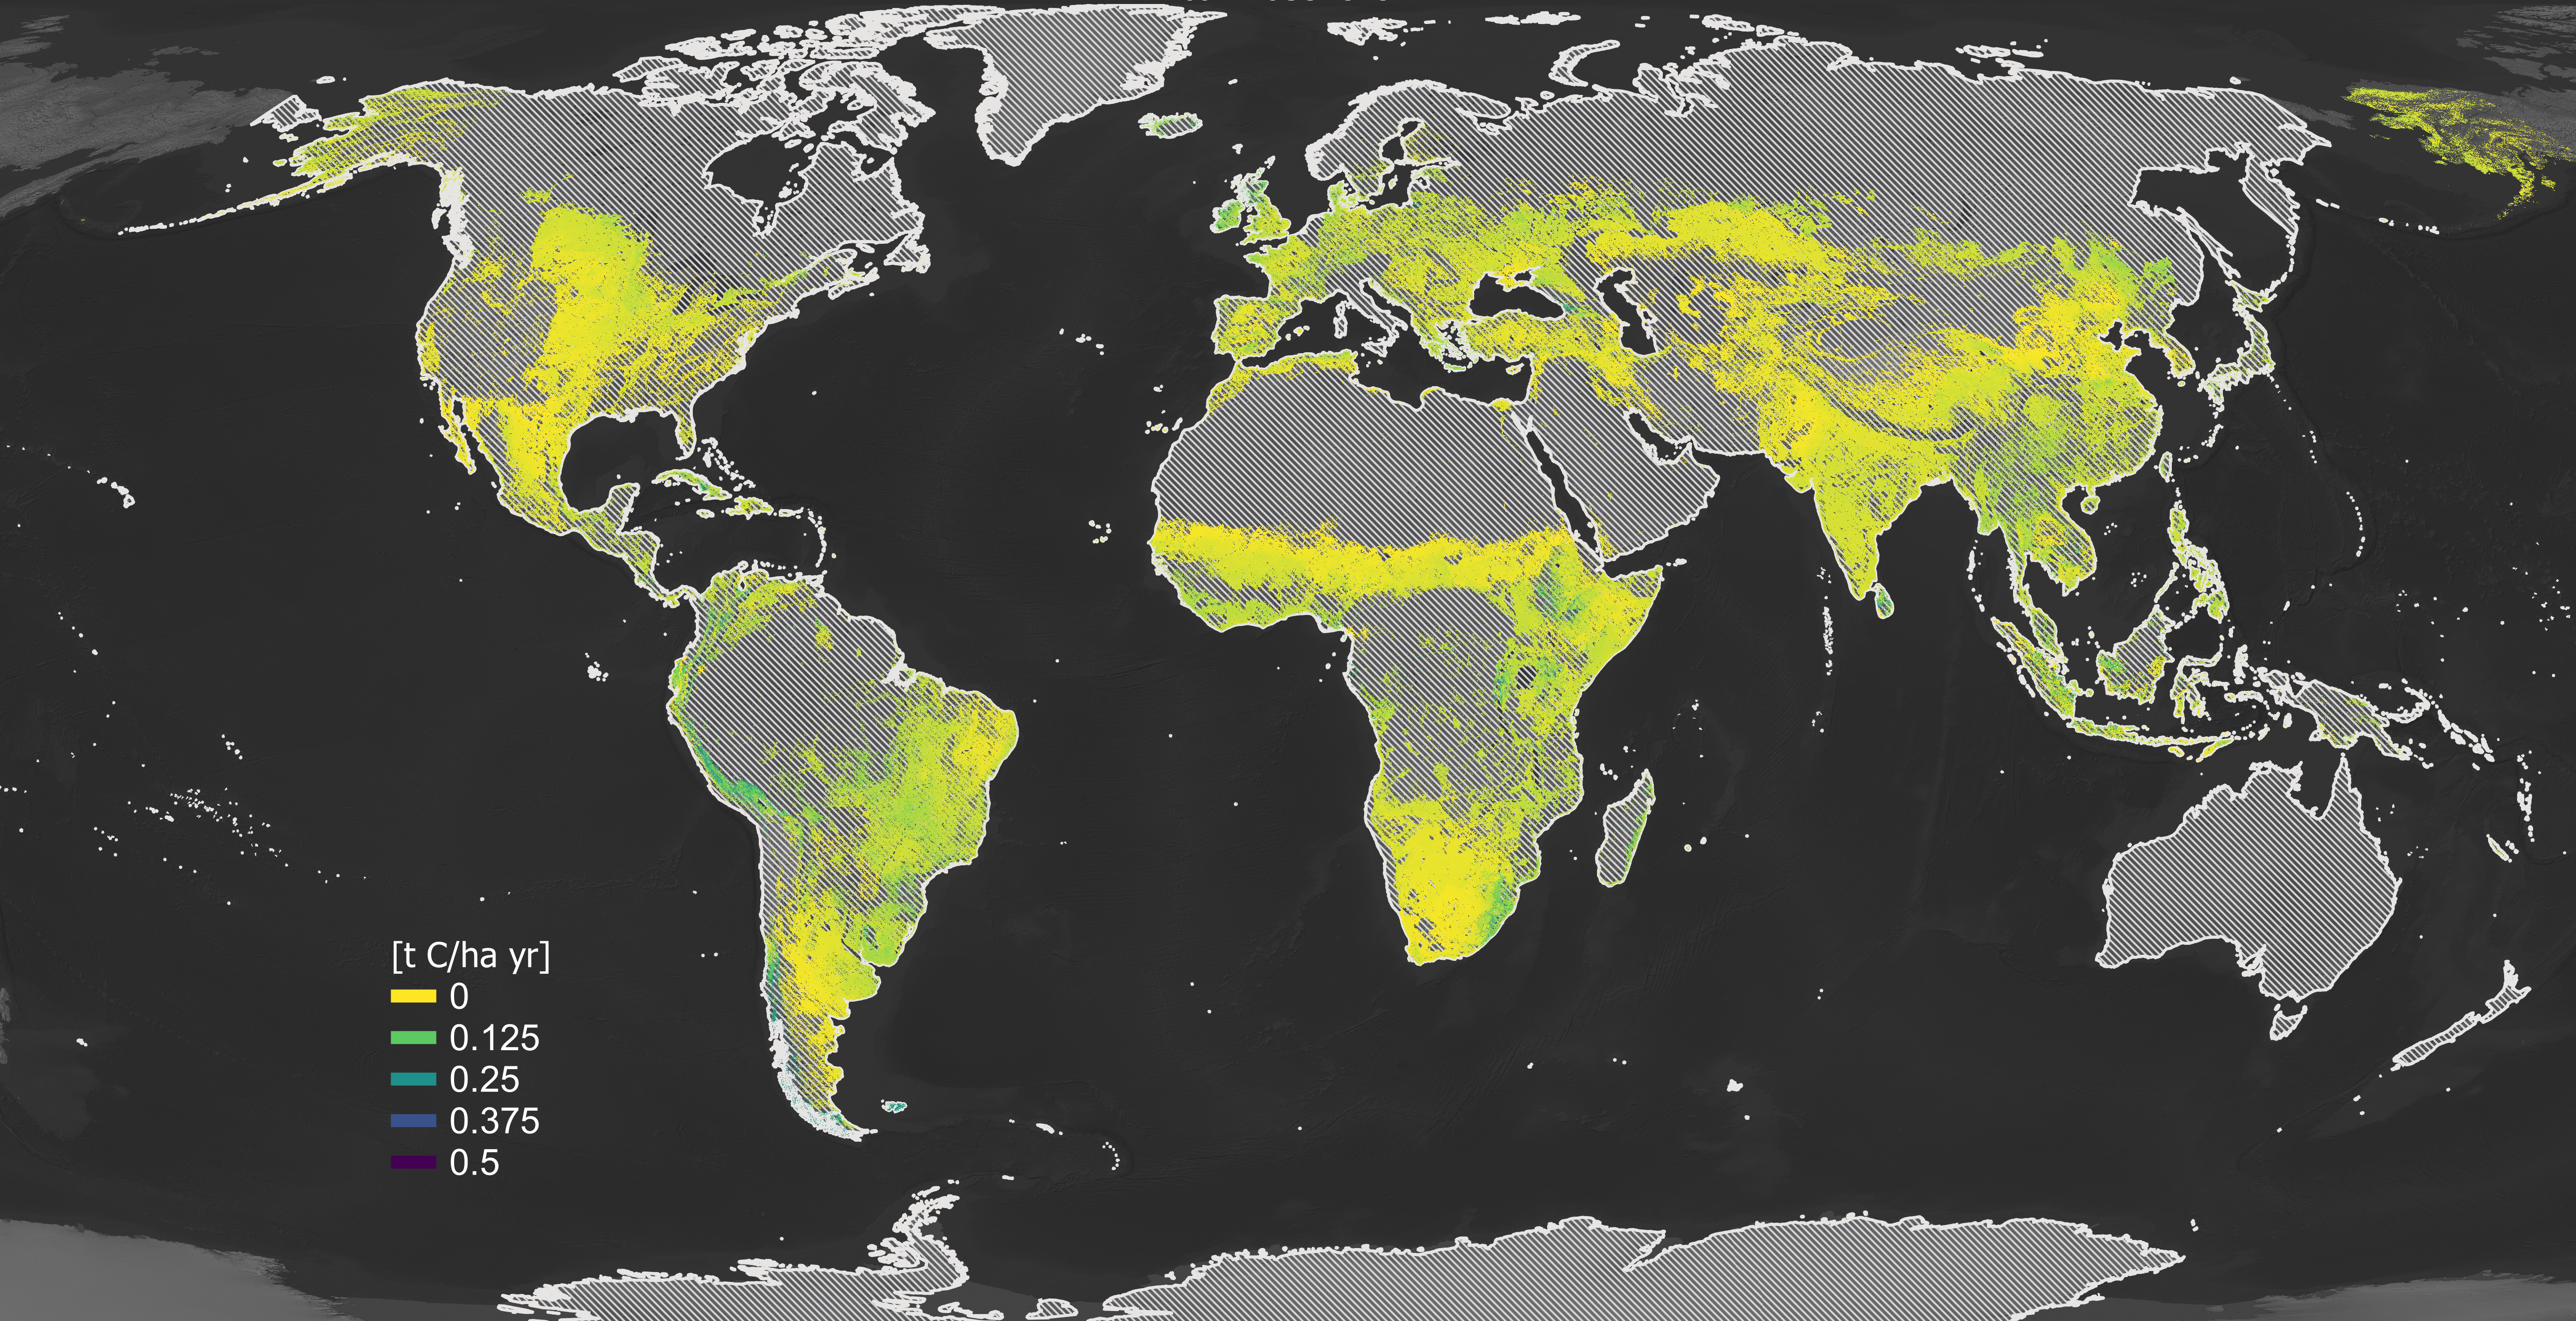
Global Soil Organic Carbon Sequestration Potential Map
- GSOCseq V1.0.0 -
Relative Sequestration Rates under a 10% C input increase - SSM1 Scenario -
EXPLORE | DOWNLOAD
Global Soil Organic Carbon Sequestration Potential Map
- GSOCseq V1.0.0 -
Relative Sequestration Rates under a 10% C input increase - SSM1 Scenario -
EXPLORE | DOWNLOAD
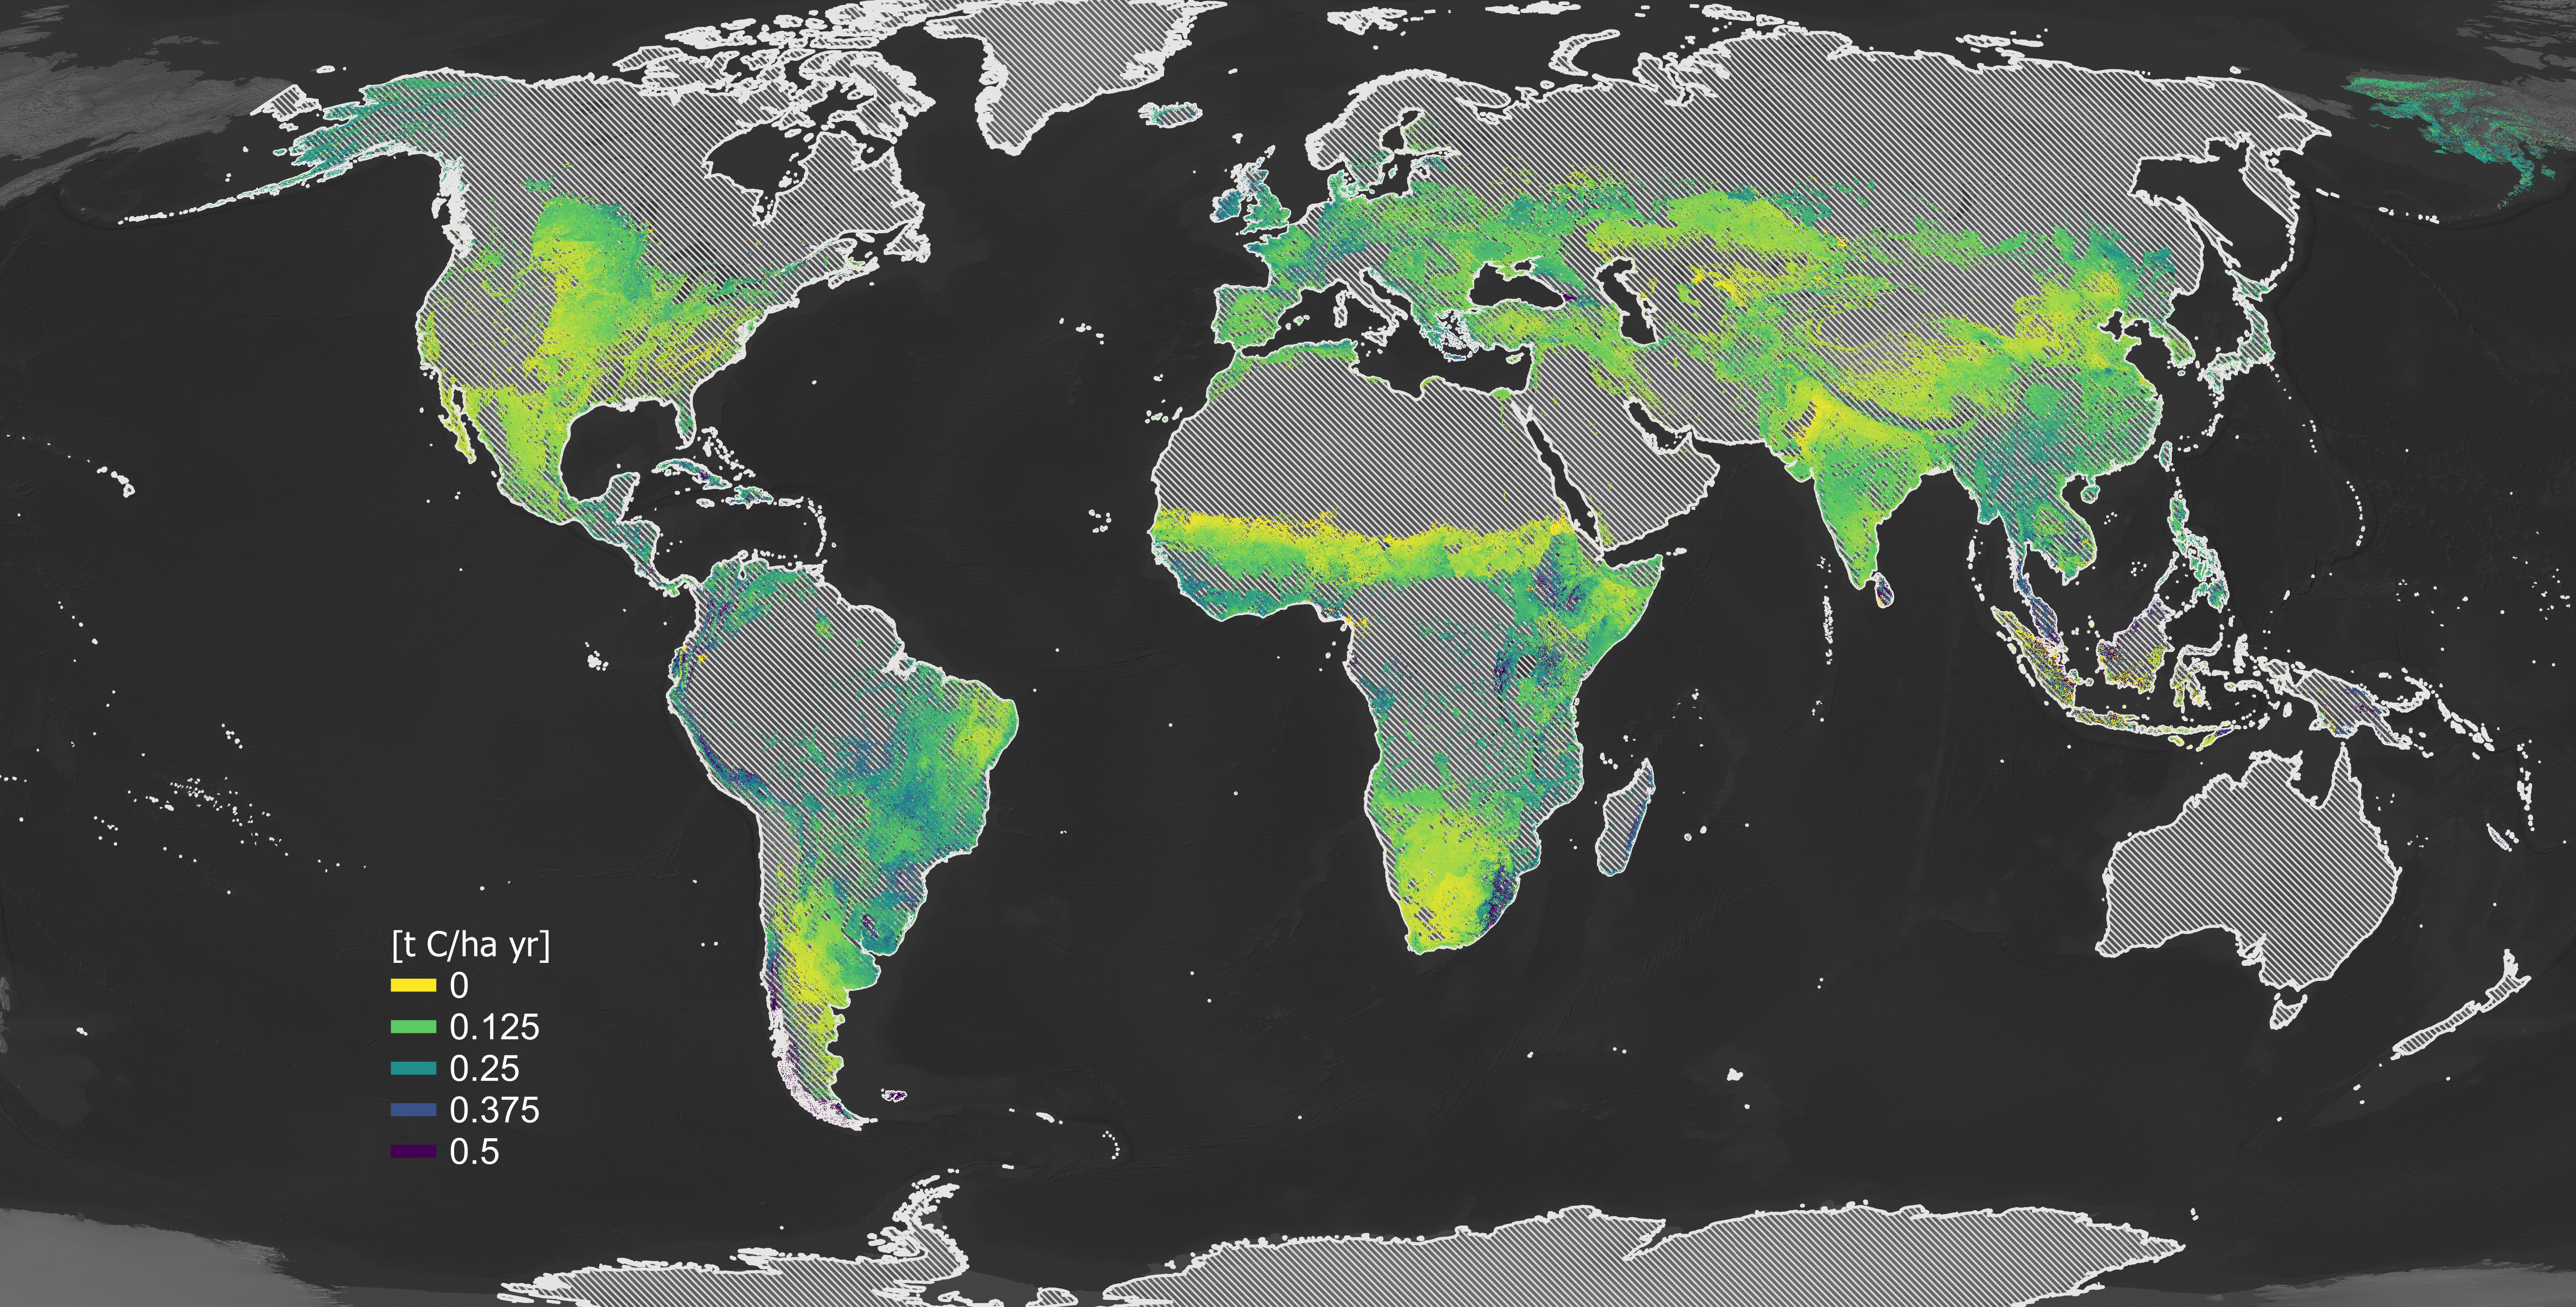
Global Soil Organic Carbon Sequestration Potential Map
- GSOCseq V1.0.0 -
Relative Sequestration Rates under a 10% C input increase - SSM3 Scenario -
EXPLORE | DOWNLOAD
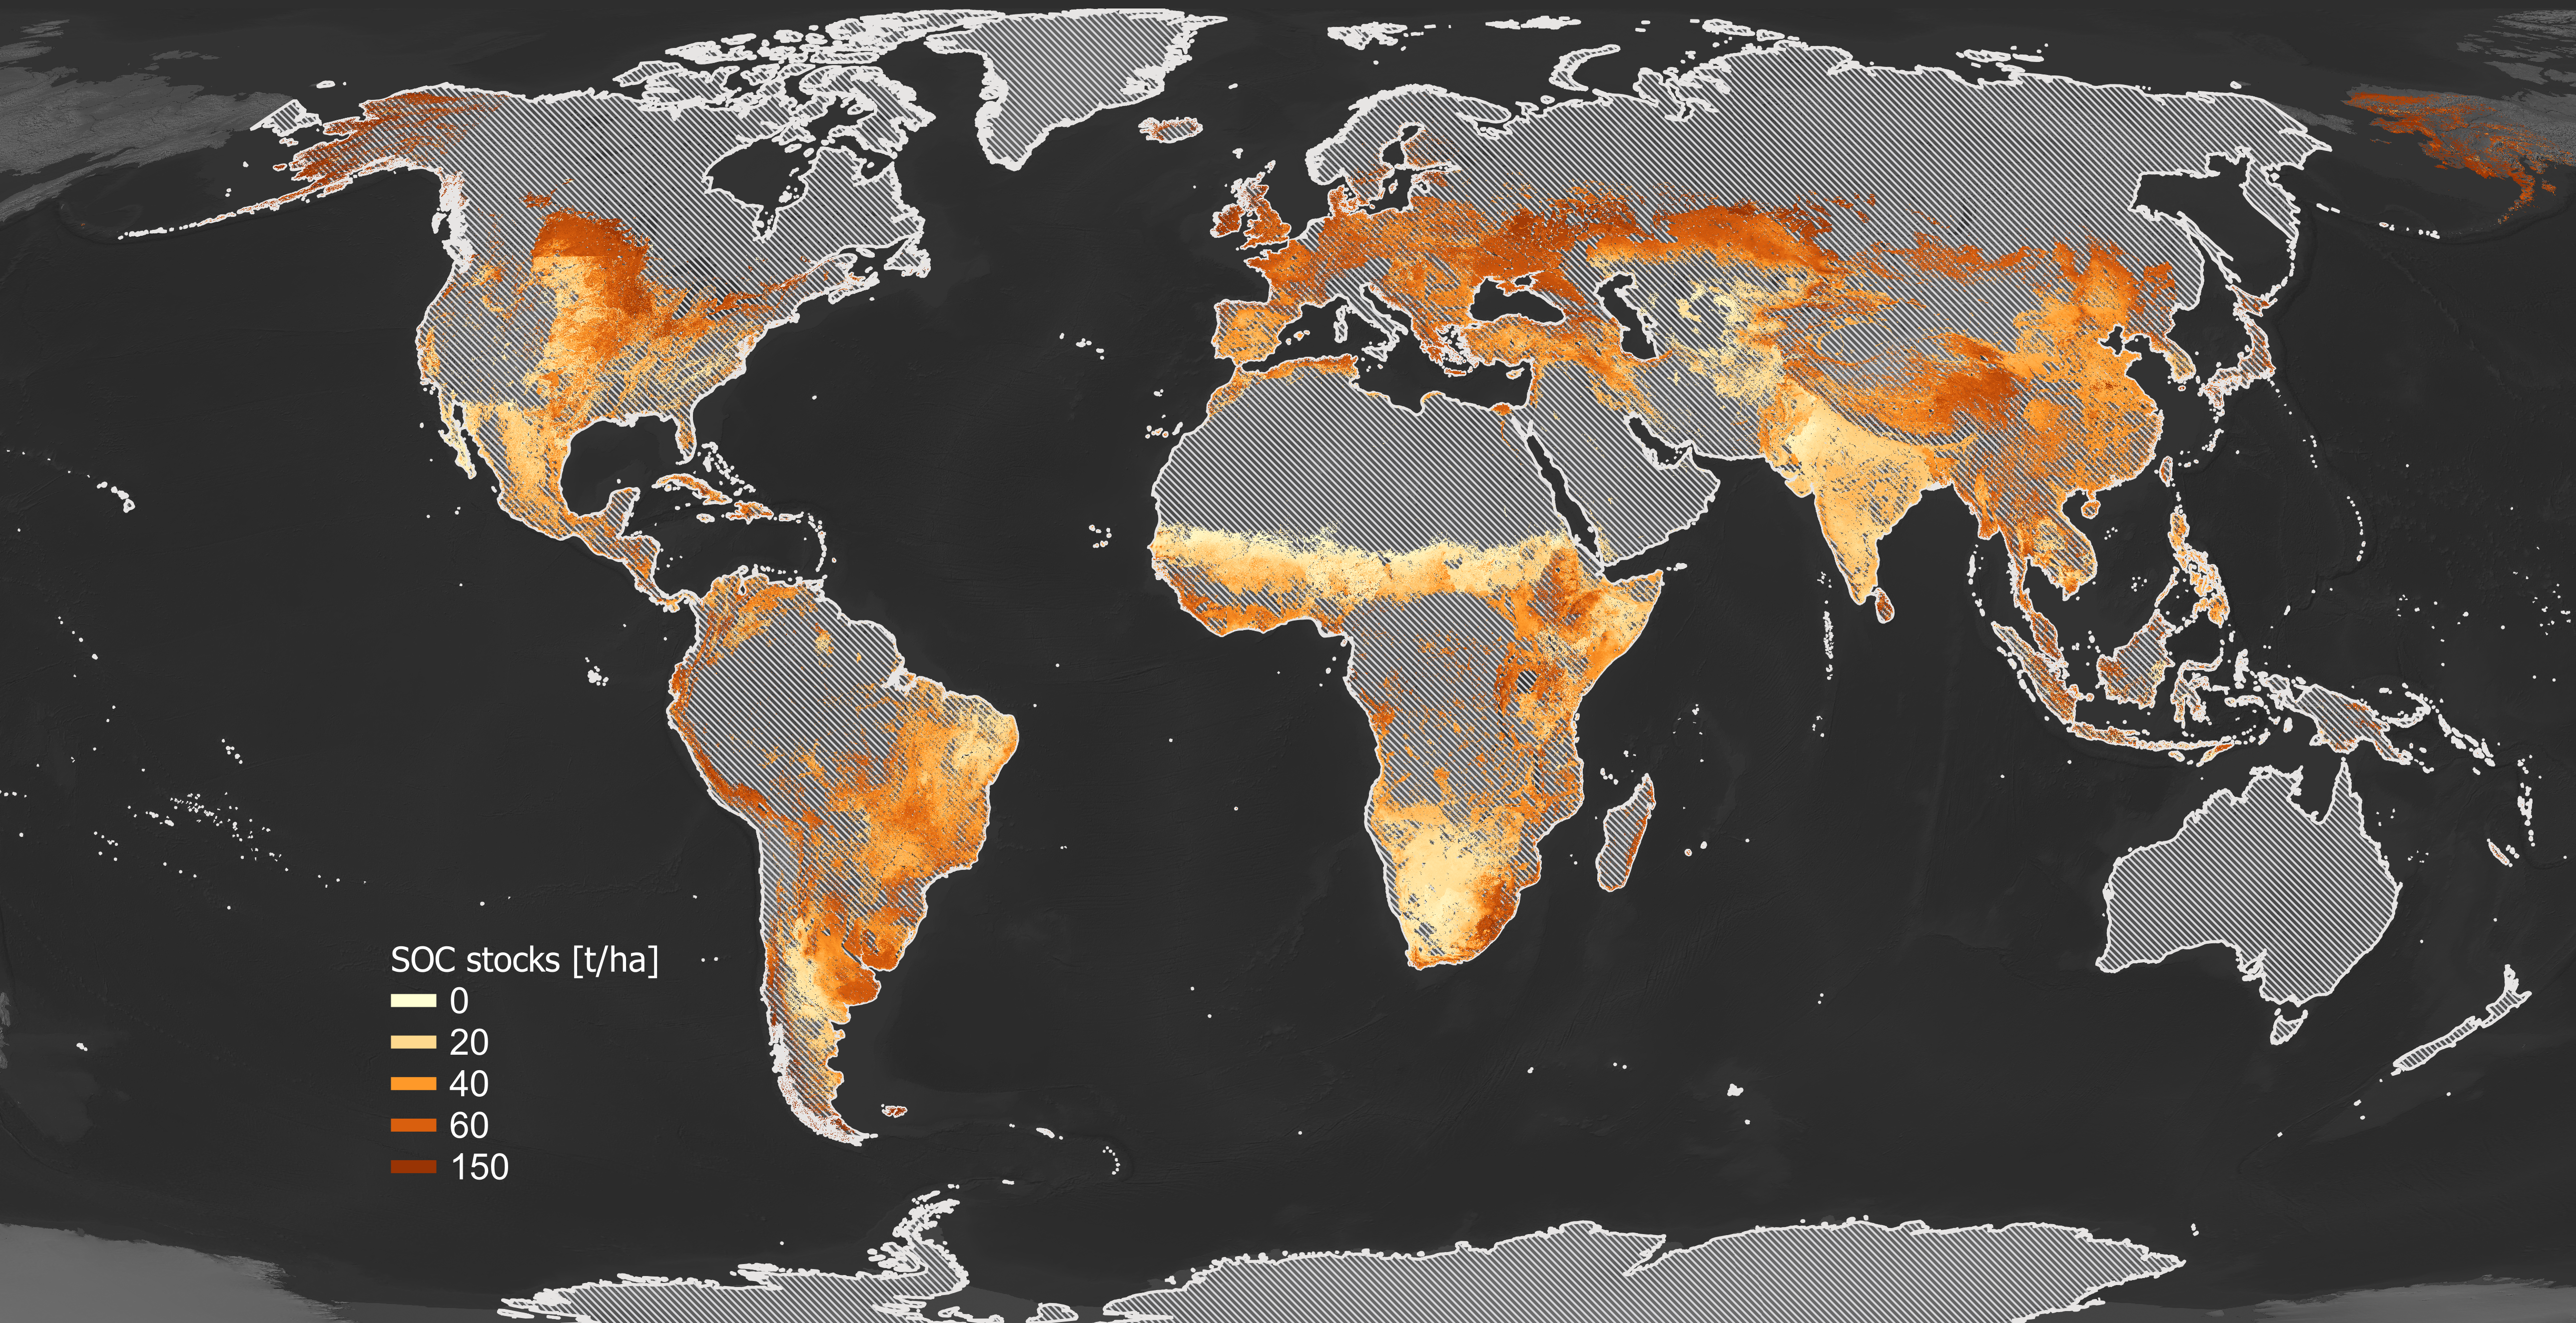
RELATIVE SOC STOCKS

Global Soil Organic Carbon Sequestration Potential Map
- GSOCseq V1.0.0 -
Relative Sequestration Rates under a 10% C input increase - SSM1 Scenario -
EXPLORE | DOWNLOAD

Global Soil Organic Carbon Sequestration Potential Map
- GSOCseq V1.0.0 -
Relative Sequestration Rates under a 10% C input increase - SSM1 Scenario -
EXPLORE | DOWNLOAD

Global Soil Organic Carbon Sequestration Potential Map
- GSOCseq V1.0.0 -
Relative Sequestration Rates under a 10% C input increase - SSM3 Scenario -
EXPLORE | DOWNLOAD
Global Soil Organic Carbon Sequestration Potential Map
- GSOCseq V1.0.0 -
Relative Sequestration Rates under a 10% C input increase - SSM3 Scenario -
EXPLORE | DOWNLOAD

Global Soil Organic Carbon Sequestration Potential Map
- GSOCseq V1.0.0 -
Relative Sequestration Rates under a 10% C input increase - SSM3 Scenario -
EXPLORE | DOWNLOAD
UNCERTAINTIES

Global Soil Organic Carbon Sequestration Potential Map
- GSOCseq V1.0.0 -
Relative Sequestration Rates under a 10% C input increase - SSM1 Scenario -
EXPLORE | DOWNLOAD