Carbon footprint of the banana supply chain

The term “carbon footprint” is used to describe the quantity of greenhouse gases generated by an item or activity. It is expressed in carbon dioxide equivalent (amount of carbon dioxide that would have the same impact on climate change) and has been widely used over the past decade for environmental assessment.
The calculation of a carbon footprint of a product is the sum of all materials, energy and waste across all lifecycle activities thereof, multiplied by emission factors and global warming potentials (GWPs). The carbon footprint of the banana industry is spread across the entire value chain, which can be divided into three broad steps: production and packing, transport and shipping, and ripening (for exported bananas). However only 15%–20% of world banana production is traded globally (the biggest banana producing countries such as India or Brazil export very little and keep most for domestic consumption).
ISO 14064 standard on quantification of emissions and removals of greenhouse gases represents a fundamental instrument for the estimation of carbon footprint in banana companies. ISO standards 14040 and 14044 on Life Cycle Assessment (LCA) and PAS 2050 Carbon Footprint Verification (published by the British Standards Institution) provide a recognized framework for carbon footprint and lifecycle analysis.
However, the results can vary considerably depending on the chosen methodology, scope and boundaries, and because every study needs to be adjusted to local conditions and emission factors. For example, some carbon footprint studies take into account the steps of land use change and consumer transport and wastage in the calculation scope. Within the evolving field of carbon footprint, calculation methodologies are multiple and still under construction to fit with growing expectations.
Despite bananas being an important product, only few carbon footprint analysis have been published, and the results have varied depending on the methodology and data: from 324g to 1 124kg CO2e/kg of bananas.
Although they defined different boundaries, banana carbon footprint studies have identified maritime transport (including refrigerants) as the main contributor to the banana supply chain carbon footprint, followed by the manufacture and use of fertilizers and the manufacture and preparation of carton boxes in packing stations.
Activities contributing to the banana industry carbon footprint
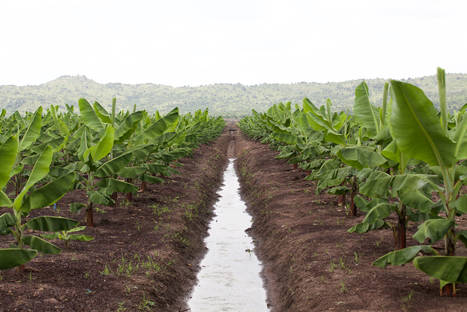
Farm production

In the primary production stage banana farming doesn’t produce a large contribution to GHG emissions. In studies analyzing GHG emissions “from cradle to retail”, primary production contributed between 16% and 20% of the total amount of GHG emissions. Carbon sources on banana farms include:
- Fabrication and acquisition of material: energy indirectly used for the production and transport of plant materials, plastics and tools used to build and maintain the farm, prepare the fields and for transport on the farm itself.
- Fabrication and use of plastics
- Use of chemical fertilizers, especially nitrogen and potassium in monoculture production.
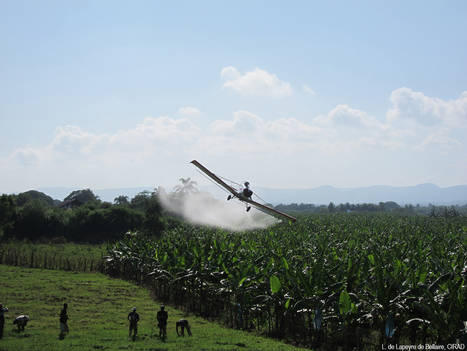
- Use of chemical pesticides.
- Harvesting: machine-harvested crops have a higher carbon footprint.
- Packing: energy used for the manufacture and preparation (including fumigation with fungicides) of carton boxes in packing stations. Dole reported 8% of the total carbon footprint for this stage, amongst which the production of the carton boxes is the most important factor.
Use of fertilizers
The production and use of inorganic fertilizers, especially those containing nitrogen, is the second most important source of greenhouse gas emissions in the banana supply chain after sea transport. Different cases of carbon footprint evaluation in the banana sector have calculated that from the total greenhouse gases generated on the farm, between 24% and 49% correspond to emissions from fertilizers based on nitrogen.
Practices reducing the impact of inorganic fertilizers:
|
|
|
|
|
|
|
|
|
|
|
|
|
|
|
|
Transport and shipping

Transport and shipping produces the vast majority of GHG emissions in the exported banana value chain, mainly associated with energy use, such as fuel consumption, electricity and conditioning, with maritime transportation making the largest contribution. Distribution logistics within the country of destination represents close to 12% of the total carbon footprint, while the total contribution from all transport and storage was estimated between 62% and 67%.
Road transport
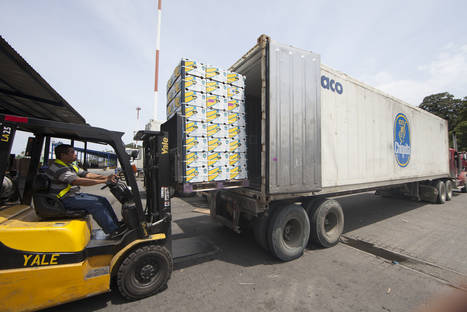
From plantations to harbour in the producing country, from harbour to ripening centres and distribution points in the destination country – consumes fuel and generates GHG.
Maritime transport
Cargo ships transporting bananas generate important GHG emissions, especially if using low-cost and low-quality fuel. Different producing and trading companies reported that maritime transport represented around half of their total CO2 emissions, which explains why export bananas have a more important carbon footprint.
Refrigeration
Refrigerated cargo ships in particular use a lot of energy and refrigerants (ethylene), which generates more GHG.
Contribution from land transport
Reduction of fuel consumption is the key element in reducing GHG emissions during land transport. It is estimated that for every 100 gallons of diesel consumed, approximately one tonne of greenhouse gas is generated, going directly into the atmosphere.
Possible measures to be adopted include:
- Establishment of programs to reduce gas, energy and water consumption;
- Idle reduction
- Improved aerodynamics
- Improved freight logistics and performances (collaborative transportation initiatives)
- Automatic tire-inflation systems
- Wide-based (and single-wide) tires
- Low viscosity lubricants
- Weight reduction
- Hybrid vehicle technologies and alternative fuels
- Driver training
- Intermodal transport (road plus rail)
- Improved cold-logistic management
- Use of compressed natural gas (CNG) tractors in port haulage
- Use of liquefied natural gas (LNG) tractors for heavy loads and mountainous routes
- Evaluation of “only natural gas” equipment, as the network of CNG and LNG improves
- Use of re-refined oils and retread tires that require less energy and emit less greenhouse gases in the production processes
- Speed reduction to 100 km/h (62 mph), resulting in a significant increase in miles per gallon
- Environmental self-inspections conducted annually.
Contribution from maritime transport
Refrigerated containers are 20- or 40-foot long containers equipped with a refrigeration used for transporting bananas. They offer a reduction in the carbon footprint of banana transportation of 33%–42% over using reefers, although they still represent a significant contributor to GHG emissions from the banana sector.
Since the introduction of refrigerated containers, GHG emissions have been reduced thanks to:
- The improvement of their design and the switch to refrigerants with lower emissions
- A software that controls the container’s refrigeration system by turning it off or on based on the temperature settings of what is being transported. Instead of maintaining the temperature in the container at a set level, which uses a lot of energy, the system focuses on the temperature of the product. By decreasing refrigeration energy requirements by up to 50%, it reduces GHG emissions related to electricity production.
- Enhancement of engine efficiency
- Reduction of transportation distance by developing alternative sources of production
- Replacing older containers
- Elimination of the refrigerant Freon R12, replacing it with R134a
- Replacing the R141b blowing agent with lower-emissions agents
- Implementation of improved monitoring and control equipment.
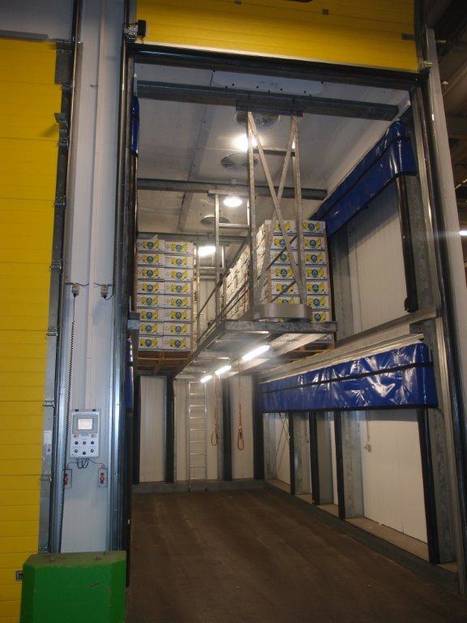
Ripening

Ripening centres and retail distribution represent approximately 10% of total emissions of greenhouse gases in the banana value chain, from which 75% correspond to energy consumption, 22% to distribution centres and 1% to ethylene production. |
Ripening is a complex process with several factors to take into account:
- Ethylene, a hydrocarbon, is used to ripen bananas once they reach their destinations.
- Ripening also requires a constant temperature which requires power to maintain.
- Temperature must be kept constant. A temperature lower than 13°C or higher than 18°C can damage the appearance of the fruit.
- Air circulation must be constant.
- When ethylene gas is used, levels must be kept constant.
In order to reduce greenhouse gas emissions in their ripening centres, companies have implemented practices to halve their energy consumption through the following actions:
- Use of natural refrigerant (ammonia and water)
- Energy efficient illumination
- Patented reversed air technology
- Recovery of heat generated by bananas during ripening for heating warehouse and offices
- Optimal use of daylight through roof tunnels on the top of the building
- Use of electric cars and scooters for low-emissions mobility.
References
References
FAO. 2014. Agriculture’s green house gas emissions on the rise
FAO. 2014. Agriculture, forestry and other land use emissions by sources and removals by sinks 1990-2011 Analysis
Chapter 9: Calberto G., Staver C., Siles P. 2015. An assessment of global banana production and suitability under climate change scenarios (in Elbehri A. 2015. Climate Change and Food Systems. Global assessments and implications for food security and trade)
Chapter 9: Calberto G., Staver C., Siles P. 2015. An assessment of global banana production and suitability under climate change scenarios (in Elbehri A. 2015. Climate Change and Food Systems. Global assessments and implications for food security and trade)
Government of India. 2015. India’s Intended Nationally Determined Contribution
Republic of the Philippines. 2015. Intended Nationally Determined Contributions Communicated to the UNFCCC on October 2015
UNFCCC. 2014. UNFCCC Country Brief 2014: Philippines
Office of the President of the Philippines. 2014. Executive order n.174 Institutionalizing the Philippine Greenhouse Gas Inventory Management and Reporting System
Federative Republic of Brazil. 2015. Intended Nationally Determined Contribution
Elbehri A., Staver, C., Hospido A., Skully, D. 2015 Cambio Climático y Sostenibilidad del Banano en el Ecuador. Evaluación de Impacto y Directrices de Política
Government of Costa Rica. Minsitry of Environment and Energy. 2015. Costa Rica’s intended nationally determined contribution
Republic of Peru. 2015. Intended Nationally Determined Contribution from the Republic of Peru
Svanes, E., Aronsson A.K.S., 2013. Carbon footprint of a Cavendish banana supply chain
Lescot T., 2012. Carbon Footprint Analysis in Banana Production
Elbehri A., Staver, C., Hospido A., Skully, D. 2015 Cambio Climático y Sostenibilidad del Banano en el Ecuador. Evaluación de Impacto y Directrices de Política
Roibás L., Elbehri A., Hospido A. 2014. Carbon footprint along the Ecuadorian banana supply chain: Methodological improvements and calculation tool
Roibás L., Elbehri A., Hospido A. 2014. Carbon footprint along the Ecuadorian banana supply chain: Methodological improvements and calculation tool
Iriarte A., Almeida M.G., Villalobos P., 2014. Carbon footprint of premium quality export bananas: Case study in Ecuador, the world's largest exporter
FAO. 2014. Agriculture, forestry and other land use emissions by sources and removals by sinks 1990-2011 Analysis
Liu, Z., Dong, X.,Liu, Z. 2014. Carbon Storage and Carbon Dioxide Sequestration of Banana Plants at Different Growth Stages
Lasco, R., Lales, J., Arnuevo, M., Guillermo, I., De Jesus, A.C., Reinero Medrano, Bajar, O., Mendoza, C.V. 2000. Carbon Dioxide Storage and Sequestration in the Leyte Geothermal Reservation, Philippines
Guimarães, D.V., Gonzaga, M.I.S., Melo Neto, J de O., 2014. Management of soil organic matter and carbon storage in tropical fruit crops
Zemek, O.L. 2009. Biomass and Carbon Stocks Inventory of Perennial Vegetation in the Chieng Khoi Watershed, NW Viet Nam
FAO Global Alliance for Climate-Smart Agriculture. What is CSA?

