AQUASTAT - FAO's Global Information System on Water and Agriculture
Printable Maps
While global thematic layers are dynamically accessible and downloadable through the AQUAMAPS geospatial database, at users' requests static maps have been also prepared in PDF format, ready to be printed and used for presentations and publications.
Please note that the designations employed on the maps do not imply the expression of any opinion whatsoever or official endorsement or acceptance on the part of the FAO concerning the legal status of any country, territory, city or area or of its authorities, or concerning the delimitation of its frontiers or boundaries.
Beyond the global and regional maps listed below, detailed country layouts displaying the main features of water resources and agricultural water management are also available for download and accessible through the country list of the Country profiles section.
The maps are based on the data that were available in the AQUASTAT databases at the time of preparation. Therefore, for some countries, the information displayed might be out-of-date. For more recent data and time series please refer to the Country Statistics.
Global maps
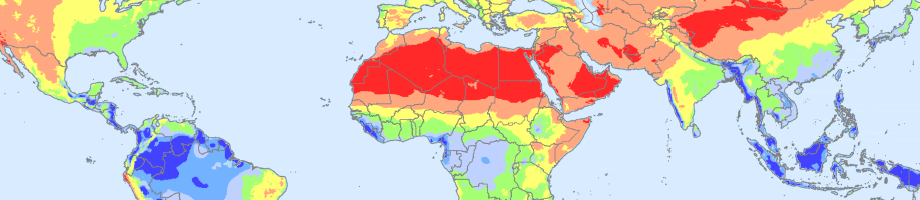
- Long-term average annual precipitation
- Contribution of transboundary water to the total renewable water resources
- Total renewable water resources per inhabitant
- Proportion of water resources withdrawn: Pressure on water resources
- Proportion of total water withdrawal withdrawn for agriculture
- Proportion of renewable water resources withdrawn for agriculture
- Water withdrawal per inhabitant
- Area equipped for irrigation
-
Part of cultivated area under irrigation
Regional maps from recent updates
The following thematic maps were prepared as part of the updates of the regional overviews reports carried out from 2005 to 2015. More information on the regional reports on the Regional overviews section of this portal.
Southern and Central America and the Caribbean - 2015
- Figure 1: Average annual precipitation
- Figure 2: Population density
- Figure 3: Internal renewable water resources
- Figure 4: Total renewable water resources per inhabitant )
- Figure 5: Annual water withdrawal per inhabitant
- Figure 6: Millennium Development Goal Water Indicator 7.5
- Figure 7: Area equipped for irrigation
- Figure 8: Area equipped for irrigation as percentage of country area
- Figure 9: Area equipped for irrigation as percentage of cultivated area
Southern and Eastern Asia - 2012
- Figure 4: Regional division of Southern and Eastern Asia
- Figure 5: Average annual precipitation
- Figure 6: Population density
- Figure 7: Internal renewable water resources
- Figure 8: Total renewable water resources per inhabitant
- Figure 9: Transboundary river basins
- Figure 10: Annual water withdrawal per inhabitant
- Figure 11: Millennium Development Goal Water Indicator
- Figure 12: Area equipped for irrigation
- Figure 13: Area equipped for irrigation as percentage of country area
- Figure 14: Area equipped for irrigation as percentage of cultivated area
Middle East - 2008
- Figure 8: Regional division of the Middle East
- Figure 9: Average annual rainfall
- Figure 10: Population density
- Figure 11: Internal renewable water resources
- Figure 12: Total renewable water resources per inhabitant
- Figure 13: Transboundary river basins
- Figure 14: Endoreic basins
- Figure 15: Non-renewable groundwater aquifers
- Figure 16: Non-conventional sources of water as % of total withdrawal
- Figure 17: Annual water withdrawal per inhabitant
- Figure 18: Millennium Development Goal: Water Indicator
- Figure 19: Area equipped for irrigation
- Figure 20: Area equipped for irrigation as percentage of country area
-
Figure 21: Area equipped for irrigation as percentage of cultivated area
Regional maps in PNG format
- Hydrological basins of Africa
- Rivers of Africa
- Hydrological basins of Northern America
- Hydrological basins of Central America
- Hydrological basins of Southern America
- Rivers of Northern America
- Rivers of Central America
- Rivers of Southern America
- Hydrological basins of Near East and Central Asia
- Hydrological basins of Southern and Eastern Asia
- Rivers of Near East and Central Asia
- Rivers of Southern and Eastern Asia
- Hydrological basins of Europe
- Rivers of Europe
- Hydrological basins of Australia and New Zealand
- Rivers of Australia and New Zealand


