Google Earth Engine
Google Earth Engine is accessed through any web browser on any type of computer
More than 40 years of remote sensing imagery is available in Google Earth Engine (GEE) with 4,000 new images being uploaded every day. This means that users no longer need to visit numerous websites to find imagery; instead, it is all in one place with a simple interface that allows display and analysis of remote sensing imagery. It used to take several days or longer to process complex imagery. Now it takes only a few minutes because GEE uses 1000s of computers at the same time in the cloud. No custom software or licenses are required. Access is free.
More than 40 years of remote sensing imagery is available in Google Earth Engine (GEE) with 4,000 new images being uploaded every day. This means that users no longer need to visit numerous websites to find imagery; instead, it is all in one place with a simple interface that allows display and analysis of remote sensing imagery. It used to take several days or longer to process complex imagery. Now it takes only a few minutes because GEE uses 1000s of computers at the same time in the cloud. No custom software or licenses are required. Access is free.

Google Earth Engine code editor - display and analysis of imagery
GEE has revolutionised access to remote sensing and analysis. All of the tools for analysing imagery are available through a web browser in Code Editor that uses Java script. A typical analysis normally consists of six components: (1) get an image, (2) apply an algorithm, (3) filter a collection according to date and location, (4) map the algorithm over a collection, (5) reduce a collection to one image, and (6) compute aggregate statistics. This process and interface will be simplified for Desert Locust users.
GEE has revolutionised access to remote sensing and analysis. All of the tools for analysing imagery are available through a web browser in Code Editor that uses Java script. A typical analysis normally consists of six components: (1) get an image, (2) apply an algorithm, (3) filter a collection according to date and location, (4) map the algorithm over a collection, (5) reduce a collection to one image, and (6) compute aggregate statistics. This process and interface will be simplified for Desert Locust users.

Dynamic greenness maps in Google Earth Engine
Here is an example of a dynamic greenness map covering the entire Desert Locust recession area displayed in Google Earth Engine. The user can zoom and pan to the desired area of interest. Using Google Earth Engine to process and display greenness maps may reduce the current delays faced in obtaining the latest maps for use by national locust centres and FAO's Desert Locust Information Service (DLIS).
Here is an example of a dynamic greenness map covering the entire Desert Locust recession area displayed in Google Earth Engine. The user can zoom and pan to the desired area of interest. Using Google Earth Engine to process and display greenness maps may reduce the current delays faced in obtaining the latest maps for use by national locust centres and FAO's Desert Locust Information Service (DLIS).

Dynamic greenness map of central Mali in Google Earth Engine
Here is an example of zooming into a dynamic greenness map that shows substantial green vegetation in central Mali. The difficulty for ground teams is how to know which vegetation to check that has the highest chance of harbouring locusts. This map can help the teams prioritise areas to just those areas where fresh green annual vegetation appeared in the last week or so as this is favoured by locusts. Accordingly, teams would focus primarily on the larger areas of red-coloured pixels in the north and ignore the other older vegetation (green pixels) elsewhere.
Here is an example of zooming into a dynamic greenness map that shows substantial green vegetation in central Mali. The difficulty for ground teams is how to know which vegetation to check that has the highest chance of harbouring locusts. This map can help the teams prioritise areas to just those areas where fresh green annual vegetation appeared in the last week or so as this is favoured by locusts. Accordingly, teams would focus primarily on the larger areas of red-coloured pixels in the north and ignore the other older vegetation (green pixels) elsewhere.

Using Google Earth Engine to combine different imagery and maps
Here is an example in Google Earth Engine where a dynamic greenness map is displayed with an elevation map in Mauritania. Green vegetation is present along the edges of a wadi (right side of image) and along the base of a plateau (left side). The dark colours are areas of higher elevation. This information can be useful in guiding ground teams to specific areas where there is the greatest likelihood to find green annual vegetation and locusts rather than searching randomly throughout the vast desert.
Here is an example in Google Earth Engine where a dynamic greenness map is displayed with an elevation map in Mauritania. Green vegetation is present along the edges of a wadi (right side of image) and along the base of a plateau (left side). The dark colours are areas of higher elevation. This information can be useful in guiding ground teams to specific areas where there is the greatest likelihood to find green annual vegetation and locusts rather than searching randomly throughout the vast desert.

Combining field data with remote sensing imagery in Google Earth Engine
Another use of Google Earth Engine is to visualise survey results with remote sensing data. Here is an example in Rajasthan, India that shows a dynamic greenness map overlaid onto a map showing roads and towns combined with survey stops (geo-referenced points) made by ground teams from the Locust Warning Organization using eLocust3 to record and transmit data in real time. In this way, an analysis can be done comparing the survey results with the greenness map.
Another use of Google Earth Engine is to visualise survey results with remote sensing data. Here is an example in Rajasthan, India that shows a dynamic greenness map overlaid onto a map showing roads and towns combined with survey stops (geo-referenced points) made by ground teams from the Locust Warning Organization using eLocust3 to record and transmit data in real time. In this way, an analysis can be done comparing the survey results with the greenness map.

Google Earth Engine allows rapid and easy access to the current global Desert Locust situation
Another use of Google Earth Engine is sharing of data between locust-affected countries so that everyone knows the current Desert Locust situation. The user can zoom in/out and pan to any area of interest, and click on each of the points to see the vegetation and locust details of that location. This information is critical for successful early warning and preventive control.
Another use of Google Earth Engine is sharing of data between locust-affected countries so that everyone knows the current Desert Locust situation. The user can zoom in/out and pan to any area of interest, and click on each of the points to see the vegetation and locust details of that location. This information is critical for successful early warning and preventive control.
The next challenge: putting Google Earth Engine into the hands of locust officers in the field
The next challenge is to integrate several technologies into a powerful tool for locust-affected countries. We have seen the potential for Google Earth Engine to allow faster, easier and more powerful access and analysis of remote sensing imagery used in Desert Locust early warning and preventive control. However this is mainly used by locust information officers and others within their office in the national locust centre where there is electricity, Internet connection and computers. Wouldn't it be even better to put this into the hands of the officers in the field who are actually looking for green vegetation and locusts? But this requires a computer and Internet connection in the middle of nowhere. All field officers currently use eLocust3 (a rugged Android tablet) and Google is working on its Project Loon to provide Internet via balloons. The challenge is to bring these two together and they may be closer than we think.
The next challenge is to integrate several technologies into a powerful tool for locust-affected countries. We have seen the potential for Google Earth Engine to allow faster, easier and more powerful access and analysis of remote sensing imagery used in Desert Locust early warning and preventive control. However this is mainly used by locust information officers and others within their office in the national locust centre where there is electricity, Internet connection and computers. Wouldn't it be even better to put this into the hands of the officers in the field who are actually looking for green vegetation and locusts? But this requires a computer and Internet connection in the middle of nowhere. All field officers currently use eLocust3 (a rugged Android tablet) and Google is working on its Project Loon to provide Internet via balloons. The challenge is to bring these two together and they may be closer than we think.

See also
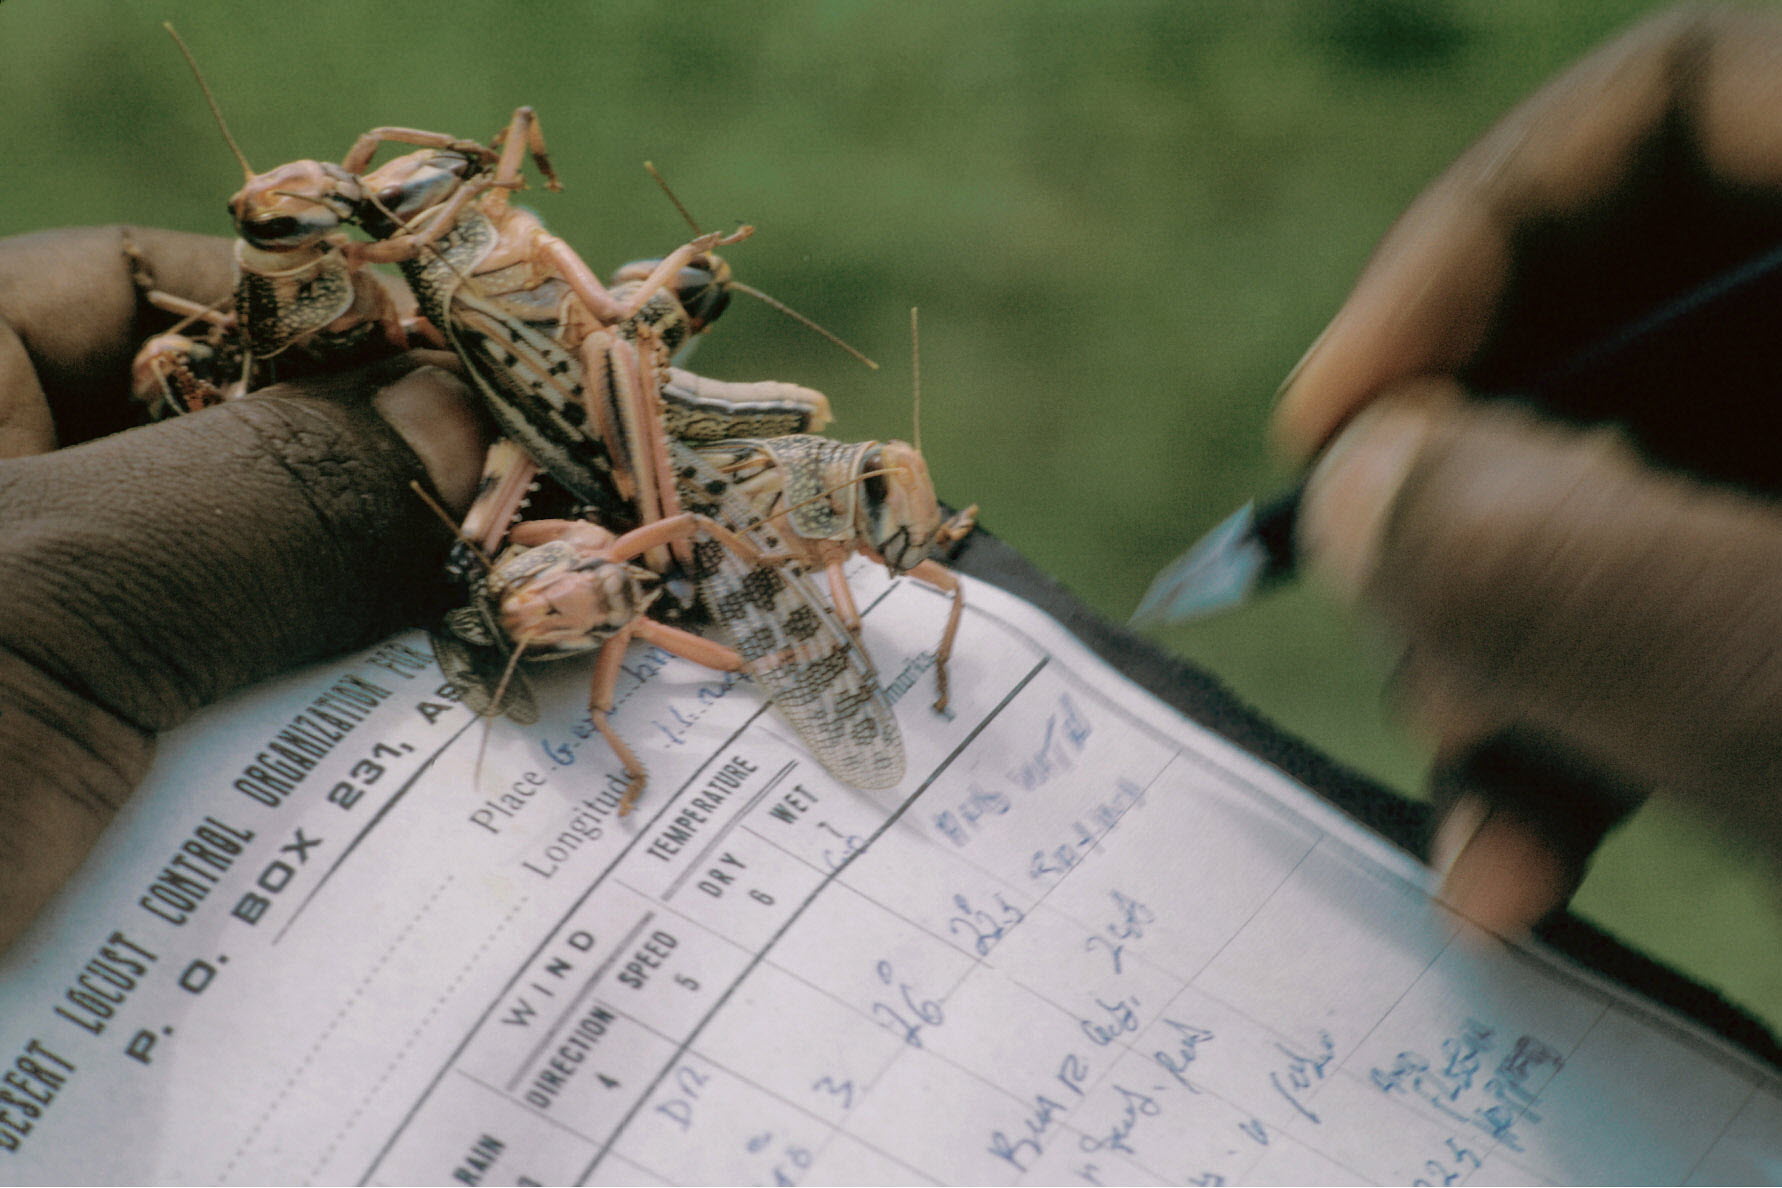
eLocust2: field data entry & transmission
Handheld device for locust officers to record survey and control results in the field and transmit them via satellite to their National Locust Centres
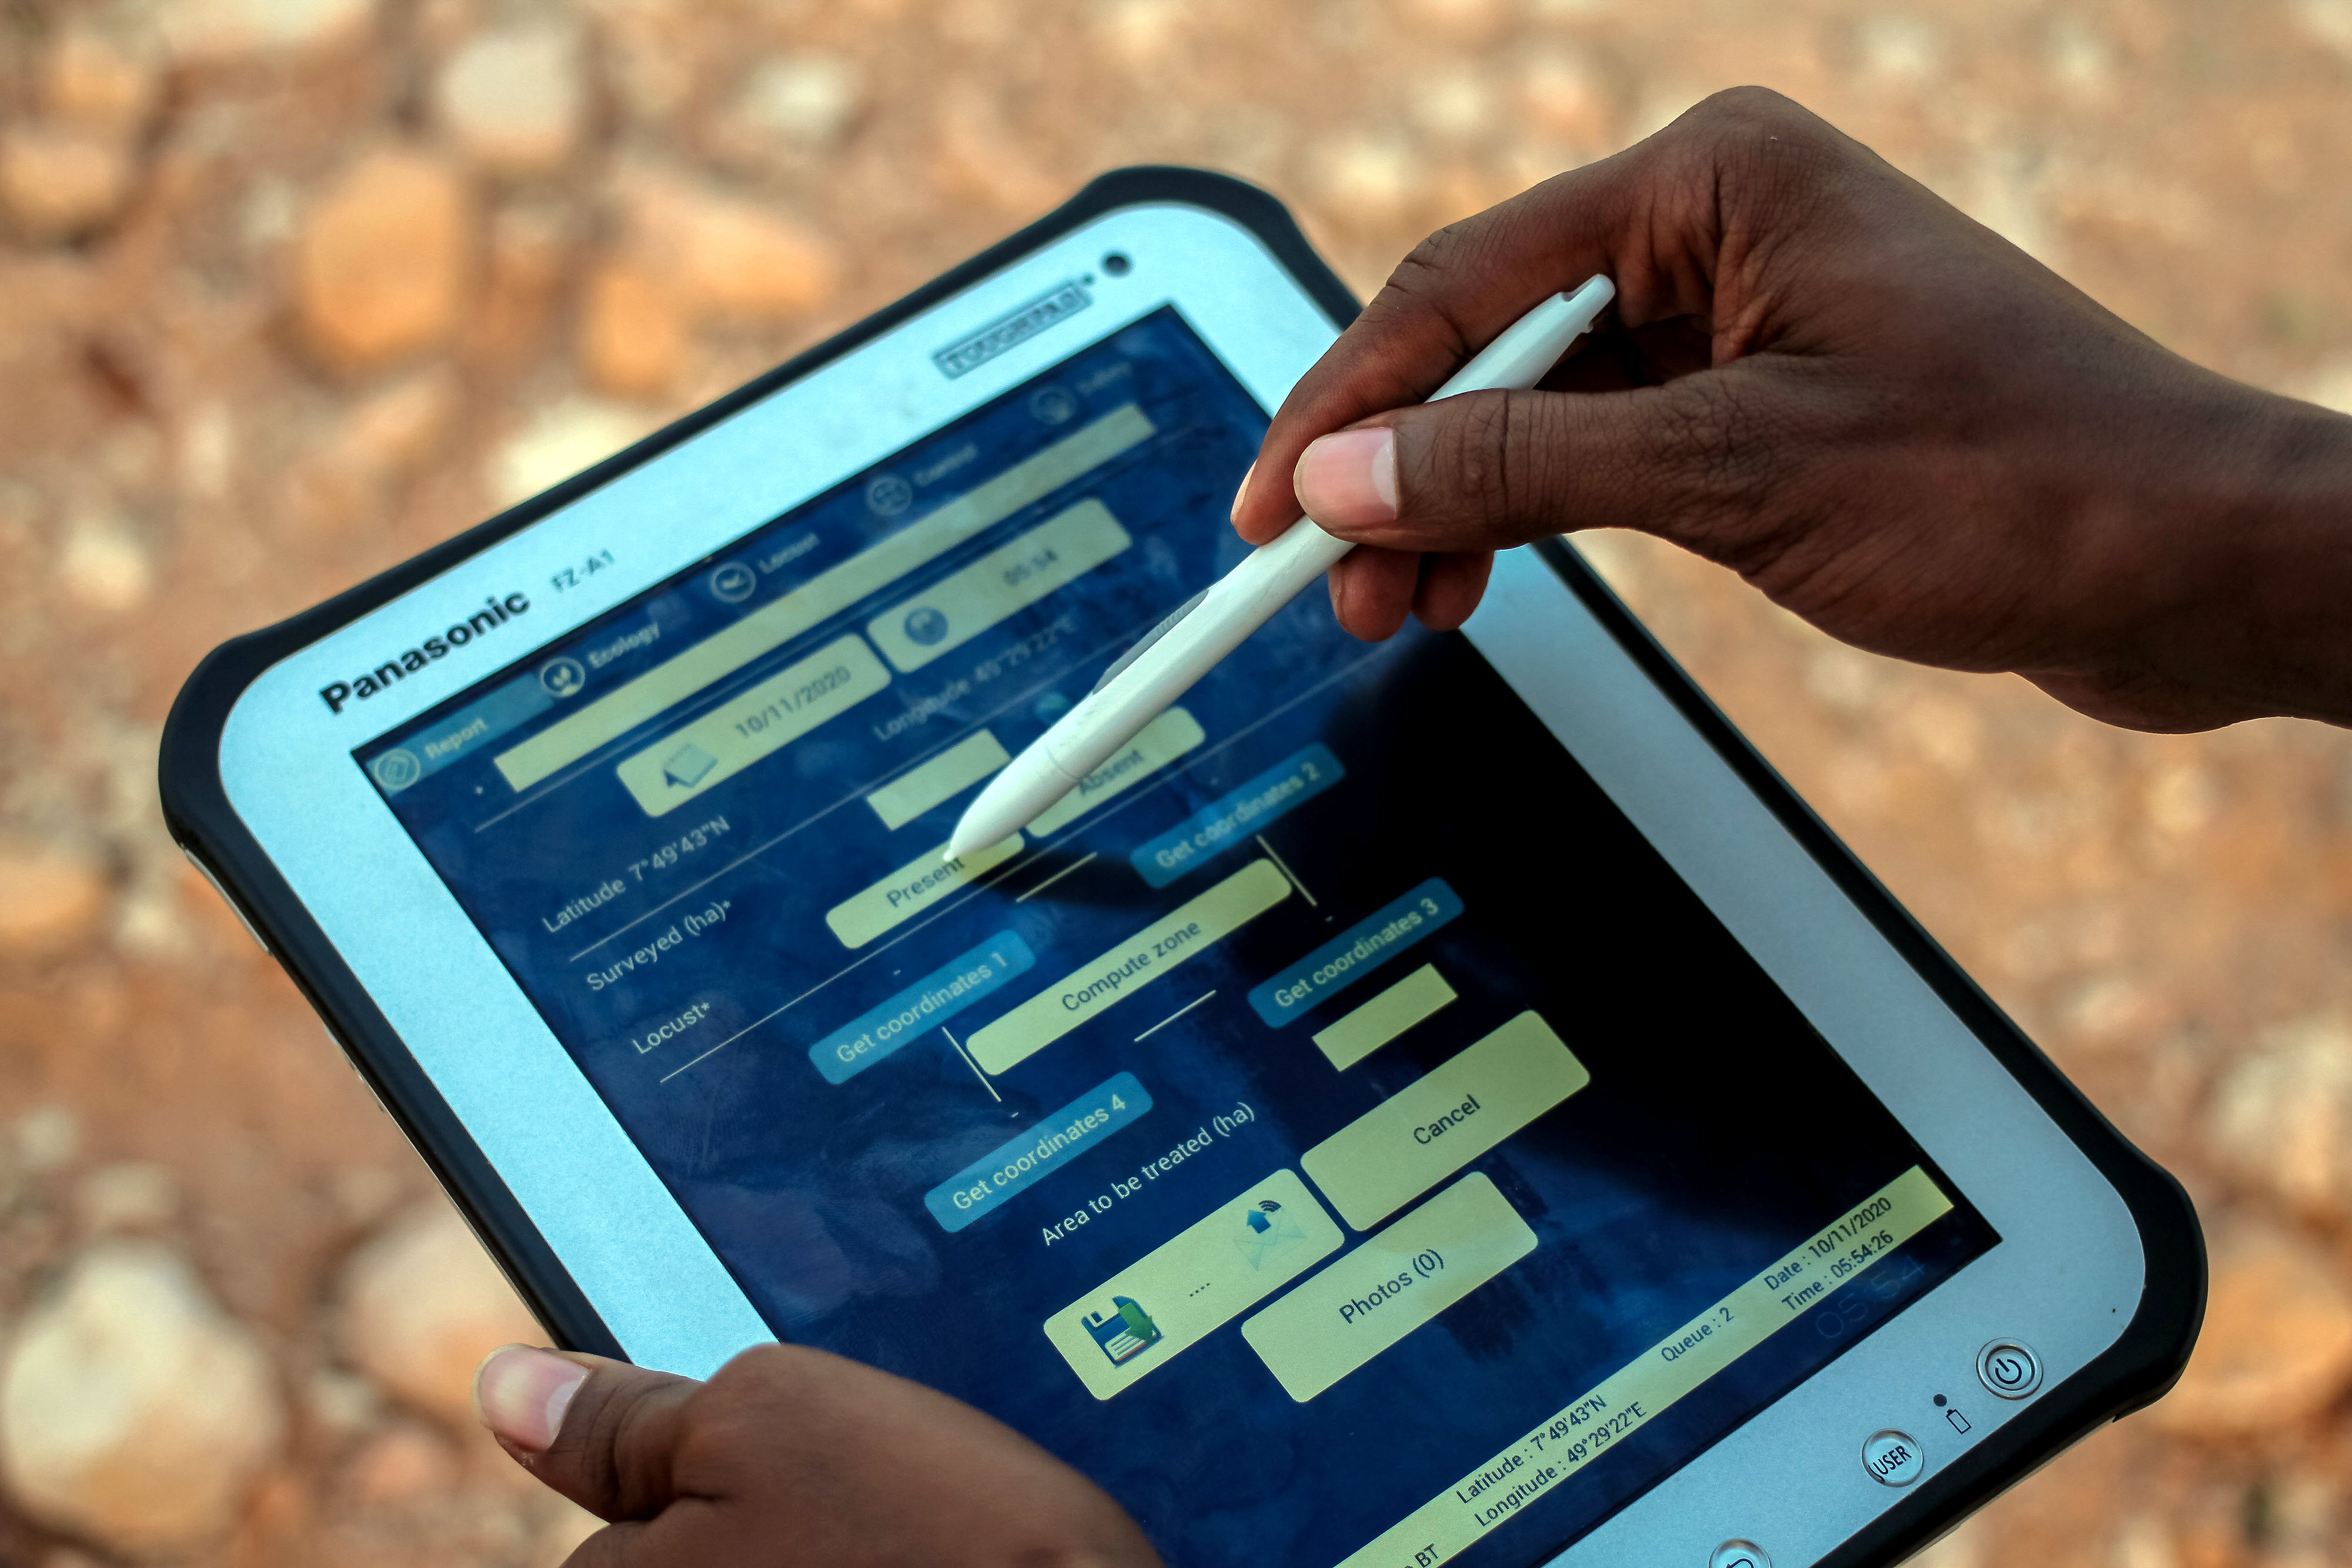
eLocust3: updated field data entry & transmission
eLocust3 is a handheld device used by national field officers during survey and control operations in countries affected by the Desert Locust
MODIS
A dynamic map that shows where vegetation is present in the desert and how long it has been green to better monitor Desert Locusts habitats
Desert Locust Information Service
The Desert Locust Information Service (DLIS) at FAO Headquarters (Rome, Italy)
Early Warning
The basic components that are required for any early warning system to be effective and reliable