AQUASTAT - FAO's Global Information System on Water and Agriculture
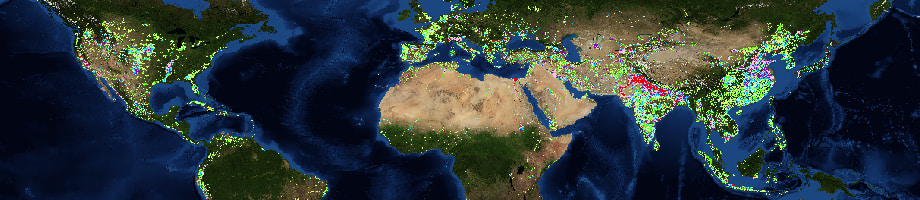
Global map of irrigated areas
![]()
Introduction
The Land and Water Division of the Food and Agriculture Organization of the United Nations and the Rheinische Friedrich-Wilhelms-Universität in Bonn, Germany, are cooperating in the development of a global irrigation mapping facility. The mandate of the Food and Agriculture Organization calls for the dissemination of global information on food and agriculture. Through its Land and Water Division, it maintains an information system on water and agriculture and systematically collects, analyzes and disseminates this information. The first global digital map of irrigated areas on the basis of cartographic information and FAO statistics has a resolution of 0.5 degree and was developed in 1999 by Stefan Siebert and Petra Döll. At the time of the development of the first version of the map they were working at the Center for Environmental Systems Research of the University of Kassel. In 2004 they both moved to the Johann Wolfgang Goethe University Frankfurt am Main and since 2009 Stefan Siebert is working at the University of Bonn.
Since 1999 the methodology to produce the map has been improved which made it possible to increase the spatial resolution of the map to 5 minutes (about 10 km at the equator). The objective of the cooperation between the Universities and FAO is to develop global GIS coverage of areas equipped for irrigation and to make it available to users in the international community. The data collected through the AQUASTAT surveys will be used to improve the overall quality and resolution of the information.
NOTE
Country-level time series on area equipped for irrigation, starting in 1961, can be found on the FAOSTAT website by choosing the item "Total area equipped for irrigation".


